Performance Analysis of Hybrid approach
of Clustering Algorithms
Er. Alankrita Aggarwal, Neetu Wadhwa
Department of CSE, Haryana College of Technology & Management, Kaithal, India
Abstract -Clustering is a way that classifies the raw data reasonably and searches the hidden patterns that may exist in datasets. It is a process of grouping data objects into disjoint clusters so that data in the same cluster are similar, and data belonging to different cluster are differ. Many algorithms have been developed for clustering. In this paper we are reviewing performance analysis of hybrid approach of different clustering algorithms like K-Means , HAC , SOM .
I. INTRODUCTION
Clustering is a way that classifies the raw data reasonably and searches the hidden patterns that may exist in datasets. It is a process of grouping data objects into disjoint clusters so that data in the same cluster are similar, and data belonging to different cluster are differ. Many algorithms have been developed for clustering.Apart from the two main categories of partitional and hierarchical clustering algorithms, many other methods have emerged in cluster analysis, and are mainly focused on specific problems or specific data sets available. These methods include :
Density-Based Clustering : These algorithms group objects according to specific density objective functions. Density is usually defined as the number of objects in a particular neighbourhood of a data objects. In these approaches a given cluster continues growing as long as the number of objects in the neighbourhood exceeds some parameter. This is considered to be different from the idea in partitional algorithms that use iterative relocation of points given a certain number of clusters.
Grid-Based Clustering : The main focus of these algorithms is spatial data, i.e., data that model the geometric structure of objects in space, their relationships, properties and operations. The objective of these algorithms is to quantize the data set into a number of cells and then work with objects belonging to these cells. They do not relocate points but rather build several hierarchical levels of groups of objects. In this sense, they are closer to hierarchical algorithms but the merging of grids, and consequently clusters, does not depend on a distance measure but it is decided by a predefined parameter.
Model-Based Clustering : These algorithms find good approximations of model parameters that best fit the data. They can be either partitional or hierarchical, depending on the structure or model they hypothesize about the data set and the way they refine this model to identify partitionings. They are closer to density-based algorithms, in that they grow particular clusters so that the preconceived model is improved. However, they
sometimes start with a fixed number of clusters and they do not use the same concept of density.
Categorical Data Clustering : These algorithms are specifically developed for data where Euclidean, or other numerical-oriented, distance measures cannot be applied. In the literature, we find approaches close to both partitional and hierarchical methods. For each category, there exists a plethora of sub-categories, e.g., density-based clustering oriented towards geographical data, and algorithms for finding clusters. An exception to this is the class of categorical data approaches. Visualization of such data is not straightforward and there is no inherent geometrical structure in them, hence the approaches that have appeared in the literature mainly use concepts carried by the data, such as co-occurrences in tuples. On the other hand, categorical data sets are in abundance.
II CLUSTERINGALGORITHMSCHOSENFOR
HYBRIDAPPROACH
K-means [9] is a prototype-based, simple partitional clustering technique which attempts to find a user-specified k number of clusters. These clusters are represented by their centroids. A cluster centroid is typically the mean of the points in the cluster. This algorithm is simple to implement and run, relatively fast, easy to adapt, and common in practice. The algorithm consist of two separate phases: the first phase is to select k centers randomly, where the value of k is fixed in advance. The next phase is to assign each data object to the nearest center. Euclidean distance is generally considered to determine the distance between each data object and the cluster centers. When all the data objects are included in some clusters, recalculating the average of the clusters.
This iterative process continues repeatedly until the criterion function becomes minimum. The k means algorithm works as follows:
a) Randomly select k data object from dataset D as initial cluster centers.
b) Repeat
a. Calculate the distance between each data object di(1<=i<=n) and all k cluster centers cj(1<=j<=n) and
assign data object di to the nearest cluster.
b. For each cluster j(1<=j<=k), recalculate the cluster center.
c. Until no changing in the center of clusters.
The k-means algorithm[12] updates cluster centroids till local minimum is found. Before the k-means algorithm converges, distance and centroid calculations are done while loops are executed a number of times, say l, where the positive integer l is known as the number of k-means iterations. The precise value of l varies depending on the initial starting cluster centroids even on the same dataset. Hierarchal AgglomerativeClustering
HAC[3] is a clustering method that produces “natural “ groups of examples characterized by attributes. A tree, called dendrogram, where successive agglomerations are showed, starting from one example per cluster, until the whole dataset belong to one cluster, describes the clustering process.
1. Initialize the cluster set assuming each data point be a distinct cluster.
2. Compute the similarity between all pairs of clusters i.e evaluate the similarity matrix whose ijth entry gives the similarity between the ith and jth clusters.
3. Merge the most similar (closest ) two clusters.
4. Update the similarity matrix to reflect the pairwise similarity between the new cluster and the original (remaining clusters).
5. Repeat steps 3 and 4 untill only a single cluster remains The main advantage of HAC is the user can guess the right partitioning by visualizing the tree, he usually prune the tree between nodes presenting an important variation. The main disadvantage is that requires the computation of distances between each example, which is very time consuming when the dataset size increases.
Self Organising Map Algorithm
The SOM[5] is an algorithm used to visualize and interpret large high-dimensional data sets. Typical applications are visualization of process states or financial results by representing the central dependencies within the data on the map. The map consists of a regular grid of processing units, "neurons". A model of some multidimensional observation, eventually a vector consisting of features, is associated with each unit. The map attempts to represent all the available observations with optimal accuracy using a restricted set of models. At the same time the models become ordered on the grid so that similar models are close to each other and dissimilar models far from each other. Randomly choose an input vector x.
Determine the "winning" output node i, where wi is
the weight vector connecting the inputs to output
node i. Note: the above equation is equivalent to wi x >= wk
x only if the weights are normalized.
Given the winning node i, the weight update is
where is called the neighborhood function that has value 1 when i=k and falls off with the distance |rk - ri |
between units i and k in the output array. Thus, units close to the winner as well as the winner itself, have their weights updated appreciably. Weights associated with far away output nodes do not change significantly. It is here that the toplogical information is supplied. Nearby units receive similar updates and thus end up responding to nearby input patterns.
III LITERATURE SURVEY
Recently many commercial data mining clustering techniques have been developed and their usage is increasing tremendously to achieve desired goal.
Data mining is a convenient way of extracting patterns, which represents knowledge implicitly stored in large data sets and focuses on issues relating to their feasibility, usefulness, effectiveness and scalability. It can be viewed as an essential step in the process of knowledge discovery. Data are normally preprocessed through data cleaning, data integration, data selection, and data transformation and prepared for the mining task. Data mining can be performed onvarious types of databases and information repositories, but the kind of patterns to be found are specified by various data mining functionalities like class description, association, correlation analysis, classification, prediction, cluster analysis etc.
Clustering is a way that classifies the raw data reasonably and searches the hidden patterns that may exist in datasets. It is a process of grouping data objects into disjoint clusters so that data in the same cluster are similar, and data belonging to different cluster are differ. Many algorithms have been developed for clustering.
A clustering algorithm typically considers all features of the data in an attempt to learn as much as possible about the objects. However, with high dimensional data, many features are redundant or irrelevant. The redundant features are of no help for clustering; even worse, the irrelevant features may hurt the clustering results by hiding clusters in noises. There are many approaches to address this problem. The simplest approach is dimension reduction techniques including principal component analysis (PCA) and random projection. In these methods, dimension reduction is carried out as a preprocessing step.
considered impracticable criteria, especially for large number of clusters. Therefore different methods have been proposed in literature [6].
[12]Fahim A. M. et al. proposed an efficient method for assigning data points to clusters. The original k-means algorithm is computationally very expensive because each iteration computes the distances between data points and all the centroids. Fahim’s approach makes use of two distance functions for this purpose- one similar to k-means algorithm and another one based on a heuristics to reduce the number of distance calculations. But this method presumes that the initial centroids are determined randomly, as in the case of the original k-means algorithm. Hence there is no guarantee for the accuracy of the final clusters.
[13] In 2009, Fahim A M et al. proposed a method to select a good initial solution by partitioning dataset into blocks and applying k-means to each block. But here the time complexity is slightly more. Though the above algorithms can help finding good initial centers for some extent, they are quite complex and some use the k-means algorithm as part of their algorithms, which still need to use the random method for cluster center initialization.
[8] Fang Yuan et al. proposed a systematic method for finding the initial centroids. The centroids obtained by this method are consistent with the distribution of data. Hence it produced clusters with better accuracy, compared to the original k-means algorithm.
However, Yuan’s method does not suggest any improvement to the time complexity of the k-means algorithm.
[9] Nazeer et al. (2009) proposed an enhanced k-means, which combines a systematic method for finding initial centroids and an efficient way of assigning data point to cluster.
[4], Xu et al. (2009) specify a novel initialization scheme to select initial cluster centers based on reverse nearest neighbor search. But all the above methods do not work well for high dimensional data sets. In another previous work [18], the new approach was proposed to find the initial centroid using PCA and we compared the results with existing methods. In [19], author used a method for iris dataset and have compared the results with other initialization method. This new method was outperformed with better accuracy and less running time than the existing methods. In this paper, we have applied our proposed method for wine, glass and imagesegmentation dataset. To improve the efficiency of our method we have used heuristics approach to reduce the number of distance calculation in the standard k-means algorithm. Computational complexity of the original k-means algorithm is very high in high dimensional data. Different methods have been proposed [1] by combining PCA with k-means for high dimensional data. But the accuracy of the k-means clusters heavily depending on the random choice of initial centroids.
IV DATASETUSED
Two datasets used in this work are IRIS dataset and wine dataset. Both are taken from UCI repository site. IRIS dataset have 3 classes i.e Setosa, versicolor and verginica while wine dataset used to predict three types of wine i.e ‘A’, ‘B’, ‘C’. We have applied each K-Mean and SOM individually and then applied HAC on each algorithm and compared the results.
VPROPOSEDWORKANDIMPLEMENTATION
There will be following objectives of this work.
*Application of K-means, K-SOM and HAC algorithm on different datasets.
* Comparison of the hybrid approach on different datasets.
The objective of this works is to analyze, simulate and do a comparative analysis of three clustering algorithms when applied on different datasets. These three algorithms have different properties and based on the way they are designed, they give different results when applied on same dataset. Therefore it becomes essential to analyze each algorithm by running it in an ideal environment and find out how it performs, so that appropriate methodologies could be followed in the future research works to improve on the areas where a algorithm is lacking.
Implementation of all algorithm on IRIS dataset.
(X1) Petal Width (cm) vs. (X2) Sepal Length (cm) by (Y) Cluster_KMeans_1
c_kmeans_1 c_kmeans_2 c_kmeans_3 2 1
7 6 5
Figure 1.1 K-means clusters of IRIS Dataset
From figure1 and figure 2 we can easily see the difference. As clusters in figure2 are easily differentiable while there is some overlapping in clusters created by K-means.
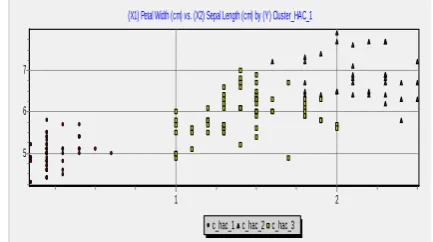
(X1) Petal Width (cm) vs. (X2) Sepal Length (cm) by (Y) Cluster_HAC_1
c_hac_1 c_hac_2 c_hac_3 2 1
7 6 5
(X1) Petal Width (cm) vs. (X2) Sepal Length (cm) by (Y) Cluster_SOM_1
c_som_1_1 c_som_2_1 c_som_3_1 2 1
7
6
5
Figure 1.3 Cluster results for k-SOM algorithm on Iris Dataset
(X1) Petal Width (cm) vs. (X2) Sepal Length (cm) by (Y) Cluster_HAC_1
c_hac_1 c_hac_2 c_hac_3 2 1
7
6
5
Figure 1.4 Cluster results for k-SOM +HAC algoritnm on Iris Dataset
similarly From figure 1.3 and figure 1.4 we can easily see the difference. As clusters in figure 1.4 are easily differentiable while there is some overlapping in clusters created by K-SOM.
Figure 1.5 Overall Performance Comparison Of Different Algorithms
Implementation of K-MEANS algorithm on
Wine dataset.
Before applying K-Means algorithm on wine dataset we have applied some statistical heuristics to remove outliers.
(X1) Proline vs. (X2) Malic Acid by (Y) Cluster_KMeans_1
c_kmeans_1 c_kmeans_2 c_kmeans_3
4 3
2 14
13
12
11
(Figure 1.6 Cluster results for k-Mean algorithm on Wine Dataset)
(X1) Proline vs. (X2) Malic Acid by (Y) Cluster_HAC_1
c_hac_1 c_hac_2 c_hac_3
4 3
2 14
13
12
11
Figure 1.7 Cluster results for k-Mean+HAC algoritnm on Wine Dataset
From figure 1.6 and figure 1.7 we can easily see the difference. As clusters in figure 1.7 are easily differentiable while there is some overlapping in clusters created by K-means.
(X1) Proline vs. (X2) Malic Acid by (Y) Cluster_KMeans_1
c_kmeans_1 c_kmeans_2 c_kmeans_3
4 3
2 14
13
12
11
Figure 1.8 Cluster results for k-Mean algoritnm on Wine Dataset
(X1) Proline vs. (X2) Malic Acid by (Y) Cluster_HAC_1
c_hac_1 c_hac_2 c_hac_3
4 3
2 14
13 12 11
Figure 1.9 Cluster results for k-Mean+HAC algoritnm on Wine Dataset
Now it is time to plot a overall comparison figure which will reveal the accuracy of each algorithm for each class of Wine. Figure below is a overall performance figure of each algorithm. Each algorithm is giving different results depending upon the accuracy level
K-Mean K-HAC SOM S+HAC
A 88.7 87.3 85.7 95.8
B 91.7 93.7 91.5 80
C 85.5 88.7 83.9 83.6
Table 1.17 Overall result comparison table for wine dataset
Based on table 1.17 chart is drawn to clearly see the results. Figure 1.9 clearly reveals that K-means +HAc is giving better results comparative to other algorithms
Figure 1.9 Overall comparison chart for wine datset
VI CONCLUSION
In this paper we have applied K-Means, Ksom ,K-Means+HAC, K-SOM+HAC algorithms on iris and wine dataset. Different algorithm gives different results. At last we studied their accumulative performance. Hybrid algorithm are giving better performance than the individual algorithm e.g in both datasets K-means+HAC is giving better performance rather k-Mean itself.
VII FUTURE WORK
In future we can study the performance of hybrid algorithm in respect of time and space complexity i.e whether we can save space and time by running hybrid algorithms on different datasets.
REFERENCES
[1] Tajunisha N., Saravanan V.,”An increased performance of clustering high dimensional data using Principal Component
Analysis”,Proceedings of the IEEE fist international conference on
integrated intelligent computing pp 17-21,(2010).
[2] B.Chandra., “Hybrid Clustering Algorithm” , IEEE International Conference on Syatem, Man and cybernetics(Dec 2009).
[3]Abu Abbas., “Comparison between Data Clustering algorithms” , International Arab Journal of IT Vol 5 (July 2008)
[4] Rui Xu, “Survey of Clustering Algorithms”, IEEE Transaction on Neural N/w (May 2005)
[5] Sundareshan M.K, “Comparison of SOM with K-Means hierarichal
clusetering for bioinformatic comparison” , IEEE international joint
conference on Neural Network (2004)
[6] Honda, K.Notsu, “Fuzzy PCA-Guided Robust K-Means Clustering”
IEEE Transactions on fuzzy syatem( Feb 2010)
[7] H.S Behara, “An Improved Hybridized K-Means Algorithm for
high dimensional dataset and its performance analysis” ,
International Journal of Computer Sc & Enggineering(Mar 2010) [8] Bembiring, Zain & Embang, “Clustering high Dimensional data
using subspace and projected clustering algorithms.”, IJCSIT(Aug
2010).
[9] Abdul Nazar, “ Improving the accuracy and efficiency of the
K-Means clustering algorithm” , Proceeding of world congress on engg
Vol I (WCE 2009)
[10] T. Kanungo, “ An Efficient k-Means clustering algorithm: Analysis
and Implementation”, IEEE Transaction on Pattern Analysis and
Machine Intelligence (July 2002).
[11] Rajshree Dash, Debahuti Mishra, “A Hybridized K-Means
clustering approach for high dimensional dataset”, IJEST (2010)
[12] Fahim A.M,Salem A.M, Torkey A and Ramadan M.A (2006) : An
Efficient enchanced k-means clustering algorithm,Journal of
Zhejiang University,10(7): 1626-1633,2006.
[13] Fahim A.M,Salem A.M, Torkey F. A., Saake G and Ramadan M.A (2009): An Efficient k-means with good initial starting points, Georgian Electronic Scientific Journal: Computer Science and Telecommunications, Vol.2, No. 19,pp. 47-57.
[14] Nazeer K. A., Abdul and Sebastian M.P. (2009): “Improving the
accuracy and efficiency of the kmeans clustering algorithm”,
Proceedings of the World Congress on Engineering,Vol. 1, pp. 308-312.
[15] Samarjeet Borah, Mrinal Kanti Ghose, “Performance Analysis of AIM-K-Means and K-means in Quality cluster generation,”
Journal of computing, Volume1, issue 1, December 2009.
[16] Adam schenker, mark last, horst bunke, Abraham kandel:
“Comparison of two noval algorithm for clustering using web
documents, WDA”, (2003)
[17] Arthur D., vassilvitskii S.(2007): K-means++ the advantages of careful seeding, on discrete algorithms (SODA).
[18] Jolliffe I.T. (2002): Principal Component Analysis, Springer, Second edition.
[19] Babu G. and Murty M. “A near Optimal initial seed value selection in k-means algorithm using a genetic algorithm, Pattern
Recognition Letters” Vol.14,1993, PP, 763-769. (2003)
[20] Chris Ding and Xiaofeng He: “k-means Clustering via Principal
component Analysis”, In Proceedings of the 21st international
conference on Machine Learning, Banff, Canada(2004).