23
Optimization of Cutting Parameters and Grinding
Process for Surface Roughness using Taguchi Method
and CFD Analysis
R. R. Chakule
1,
Prof. S. M. Choudhary
2,
Prof. (Dr.) S.B. Karanjekar
3,
Prof. P. S. Talmale
4Mechanical Engineering Department 1, 2, 3, 4
Wainganga College of Engineering & Management, Nagpur1, 2, 3
Late G.N. Sapkal College of Engineering, Nasik 4
Email: [email protected]1, [email protected],
[email protected],[email protected]4
Abstract- Grinding is one of the important metal cutting processes used extensively in the finishing operations.
During an abrasive material removal process a lot of heat developed because of high friction. The conventional method of cooling consumes high amount of coolant but still insufficient to control thermal related problems. The proper penetration of coolant is not possible and most of the fluid goes in waste form. This is harmful to environment and workers health. Surface finish is dependent output response in the production process with respect to quantity and quality. This is mainly depends on different input parameters like cutting fluid, wheel speed, work piece speed, depth of cut, grinding wheel grades, material hardness etc. The main objective is to achieve good surface finish by optimizing parameters and analyze the process using CFD by constructing the 3-D model which gives simulation of grinding process. 3-Distribution of temperatures, pressures, velocities and flow pattern in and around the grinding region are obtained in more detail. Such results are helpful to obtain optimized grinding process. In this study the Taguchi method that is a powerful tool to design optimization for quality is used to find the optimum surface roughness in grinding operation. An orthogonal array, a signal-to-noise (S/N) ratio and an analysis of variance (ANOVA) are employed to investigate the surface roughness characteristic for grinding operations. The material hardness and microstructure are examined and optimum grinding parameters are found out for better surface roughness. The experimental results of this study shows that coolant flow rate and table speed have significant effects on the surface roughness while depth of cut has a lower effect on it.
Index Terms- Analysis of Variance (ANOVA), Computational Fluid Dynamics (CFD), Coolant, Grinding,
Surface Roughness (Ra).
1. INTRODUCTION
Grinding machines are generally used for achieving of high dimensional accuracy surfaces and good surface finish. In most cases, the grinding is the final processing operation [1], [2]. The grinding wheel is formed by aggregate of cutting edges with negative rake angles, creates comparatively large amount of heat over the cutting operation. A large amount of coolant is needed to achieve the grinding performance in terms of grinding forces, metal removal rate; temperature developed in grinding zone, Specific energy and better work piece surface finish [3]. The traditional function of coolant may be cooling, lubrication, corrosion inhibition, chip removal. It may vary for machining operations. In case of Grinding, the cooling is more preferable than lubricity as high amount of heat develops due to high speed rotation of grinding wheel. These functions of coolant give improvement in tool life and surface finish. Generally the coolants are categorized into Straight type, Soluble, Synthetic and Semi-synthetic type. A large use of coolants requires high amount of cost which is approximately 15 % of total production cost [4]. The major problem is dispose of it after use since it contains toxic contaminants which pollute the land.
Different institute and agency has introduced several health and safety norms due to harmful emission from coolant to worker [5]. Thus from cost, health and environmental point of view, two alternatives are important either to make eco-friendly coolant or use less coolant for grinding operation.
2. LITERATURE REVIEW
The literature review focuses on the literature study done on the review of related journal- papers, articles available as open literature. This literature covers the grinding process related to input parameter such as cutting fluids, machining parameters on output parameters with the different optimization method.
24 cylindrical grinding with Al2O3 type grinding wheel.
They found that, the water soluble oil as cutting fluid is the most influential parameter followed by depth of cut and work piece speed. The optimum results of parameters are seen for water soluble oil when highest work piece speed of 120 rpm and high depth of cut of 500 µm. Confirmation test gives surface roughness of 0.4246 µm and material removal rate of 0.0974 gm/sec.
Halil Demir et al. [7] has studied the effect of grain size of grinding wheel and depth of cut on surface roughness of AISI 1050 steel material using a Surface Grinder. The machining related parameters like grinding wheel revolution, wheel dressing rate and coolant flow rate are considered constant during experimentation. The result gives lowest surface roughness value when grind by wheel of 80 grain size compare to grinding wheel of 36 and 46 grain size. Generally low grain number wheel used for large volume of chip removal operation. It is also observed that during all stages of experimentation study, surface roughness value significantly increases with increase in depth of cut.
M. Aravind, Dr. S. Periyasamy [8] performed the experimentation on horizontal spindle hydraulic surface grinding machine for selected process parameters namely abrasive grain size, depth of cut and feed on AISI 1035 steel material. The minimum surface roughness value found by Taguchi method at grain size of 60 meshes, depth of cut of 0.05 mm and feed of 0.2 mm. The surface roughness value obtained by Response Surface Methodology gives more good result compare to Taguchi technique for same input process parameters. They concluded that feed of the surface grinding has minimum effect on the surface roughness of material.
Mustafa Kemal Kulekc [9] analyzed the process parameters for AISI 1040 steel plate material using L9 orthogonal array for optimum surface roughness. The work is carried on surface grinding machine using EKR46K type grinding wheel. The grinding parameters considered are wheel speed, feed rate and depth of cut. They concluded that the optimum grinding parameter combination using Taguchi method includes wheel speed of 1500 r/min and depth of cut of 0.05 mm. The contribution order by ANOVA technique found as 50%, 40% and 10% for depth of cut, wheel speed and feed rate respectively.
Ebbrell et al. [10] analyzed the velocity direction of air that can split into two streams when fluid approaches the grinding zone i.e. the boundary layer along the grinding wheel and the reversed air flow along the workpiece. The effect of the boundary layer especially near the grinding zone shows the grinding fluid of low velocity. Thus proper penetration of coolant is not possible.
Stefan D. Mihic et al. [11] explain CFD models used to simulate the fluid flow and heat transfer in a grinding process. The main characteristic of grinding is high precision and high surface finish. The relatively
large contact area between tool and workpiece surface creates difficulties in supplying coolant to grinding arc thus resulting thermal damage to workpiece as well as overloading and wear of the grinding wheel. Thus, simulation of grinding process using CFD by creating 3-D model gives the accurate picture and information regarding distribution of temperatures, pressures, fluid flow pattern in and around the grinding region. These results of information are not possible by using experimental work.
Stefan Mihic, Sorin Cioc et al. [12] presents the significance of Computational Fluid Dynamics (CFD) models used to simulate the fluid flow and heat transfer in a grinding process. They explains the importance of correct fluid flow which enhanced process stability, better workpiece quality and tool life. The replacements of numerous experiments which are expensive, time-consuming and have limited capabilities are overcome by CFD technique. The author stated the 3-D model for detailed distributions of temperatures, pressures and flow rates in and around the grinding region.
3. WORKPIECE MATERIAL
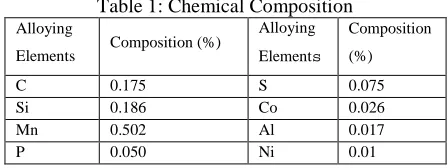
[image:2.595.304.528.465.549.2]The sample size selected for experimentation is 150 mm x 50mm x 20 mm. The black type mild steel plate is taken for experimentation as a sample. Total specimen for experimentation is 15. The sample material is purchased from the local market. The different chemical composition of material tested in lab is given in Table 1.
Table 1: Chemical Composition
Alloying
Elements Composition (%)
Alloying Elements
Composition (%)
C 0.175 S 0.075
Si 0.186 Co 0.026
Mn 0.502 Al 0.017
P 0.050 Ni 0.01
4. EXPERIMENTATION
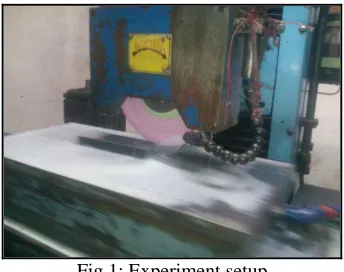
The experiments are carried out by surface grinding machine on 150 mm x 50 mm x 20 mm under wet condition mainly in respect of surface roughness. The experimental setup is shown in fig 1. The coolant is used to reduce the heat and wash away the grinded metal powder produced during contact of work material and grinding wheel. The type of coolant is soluble cutting oil (AQUA CUT125).
25 conducting every experiment the grinding wheel was
[image:3.595.96.268.234.370.2]dressed at 20 µm down feed using a silicon carbide stone. The speed of the workpiece table is varied by adjusting the knob of the hydraulic system. The wheel used for experimentation is of type 90A46/54K6V31 made by aluminum oxide (Al2O3) abrasives with vitrified bond. The size of wheel is 200 mm OD x 20 mm width x 31.75 mm ID with speed of 3000 rpm. The surface roughness is measured by surface roughness tester of model Surftest 211/212. The values of the input process parameters are changed as per design of experiment for the grinding
.
Fig 1: Experiment setup
4.1.Taguchi Method
Taguchi methods of experimental design provide a simple, effective and systematic approach for the optimization of experimental design for performance quality and expected economic production. This method is a unique and powerful statically experimental design technique which greatly improves the engineering productivity. For present study, table speed, depth of cut and coolant flow rate has been identified as input parameters whereas surface finish is the dependent variable to improve performance characteristics of work piece. The levels of input parameters are shown in Table 2.
Table 2: Grinding parameters and their levels
Level
Table Speed (mm/min)
Depth of cut (microns)
Coolant Flow Rate
(ml/min) Coding
Low 6000 30 600 1
Medium 6500 40 1200 2
High 7000 50 1800 3
Nature and the economic consequences of quality engineering in the world of manufacturing process parameters are computed based on the signal to noise (S/N) analysis. Regardless of the category of the performance characteristic, the larger S/N ratio corresponds to the better performance characteristic. Hence the optimal level of the process parameters is the level with the highest S/N ratio. In this surface roughness should be lower, thus lower the better
concept with formula is used to calculate S/N ratio shown in equation (1).
) (1)
Where n = sample size and yi = surface roughness in that run.
Furthermore, a statistical analysis of variance (ANOVA) is performed to obtain optimum process parameters that are statistically significant and the contribution (%) of each of these in surface roughness result. The optimal combination of the process parameters can also be predicted using Minitab 17 software. The design of experiments is shown Table 3.
Table 3: L9 Orthogonal array
Experiment Number
Grinding Parameter Level
Table Speed (mm/min)
Depth of Cut (microns)
Coolant Flow Rate (ml/min)
1 6000 30 600
2 6000 40 1200
3 6000 50 1800
4 6500 30 1200
5 6500 40 1800
6 6500 50 600
7 7000 30 1800
8 7000 40 600
9 7000 50 1200
5. RESULT AND DISCUSSION
After completing the experimental trails using L9 Taguchi orthogonal array, the surface roughness values are measured using surface roughness tester of model Surftest 211/212 and the results are tabulated.
5.1. Optimization using Taguchi Method
Using Minitab 17 software, the S/N ratios are calculated and tabulated. The smaller the better phenomenon is selected because surface quality will be high when value of surface roughness is small.
5.2. Analysis of signal to noise (S/N) ratio
[image:3.595.307.525.325.462.2]26 which connects the levels shows the strong influence
of each control factor. It is observed that coolant flow rate has a strong effect on surface roughness and its S/N ratios. The depth of cut has a lower effect shown shallow shape of the line.
Table 4: L9 Orthogonal Array with S/N Ratios
Expt. No.
Grinding Parameter Level Output
Table Speed (mm/min) Depth of cut (microns) Coolant Flow Rate (ml/min) Surface Roughness (microns) S/N Ratio (dB)
1 6000 30 600 16.9
-24.558
2 6000 40 1200 11.2
-20.984
3 6000 50 1800 12.1
-21.656
4 6500 30 1200 11
-20.828
5 6500 40 1800 15.5
-23.807
6 6500 50 600 16.1
-24.137
7 7000 30 1800 11.6
-21.289
8 7000 40 600 11.5
-21.214
9 7000 50 1200 11.1
-20.906
Table 5: Response Table for S/N Ratio
Level Table Speed Depth of Cut Coolant Flow Rate
1 -22.40 -22.22 -23.30
2 -22.92 -22.00 -20.91
3 -21.14 -22.23 -22.25
Delta 1.79 0.23 2.40
Rank 2 3 1
Table 6 shows the factors and their optimum levels obtained using Minitab software. The Table 7 shows the ANOVA results of surface roughness. It shows that coolant flow rate has a contribution of 45% which shows significant effects on surface roughness. Therefore based on S/N ratio and ANOVA analysis the optimum cutting parameters for surface roughness is found as
Table 6: Factors and their optimum levels using Minitab
Sr.
No Factors Level Optimum Level
1 Table Speed (TS) 3 7000 mm/min 2 Depth of Cut (DOC) 2 40 micron 3 Coolant Flow Rate (CFR) 2 1200 ml/min
Table 7: ANOVA for Surface Roughness
Source DOF SS Mean Square
F value
Contribu tion (%)
TS 2 12.48 6.24 0.94 26
DOC 2 0.326 0.163 0.02 1 % CFR 2 20.92 10.46 1.58 45
Error 2 13.20 6.60 28
Total 8 46.94
7000 6500 6000 -21.0 -21.5 -22.0 -22.5 -23.0 -23.5 50 40
30 600 1200 1800 TS M ea n o f S N r a tio s DOC CFR
Main Effects Plot for SN ratios Data Means
Signal-to-noise: Smaller is better
Fig. 2: Main effect plot for S/N ratios for Ra
The improvement of S/N ratio and surface roughness are further carried to verify the results obtained using Minitab software considering the optimum parameters. This result is compared with experimentation results. The ratio of S/N ratio is determined by using equation (1) and corresponding surface roughness by experimentation.
Table 8: Results of confirmation experiment
Grinding parameter Optimal Experiment parameters Optimum Minitab parameter Impro ved Ra (%) Improved S/N ratio (dB) Table
speed 6500 7000
3.5% 1.4 Depth of
cut 30 40
Coolant
flow rate 1200 1200
27
5.3.Microstructure
(a) Before Grinding
[image:5.595.70.270.93.415.2](b) After Grinding
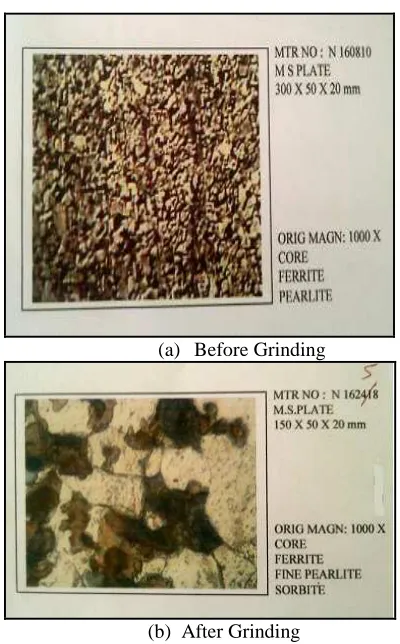
Fig. 3: Microstructure before and after grinding
Fig. 3 (a) and (b) shows the microstructure of the mild steel sample before grinding process which is of fine pearlite having non-uniform distribution of the
structure and have medium and coarse ferrite also has intermediate structure about 8-10 % i.e. it is neither pearlite nor fully ferrite but in between of these. The component after machining process gives a uniform distribution of the structure. The microstructure is determined under the magnification range of 1000X. The nital 3% is used for etching the sample for 30 second.
5.4.Hardness
The sample of mild steel is tested for hardness before and after the grinding. The hardness is tested on Rockwell hardness with B scale. The ball is used of tungsten denoted by notation ‘W’. The hardness of sample before machining is found as 73 HRBW whereas the hardness after machining is 83 HRBW.
5.5.CFD Results
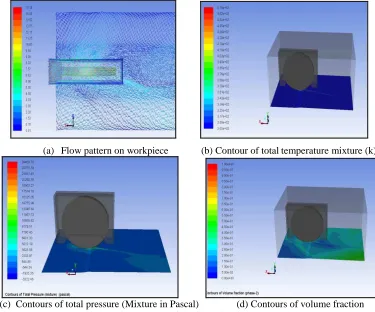
The objective of this work is to adapt and apply the approach and methods used in computational fluid dynamics (CFD) to study the fluid flow in grinding and, thus, obtain a detailed and accurate picture of the distribution of quantities such as temperature, pressure, velocity, and liquid volume fraction and coolant flow patterns. The CFD analysis is carried out at constant table speed of 6500 mm/min and depth of cut of 30 micron for coolant flow rate of 600 ml/min, 1200 ml/min and 1800 ml/min.
[image:5.595.125.476.478.619.2]
28
(a) Flow pattern on workpiece (b) Contour of totaltemperature mixture (k)
[image:6.595.110.485.82.394.2]
(c) Contours of total pressure (Mixture in Pascal) (d) Contours of volume fraction Fig. 5: Results Analysis of Coolant Flow Rate (600ml/min)
(a) Air velocity vectors (m/s) (b) Flow pattern on workpiece
(c) Coolant distribution on workpiece (d) Flow pattern on workpiece (m/s)
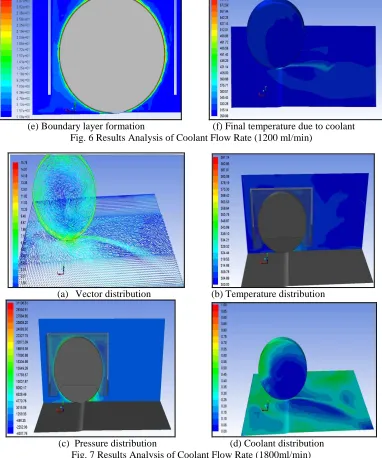
29
(e) Boundary layer formation (f) Final temperature due to coolant Fig. 6 Results Analysis of Coolant Flow Rate (1200 ml/min)
(a) Vector distribution (b) Temperature distribution
[image:7.595.108.490.95.553.2]
(c) Pressure distribution (d) Coolant distribution Fig. 7 Results Analysis of Coolant Flow Rate (1800ml/min)
6. CONCLUSION
In this study, an application and adaption of the Taguchi optimization and quality-control method were established for the optimization of the surface roughness in a grinding process. The objective is to optimized process parameters and grinding process for better surface finish.
1. Three parameters namely table speed, depth of cut and coolant flow rate of each of three levels are used as an input variable whereas the surface finish of job is considered as an output variable. The optimum grinding parameters found from experimentation using L9 Taguchi orthogonal array are table speed of 6500 mm/min, depth of cut of 30 µ m and coolant flow rate of 1200 ml/min.
2. The surface roughness values found from Minitab software for S/N ratio are table speed of 7000 ml/min, depth of cut of 40 µ m and coolant flow rate of 1200 ml/min.
3. The order of contribution is determined by Analysis of Variance (ANOVA) method. The result shows that coolant flow rate (45.52%) and table speed (26.65%) are significant effects on the surface roughness compare to depth of cut. 4. The investigation of surface grinding process
30 5. The microstructure of grinded sample observed
under microstructure gives more uniform distribution of grain structure which helps to improve the results of surface roughness of workpiece.
6. The CFD analysis is studied for three types of coolant flow rates of 600ml/min, 1200 ml/min and 1800ml/min in detail. It is observed that air entrained around a rotating wheel forms a barrier that impedes fluid delivery, thus reducing the useful flow rate. The grinding fluid must first penetrate the air barrier to enter the grinding contact. The air barrier is a sub ambient pressure layer of fast moving air.
7. The reasons for getting better quality results for 1200 ml/min coolant flow rate is explained with CFD as the flow is getting evenly distributed and film formation near wheel.
8. Simulations using the proposed numerical models yielded detailed data and realistic fluid behavior. The distributions of temperatures, pressures and flow rates in and around grinding region were obtained in great detail, which would be difficult or even impossible to obtain using experiments only. 9. The heat transfer coefficient(w/m2-k) along rim
porous and workpiece porous is found as 19130.398 and 10805.339 respectively for coolant flow rate of 1200 ml/min which is highest compared to other two types of coolant flow rate. The highest heat transfer coefficient leads to highest overall cooling also average total temperature along workpiece porous and rim porous is found less for 1200 ml/min.
10.The future development of this work can be in considered in areas like:
• Nozzle geometry can be considered for coolant flow.
• Minimum Quantity Lubrication technique for coolant flow.
• CFD analysis which includes consideration of Minimum Quantity Lubrication and Nozzle geometry for optimizations.
REFERENCES
[1] Brinksmeier E [1991], “Friction, cooling and Lubrication in Grinding”, Manufacturing Technology vol. 48, No.2 pp 581-598.
[2] Ionel Olaru, Dragos-Iulian Nedelcu, “Study of Cooling Lubrication in Grinding Process Simulation”, Recent Advances in Mathematical Methods, Intelligent Systems and Materials, pp 84-87.
[3] T. Yoshimi, S. Oishi, S. Okubo, H. Morita [2010], “Development of Minimized Coolant Supply Technology in Grinding”, JTEKT Engineering Journal English Edition No. 1007E: 54-59. [4] D.P. Adler, W. W-S Hii, D.J. Michalek, and J.W.
Sutherland, “Examining the Role of Cutting
Fluids in Machining and Efforts to Address Associated Environment/ Health Concerns”. [5] T.D. Lavanya, V.E. Annamalai Rodrigo Daun
Monici, Eduardo Carlos [2010], “Design of an Eco-friendly Coolant for Grinding Applications”, International Journal of Advanced Engineering Technology, vol. I Issue II: 46-54.
[6] Suresh P. Thakor, Prof. Dr. D.M. Patel (2014), “An Experimental Investigation on Cylindrical Grinding Process Parameters for En8 Using Regression Analysis”, International Journal of Engineering Development and Research, vol. 2, Issue 2, pp 2486-2491.
[7] Halil Demir, Abdulkadir Gullu, Ibrahim Ciftci (2010), “An Investigation into the Influences of Grain Size and Grinding Parameters on Surface Roughness and Grinding Forces when Grinding”, International Journal of Mechanical Engineering vol.56, pp 447-454.
[8] M. Aravind, Dr. S. Periyasamy (2014), “Optimization of Surface Grinding Process Parameters by Taguchi Method and Response Surface Methodology”, International Journal of Engineering Research and Technology, vol.3, Issue 5, pp 1721-1727.
[9] Mustafa Kemal Kulekci (2013), “Analysis of Process Parameters for a Surface-Grinding Process based on the Taguchi Method”, International Journal of Materials and Technology, vol.47 (1) pp 105-109.
[10]S. Ebbrell, N.H. Woolley, Y.D. Tridimas, D.R. Allanson, W.B. Rowe (2000), “The effects of cutting fluid application methods on the grinding process”, International Journal of Machine Tools and Manufacture, vol. 40, pp 53-61.
[11]Stefan Mihic, Sorin Cioc, Ioan Marinescu and Michael Weismiller(2013), “Detailed Study of Fluid Flow and Heat Transfer in the Abrasive Grinding Contact Using Computational Fluid Dynamics Methods”, Journal of Manufacturing Science and Engineering, vol. 135/041002-1. [12]Stefan Mihic, Sorin Cioc, Ioan Marinescu and