Using In-Process Testing Metrics to Estimate
Post-Release Field Quality of Java Programs
Nachiappan Nagappan
1, Laurie Williams
2, Mladen Vouk
3,
Jason Osborne
4Abstract
In industrial practice, information on the software field quality of a product is available too late in the software lifecycle to guide affordable corrective action. An important step towards remediation of this problem lies in the ability to provide an early estimation of post-release field quality. This paper presents a suite of nine static in-process unit test metrics, the Software Testing and Reliability Early Warning for Java (STREW-J) metric suite. The STREW-J metrics can be used to leverage the software testing effort to predict post-release field quality early and throughout the software development phases. The metric suite is applicable for software products implemented in Java for which an extensive suite of automated unit test cases are incrementally created as development proceeds.
We built and validated a prediction model using the STREW-J metrics via a three-phase case study approach which progressively involved 22 small-scale academic projects, 27 medium-sized open source projects, and five industrial projects. The ability of the STREW-J metric suite to estimate post-release field quality via a statistical regression model was evaluated in the three different environments. The error in estimation and the sensitivity of the predictions indicate the STREW-J metric suite can be used effectively to predict post-release software field quality.
Keywords: Software Measurement, Statistical Modeling, Complexity measures, Performance measures, Object
oriented systems, Process metrics, Product metrics, Software science.
1 INTRODUCTION
In industry, estimates of software field quality are often available too late in the software lifecycle to guide affordable corrective action to the quality of the software. Field quality cannot be measured before a product has been completed and delivered to an internal or external customer. Because this information is available late in the software lifecycle, corrective actions tend to be expensive (Boehm 1981). Software developers can benefit from an early warning regarding the quality of their product.
1 Nachiappan Nagappan is with the Testing, Verification and Measurement Group, Microsoft Research, Redmond
WA 98052. Email: [email protected]
2 Laurie Williams is with the Department of Computer Science, North Carolina State University, Raleigh NC 27695.
Email: [email protected]
3 Mladen Vouk is with the Department of Computer Science, North Carolina State University, Raleigh NC 27695.
Email: [email protected]
4 Jason Osborne is with the Department of Statistics, North Carolina State University, Raleigh NC 27695. Email:
In our research, we formulate this early warning from a collection of static automated unit test metrics that are correlated with Trouble Reports (TRs) per thousand lines of code (KLOC), an external measure of quality obtained from users. A TR (Mohagheghi 2004) is a customer-reported problem whereby the software system does not behave as the customer expects. An internal metric, such as cylomatic complexity (McCabe 1976), is a measure derived from the product itself (ISO/IEC 1996). An external measure is a measure of a product derived from the external assessment of the behavior of the system (ISO/IEC 1996). For example, the number of failures found in test is an external measure.
The ISO/IEC standard (ISO/IEC 1996) states that an internal metric is of little value unless there is evidence that it is related to an externally-visible attribute. Internal metrics have been shown to be useful as early indicators of externally-visible product quality (IEEE 1990) when they are related in a statistically significant and stable way to the field quality/reliability of the product. The validation of internal metrics requires a convincing demonstration that (1) the metric measures what it purports to measure and (2) the metric is associated with an important external metric, such as field reliability, maintainability, or fault-proneness (El Emam 2000).
Our research objective is to construct and validate a set of easy-to-measure, in-process, internal, static unit test metrics that can be used as an early indication of the external measure post-release field quality. To this end, we have created a metric suite we call the Software Testing and Reliability Early Warning for Java (STREW-J) metric suite (Nagappan 2005a). As will be discussed, the metric suite is applicable for software products implemented in Java for which an extensive suite of automated unit test cases are incrementally created as development proceeds. Metrics about these automated unit tests are used to predict post-release field quality and to provide an indication of whether the composition of the unit test cases is adequate to yield a high quality product based upon past results. The STREW-J metrics are used to build a regression model to estimate the post-release field quality in terms of the metric TRs/KLOC.
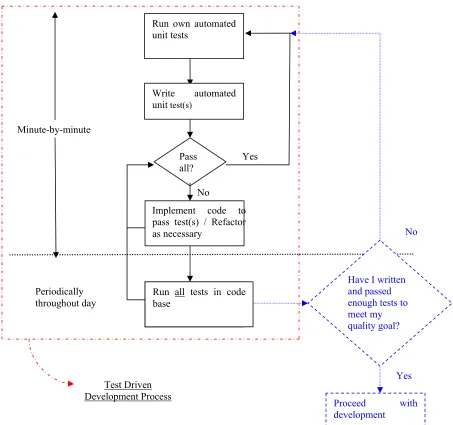
Figure 1 illustrates how the STREW-J metric suite fits into the tight iterative feedback loop of teams that employ automated testing processes, such as is done with the test-driven development (TDD) (Beck 2003) practice. Via TDD, the incremental creation of the unit tests and the constant re-running of unit tests provides developers with confidence in their implementation; the integration of STREW-J feedback provides guidance on the eternal question, “Have I tested enough?”
Teams develop a history of the value of the STREW-J metrics from comparable projects with acceptable levels of field quality. These historical metric values are then used to estimate the relationship between the STREW-J metric elements and the TRs/KLOC. This early estimate helps to identify areas that require more testing, based on the estimates of post-release field quality.
Pass all?
Implement code to pass test(s) / Refactor as necessary
Run all tests in code base
Yes
No Minute-by-minute
Periodically throughout day
No
Proceed with development
Yes
Run own automated unit tests
Write automated unit test(s)
Have I written and passed enough tests to meet my quality goal?
Test Driven Development Process
Figure 1: STREW-J metric suite process model
2 RELATED WORK
consists of six metrics: weighted methods per class (WMC), coupling between objects (CBO), depth of inheritance tree (DIT), number of children (NOC), response for a class (RFC) and lack of cohesion among methods (LCOM). These metrics have been shown to be useful early internal indicators of externally-visible product quality in terms of fault-proneness (Basili, Briand et al. 1996; Subramanyam and Krishnan 2003).
Basili et al. (Basili, Briand et al. 1996) studied the fault-proneness in software programs using eight student projects. They observed that the WMC, CBO, DIT, NOC and RFC were correlated with defects while the LCOM was not correlated with defects. Further, Briand et al. (Briand, Wust et al. 1998) performed an industrial case study and observed the CBO, RFC, and LCOM to be associated with the fault-proneness of a class. A similar study done by Briand et al. (Briand, Wuest et al. 2000) on eight student projects showed that classes with a higher WMC, CBO, DIT and RFC were more fault-prone while classes with a higher NOC were less fault-prone. Tang et al. (Tang 1999) studied three real time systems for testing and maintenance defects. Higher WMC and RFC were found to be associated with fault-proneness. El Emam et al. (El Emam, Benlarbi et al. 1999) studied the effect of class size on fault-proneness by using a large telecommunications application. Class size was found to confound the effect of all the metrics on fault-proneness. Finally, Chidamber et al. (Chidamber, Darcy et al. 1998) analyzed project productivity, rework, and design effort of three financial services applications. High CBO and low LCOM were associated with lower productivity, greater rework, and greater design effort.
Vouk and Tai (Vouk 1993) showed that in-process metrics have strong correlation with field quality of industrial software products. They demonstrated the use of software metric estimators, such as the number of failures, failure intensity (indicated by failures per test case), and drivers such as change level measured by lines of code, component usage, and effort to:
1. quantify component quality in terms of the number of failures expected during initial operational deployment;
2. identify fault-prone and failure-prone components; and
3. guide the software testing process to minimize the number of failures/faults that can be expected in future phases.
To summarize, there is a growing body of empirical evidence that supports the theoretical validity of the use of these internal metrics as predictors of fault-proneness. The consistency of these findings varies with the programming language (Subramanyam and Krishnan 2003). Therefore, the metrics are still open to debate (Churcher and Shepperd 1995). The STREW-J will be used to predict the external measure of field quality.
3 STREW-J METRIC SUITE
The STREW-J metric suite consists of internal, in-process unit test metrics that are leveraged to estimate post-release field quality with an associated confidence interval. Section 3.1 discusses the applicability of the STREW-J metric suite, and Section 3.2 the STREW-J metric suite elements.
3.1 Applicability
one of the object-oriented (O-O) xUnit5 testing frameworks, such as JUnit6. The STREW-J method is not applicable
for script-based automated testing because, as will be discussed, the metrics are primarily based upon the O-O programming paradigm. When these xUnit frameworks are used with O-O programming, both test code and implementation code hierarchies emerge.
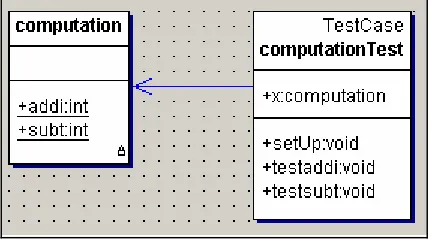
Figure 2 presents a simplistic example of a parallel structure between a source and test class. For each implementation source code class (e.g. computation), there exists a corresponding test code class (e.g. computationTest). Often each method/function in an implementation source code class (e.g. addi) will have one or more corresponding test code method(s)/functions(s) (e.g. testaddi). In industrial practice, often such perfect parallel class structure and one-to-one method/function correspondence is not observed; our example is overly simplistic for illustrative purposes. However, a test hierarchy which ultimately inherits from the TestCase class (in JUnit) is created to exercise the implementation code.
Figure 2: Corresponding source and test classes
Table 1 provides sample Java code for a computation class which adds and subtracts two integers. Notice the assertEquals keyword in the testaddi and testsubt methods. xUnit testing is assert-based. The number of asserts (Rosenblum 1995) and other metrics specific to xUnit-like test automation are used in the STREW-J metric suite.
Table 1: Corresponding source and test code
public class computation {
public static int addi(int temp1,int temp2) { int temp3
temp3 = temp1 + temp2; return(temp3);
}
public static int subt(int temp1,int temp2) { int temp3
temp3 = temp1 - temp2; return(temp3);
} }
public class computationTest extends TestCase {
public computation x; public void setUp() {
x=new computation(); }
public void testaddi() {
assertEquals(100,x.addi(75,25)); }
public void testsubt() {
assertEquals(40,x.subt(50,10)); }
}
3.2 STREW-J Metric Suite Elements
The STREW-J Version 2.0 metric suite consists of nine constituent metric ratios. The metrics are intended to cross-check each other and to triangulate upon an estimate of post-release field quality. Each metric makes an individual contribution toward estimation of the post-release field quality but work best when used together. Development teams record the values of these nine metrics and the actual TRs/KLOC of projects. The historical values from prior projects are used to build a regression model that is used to estimate the TRs/KLOC of the current project under development.
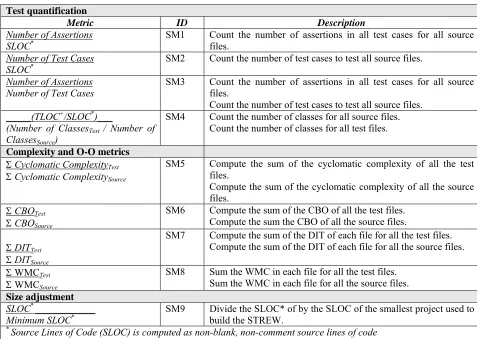
Table 2: STREW-J metrics and collection and computation instructions
Test quantification
Metric ID Description
Number of Assertions
SLOC* SM1 Count the number of assertions in all test cases for all source files.
Number of Test Cases
SLOC* SM2 Count the number of test cases to test all source files.
Number of Assertions Number of Test Cases
SM3 Count the number of assertions in all test cases for all source files.
Count the number of test cases to test all source files.
_____(TLOC+/SLOC*)___
(Number of ClassesTest / Number of
ClassesSource)
SM4 Count the number of classes for all source files. Count the number of classes for all test files.
Complexity and O-O metrics ΣCyclomatic ComplexityTest
ΣCyclomatic ComplexitySource
SM5 Compute the sum of the cyclomatic complexity of all the test files.
Compute the sum of the cyclomatic complexity of all the source files.
ΣCBOTest
ΣCBOSource
SM6 Compute the sum of the CBO of all the test files. Compute the sum the CBO of all the source files.
ΣDITTest
ΣDITSource
SM7 Compute the sum of the DIT of each file for all the test files. Compute the sum of the DIT of each file for all the source files.
Σ WMCTest
Σ WMCSource
SM8 Sum the WMC in each file for all the test files. Sum the WMC in each file for all the source files.
Size adjustment
SLOC* ____________
Minimum SLOC* SM9 Divide the SLOC* of by the SLOC of the smallest project used to build the STREW.
* Source Lines of Code (SLOC) is computed as non-blank, non-comment source lines of code
+ Test Lines of Code (TLOC) is computed as non-blank, non-comment test lines of code
The test quantification metrics (SM1, SM2, SM3, and SM4) are specifically intended to crosscheck each other
to account for coding/testing styles. For example, one developer might write fewer test cases, each with multiple asserts checking various conditions. Another developer might test the same conditions by writing many more test cases, each with only one assert. We intend for our metric suite to provide useful guidance to each of these developers without prescribing the style of writing the test cases. Assertions are used in two of the metrics as a means for demonstrating that the program is behaving as expected and as an indication of how thoroughly the source classes have been tested on a per class level. SM4 serves as a control measure to counter the confounding effect of class size, as shown by El-Emam (El Emam, Benlarbi et al. 1999), on the prediction efficiency.
The complexity and O-O metrics (SM5, SM6, SM7, and SM8) examine the relative ratio of test to source code
for control flow complexity and for a subset of the CK metrics. The dual hierarchy of the test and source code allows us to collect and relate these metrics for both test and source code. These relative ratios for a product under development can be compared with the historical values from prior comparable projects to indicate the relative complexity of the testing effort with respect to the source code. The metrics are now discussed more fully:
program. Prior studies have found a strong correlation between the cyclomatic complexity measure and the number of test defects (Troster 1992). Studies have also shown that code complexity correlates strongly with program size measured by lines of code (Kan 2003) and is an indication of the extent to which control flow is used. The use of conditional statements increases the amount of testing required because there are more logic and data flow paths to be verified (Khoshgoftaar and Munson 1990).
• The larger the inter-object coupling (CBO), the higher the sensitivity to change (Chidamber 1994). Therefore, maintenance of the code is more difficult (Chidamber 1994). Prior studies have shown coupling to be related tofault-proneness (Basili, Briand et al. 1996; Briand, Wust et al. 1998; Briand, Wuest et al. 2000). As a result, the higher the inter-object class coupling, the more rigorous the testing should be (Chidamber 1994).
• A higher depth of inheritance (DIT) indicates desirable reuse but adds to the complexity of the code because a change or a failure in a super class propagates down the inheritance tree. DIT and fault-proneness were shown to be strongly correlated (Basili, Briand et al. 1996; Briand, Wuest et al. 2000).
• The number of methods and the complexity of methods is a predictor of how much time and effort is required to develop and maintain the class (Chidamber 1994). The larger the number of methods in a class, the greater is the potential impact on children, since the children will inherit all the methods defined in the class.The ratio of the WMCtest and WMCsource measures the relative ratio of the number of test methods to
source methods. This measure serves to compare the testing effort on a method basis. The relationship between the WMC as an indicator of fault-proneness has been demonstrated in prior studies (Basili, Briand et al. 1996; Briand, Wust et al. 1998).
The final metric is a relative size adjustment factor (RSAF). Defect density has been shown to increase with
class size (El Emam, Benlarbi et al. 1999). We account for project size in terms of SLOC for the projects used to build the STREW-J prediction equation using RSAF.
The metrics that comprise the STREW-J metric suite have evolved (Nagappan, Williams et al. 2003; Nagappan 2004) through our case studies. Some metrics were removed based on the lack of their ability to contribute to the estimation of post-release field quality and due to pre-existing inter-correlations between the elements. These metrics were removed based upon statistical inter-correlations, multicollinearity, stepwise, backward, and forward regression techniques (Kleinbaum 1987) of case study data. The following metrics were removed:
• Number of requirements/Source lines of code
• Number of childrentest/Number of childrensource
• Lack of cohesion among methodstest/Lack of cohesion among methodssource
4 STREW-J MODEL BUILDING AND VALIDATION
For this reason, we cannot assume a priori that the results of a study generalize beyond the specific environment in which it was conducted (Basili, Shull et al. 1999). Researchers become more confident in a theory when similar findings emerge in different contexts (Basili, Shull et al. 1999). By performing multiple case studies and/or experiments and recording the context variables of each case study, researchers can build up knowledge through a family of experiments (Basili, Shull et al. 1999) which examine the efficacy of a new practice. Replication of experiments addresses threats to experimental validity. We address these issues related to empirical studies by replicating multiple case studies through a family of experiments in three different contexts: academic, open source and industrial. Similar results in these contexts indicate the promise of this approach at statistically significant levels.
4.1 Model Building
This section describes the model building strategies that were used for predicting post-release field quality. A number of techniques have been used for the analysis of software quality. Multiple linear regression (MLR) analysis (Khoshgoftaar 1993) has been used to model the relationship between quality and software metrics. The general regression equation is of the form:
Y = c + a1X1+a2X2+…..+anXn, (1) where Y is the dependent variable, a1, a2 …., an are regression coefficients and X1, X2 …., Xn are the
known independent variables.
In our work, the dependent variable to be estimated is the post-release field quality and the independent variables are the STREW-J metrics.
A difficulty associated with MLR is multicollinearity among the metrics that can lead to inflated variance in the estimation of reliability. One approach that has been used to overcome this difficulty is Principal Component Analysis (PCA) (Jackson 2003). With PCA, a smaller number of uncorrelated linear combinations of metrics that account for as much sample variance as possible are selected for use in regression (linear or logistic). A logistic regression equation (Denaro 2002b) can be built to model data using the principal components as the independent or predictor variables. Denaro et al. (Denaro 2002b) calculated 38 different software metrics for the open source Apache 1.3 and 2.0 projects. Using PCA, they selected a subset of nine of these metrics that explained 95% of the total sample variance.
regression analysis is performed on the principal components produced. The generalized regression equation and associated confidence are formulated as follows:
Ynew = c + a1PC1+a2PC2+…..+anPCn, (2)
where a1, a2 …., an are regression coefficients and PC1, PC2 …., PCn are the produced principal
components.
The estimated value of post-release field quality (Ynew) is calculated with an associated confidence bound (Kleinbaum 1987) given by Equation 3 where n is the number of observations, t (α/2, n) is the standard t-table value withn degrees of freedom at a significance level of α = 0.05.
Confidence bounds = Ynew + t (α/2, n) * Mean Standard Error (3) Further, the model building strategies have the following associated factors:
• The coefficient of determination, R2, is the ratio of the regression sum of squares to the total sum of
squares. As a ratio, it takes values between 0 and 1, with larger values indicating more variability explained by the model and less unexplained variation.
• The F-ratio is to test the null hypothesis that all regression coefficients are zero at statistically significant levels.
• Where parametric testing is appropriate, a significance level of α = 0.05 was adopted for statistical inference. For example, all interval estimates are reported using confidence level 95% (α = 0.05).
4.2 Results Evaluation Techniques
The evaluation of the TRs/KLOC estimates with the actual values is performed using two methods explained below:
• Average Absolute Error (AAE) and Average Relative Error (ARE). AAE and ARE are used to measure the
accuracy of prediction of the estimated TRs/KLOC with numerical quantification (i.e. numerical accuracy) (Khoshgoftaar 2003). The smaller the values of AAE and ARE, the better are the predictions. The equations for AAE and ARE are provided as Equations 4 and 5 where n is the number of observations.
AAE =
∑
=
n
1 i
n
1
| Estimated Value – Actual Value | (4)
ARE =
∑
=
n
1 i
n
1
(| Estimated Value – Actual Value |) / Actual Value (5)
• Correlation between the actual and estimated TRs/KLOC. This correlation is used to quantify the
A positive correlation between the actual and estimated TRs/KLOC would indicate that with an increase in estimated TRs/KLOC, there is an increase in actual TRs/KLOC. A negative correlation would indicate that with an
increase in estimated TRs/KLOC, there is a decrease in actual TRs/KLOC (or vice versa).
4.3 Case Studies
This section describes the three-phase empirical case study approach used to build the STREW-J model and to validate the effectiveness of the model. The three phases include case studies of 22 academic projects, 27 open source projects, and five industrial projects. For our case studies, the TRs were screened to remove duplicates and reports due to documentation problems. The data used for the academic and open source projects are publicly available in (Nagappan 2005a).
4.3.1 Feasibility study: Academic projects
This subsection describes a controlled feasibility study performed with junior/senior-level students at North Carolina State University (NCSU) to investigate the efficacy of the STREW-J metric suite elements to estimate post-release field quality.
4.3.1.1 Description
The students worked on a project that involved development of an Eclipse7 plug-in to collect software metrics.
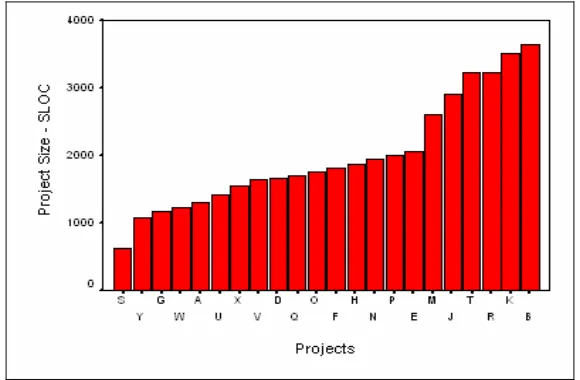
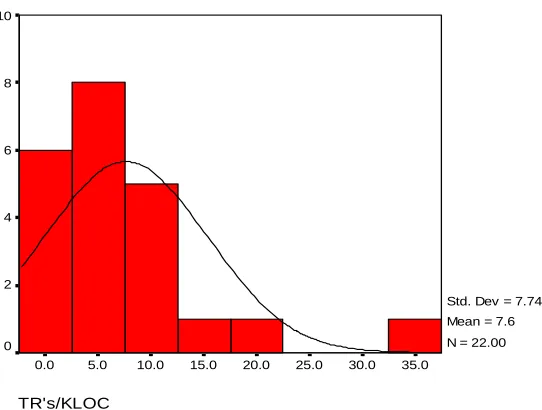
The project was six weeks in duration and used Java as the programming language. The JUnit testing framework was used for unit testing; students were required to have 80% statement coverage. A total of 22 projects were submitted, and each group had four to five students. Figure 3 shows the size (LOCsource) in lines of code (LOC) of
the projects that were developed. The projects were between 617 LOCsource and 3,631 LOCsource. On average, the
ratio of LOCtest to LOCsource was 0.35. Each project was evaluated by 45 independent test cases. Post-release field
quality was estimated by instructor-run black box test case failures per KLOC because the student projects were not released to customers. If a 2 KLOC project had ten failures (out of the 45 tests) the TRs/KLOC = (10/2) = 5 failures/KLOC.
Figure 3: Academic projects size
4.3.1.2 Limitations
The academic study is a closed structured environment that might represent ideal conditions but may not reflect industrial settings. As a result, an external validity issue arises because the programs were written by students, and the projects are small relative to industry applications. This concern is mitigated to some degree because the students were advanced undergraduates (junior/senior). Another threat to validity is that using the same set of 45 test cases to evaluate post-release field quality may also have skewed the failures/KLOC to a certain degree. It is possible that under exhaustive usage by customers a project with higher ‘test’ failures/KLOC would actually have fewer customer-realized failures.
4.3.1.3 Model building
The regression model was built using the principal components obtained from the STREW-J metrics as the independent variables and the post-release field quality as the dependent variable for all 22 projects. The built model had an R2 value = 0.512 and was statistically significant (F=6.284, p=0.004).
4.3.1.4 Random data splitting
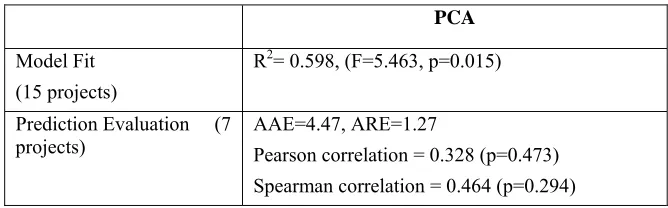
To evaluate the efficacy of the STREW-J metric suite to predict TRs/KLOC, we use a random data splitting approach. We randomly selected two-thirds (N=15) of the samples to build a prediction model and the remaining one-third (N=7) to evaluate the built model. We obtained the results shown in Table 3.
Table 3: Prediction evaluation results
PCA
Model Fit (15 projects)
R2= 0.598, (F=5.463, p=0.015)
Prediction Evaluation (7
projects) AAE=4.47, ARE=1.27 Pearson correlation = 0.328 (p=0.473)
Spearman correlation = 0.464 (p=0.294)
TR's/KLOC
35.0 30.0 25.0 20.0 15.0 10.0 5.0 0.0 10
8
6
4
2
0
Std. Dev = 7.74 Mean = 7.6 N = 22.00
Figure 4: Histogram of TRs/KLOC in academic projects
4.3.2 Open source case studies
Open source projects are convenient to perform post-release field quality analysis because source code, test code, and defect logs are openly available for use. Additionally, these projects are more representative of industrial projects than academic projects due to their size and scope. We selected 27 open source projects to apply the STREW-J metric suite.
4.3.2.1 Description
Twenty-seven open source projects that were developed in Java were selected from Sourceforge (http://sourceforge.net). The following criterion was used to select the projects from Sourceforge.
• software development tools. All of the chosen projects are software development tools, i.e. tools that are used to build and test software and to detect defects in software systems to select programs from a common domain.
• download ranking of 85% or higher. In Sourceforge, the projects are all ranked based on the number of times they have been downloaded on a percentile scale from 0-100%. For example, a ranking of 85% means that a product is in the top 15% in terms of download quantity. We chose this criterion because we reasoned that a comparative group of projects with similarly high download rates would be more likely to have a similar usage frequency by customers that would ultimately reflect the post-release field quality.
• automated unit testing. The projects needed to have JUnit automated tests.
• defect logs available. The defect log needed to be available for identifying TRs with the date of the TR reported.
• Sourceforge development stage of 4 or higher. This denotes the development stage of the project (1-6) where 1 is a planning stage and 6 is a mature phase. We chose a cut-off of 4 which indicates the project is at least a successful beta release. This criterion indicates that the projects are at a similar stage of development and are not projects too early in the development lifecycle.
Figure 5 shows the names of the projects and their sizes in LOCsource. On average, the ratio of LOCtest to LOCsource
was 0.37. The projects range from around 2.5 KLOCsource to 80 KLOCsource. The TRs are normally distributed with a
range from 0.20 to 6.9 TRs/KLOC (Mean = 1.42). The defect logs were screened, and duplicate TRs were removed to obtain an accurate measure of the TRs/KLOC.
Figure 5: Open source project sizes
4.3.2.2 Limitations
There is a validity issue with respect to the actual usage of open source software systems. The commonly-available usage metric for open source software is the download activity ratio. For example, it might be possible that both Project 1 and Project 2 could have both been downloaded by 100 users, but Project 1 might have been actually used by only ten users while Project 2 by 90 users. Actual usage is not directly observable from the sourceforge.com. Also, we are dependent on customer reports for measuring the TRs/KLOC. However, some customers might not report the TRs in the open source environment.
cases), comparable TRs/KLOC across all the projects, and all the projects belonging to one particular domain of software systems.
4.3.2.3 Model building
Multiple regression was performed using the principal components of the STREW-J metrics for the 27 open source projects as the independent variable and the post-release field quality as the dependent variable. Similar to the academic case studies, the model was statistically significant (R2=0.428, F=8.993, p=0.004) in its ability to
explain the variance in the dependent variable.
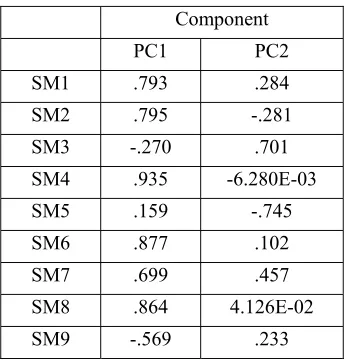
The Kaiser-Meyer-Olkin (KMO) measure of sampling adequacy is 0.764 indicating the applicability of using PCA in model building. The PCA of the nine STREW-J metrics yields two principal components (with eigen values greater than 1). The linear transformation coefficient for the two principle components is given by the component matrix8 in Table 4.
Table 4: Component matrix for PCA transformation
Component PC1 PC2
SM1 .793 .284
SM2 .795 -.281
SM3 -.270 .701
SM4 .935 -6.280E-03 SM5 .159 -.745
SM6 .877 .102
SM7 .699 .457
SM8 .864 4.126E-02
SM9 -.569 .233
Using MLR on the two principal components calculated using Table 4, we obtain Equation 5.
Post-release field quality = 1.424 + 0.852 * PC1 - 0.132*PC2 (5)
where PC1 and PC2 are the transformed principal components produced from the nine STREW-J metrics.
4.3.2.4 Random data splitting
For the random data-splitting, we use two thirds of the projects (N=18) to build the prediction model and the remaining one-third (N=9) to evaluate the fit of the prediction model. We repeated the random split nine times to verify data consistency, i.e. to check if the results of our analysis were not a one-time occurrence. Figure 6 shows the model building and model evaluation performed using PCA. The results for each data split present the R2 and F
test results for each model and the prediction results evaluated using AAE, ARE and correlation analysis. The graphs indicate the actual and the estimated post-release field quality along with the regression predicted upper confidence level (ucl) and lower confidence level (lcl) (Kleinbaum 1987).
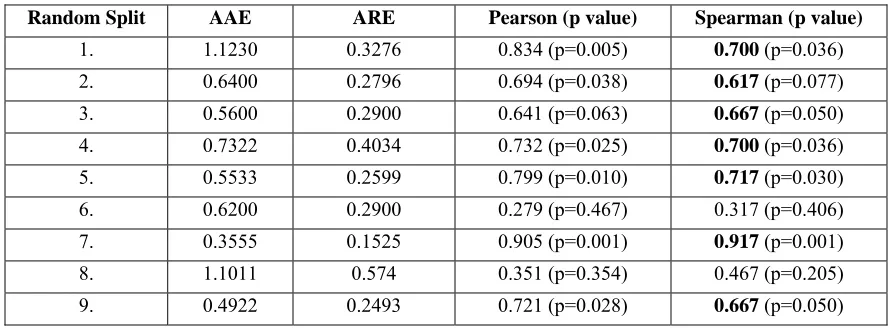
To summarize, we present the results of our evaluation using the models built using PCA in Table 5. We can assess the efficacy of the prediction model built using 18 randomly-chosen projects. The ARE values that reflect the relative error in terms of the absolute magnitude of the TRs/KLOC. The overall standard deviation of the TRs/KLOC is 1.318 TRs/KLOC.
Table 5: AAE and ARE for PCA models
Random Split AAE ARE Pearson (p value) Spearman (p value)
1. 1.1230 0.3276 0.834 (p=0.005) 0.700 (p=0.036)
2. 0.6400 0.2796 0.694 (p=0.038) 0.617 (p=0.077)
3. 0.5600 0.2900 0.641 (p=0.063) 0.667 (p=0.050)
4. 0.7322 0.4034 0.732 (p=0.025) 0.700 (p=0.036)
5. 0.5533 0.2599 0.799 (p=0.010) 0.717 (p=0.030)
6. 0.6200 0.2900 0.279 (p=0.467) 0.317 (p=0.406) 7. 0.3555 0.1525 0.905 (p=0.001) 0.917 (p=0.001)
8. 1.1011 0.574 0.351 (p=0.354) 0.467 (p=0.205)
PCA – Random split 1 PCA – Random split 2
R2= 0.373 (F=4.467, (p=0.030)) R2= 0.442 (F=5.938, p=0.013)
Projects 9 8 7 6 5 4 3 2 1 TR 's /K L O C 8 6 4 2 0 actual estimated lcl ucl Projects 9 8 7 6 5 4 3 2 1 TR 's /K L O C 5 4 3 2 1 0 actual estimated lcl ucl
AAE = 1.1230, ARE = 0.3276 Pearson correlation = 0.834 (p=0.005) Spearman correlation = 0.700 (p=0.036)
AAE = 0.6400, ARE = 0.2796 Pearson correlation = 0.694 (p=0.038) Spearman correlation = 0.617 (p=0.077)
PCA – Random split 3 PCA – Random split 4
R2= 0.450, (F=6.136, p=0.011) R2= 0.450, (F=6.138, p=0.011)
Projects 9 8 7 6 5 4 3 2 1 TR 's /K L O C 4 3 2 1 0 actual estimated lcl ucl Projects 9 8 7 6 5 4 3 2 1 TR 's /K L O C 5 4 3 2 1 0 actual estimated lcl ucl
AAE = 0.5600, ARE = 0.2900 Pearson correlation = 0.641 (p=0.063) Spearman correlation = 0.667 (p=0.050)
PCA – Random split 5 PCA – Random split 6
R2= 0.446, (F=6.038, p=0.012) R2= 0.491, (F=7.229, p=0.006)
Projects 9 8 7 6 5 4 3 2 1 TR 's /K L O C 5 4 3 2 1 0 actual estimated lcl ucl Projects 9 8 7 6 5 4 3 2 1 TR 's /K L O C 4 3 2 1 0 actual estimated lcl ucl
AAE = 0.5533, ARE = 0.2599 Pearson correlation = 0.799 (p=0.010) Spearman correlation = 0.717 (p=0.030)
AAE = 0.6200, ARE = 0.2900 Pearson correlation = 0.279 (p=0.467) Spearman correlation = 0.317 (p=0.406)
PCA – Random split 7 PCA – Random split 8
R2= 0.367, (F=4.355, p=0.032) R2= 0.642, (F=13.463, p<0.0005)
Projects 9 8 7 6 5 4 3 2 1 TR 's /K L O C 4 3 2 1 0 actual estimated lcl ucl Projects 9 8 7 6 5 4 3 2 1 TR 's /K L O C 5 4 3 2 1 0 actual estimated lcl ucl
AAE = 0.3555, ARE = 0.1525 Pearson correlation = 0.905 (p=0.001) Spearman correlation = 0.917 (p=0.001)
PCA – Random split 9
R2= 0.435, (F=5.765, p=0.014)
Projects
9 8 7 6 5 4 3 2 1
TR
's
/K
L
O
C
5
4
3
2
1
0
actual
estimated
lcl
ucl
AAE = 0.4922, ARE = 0.2493
Pearson correlation = 0.721 (p=0.028) Spearman correlation = 0.667 (p=0.050)
Figure 6: Random data split – model building and evaluation results
The AAE in all the nine random cases (using PCA after eliminating multicollinearity) is smaller than the standard deviation, indicating that the efficacy of the prediction results.
Table 5 indicates the correlation coefficient (Pearson and Spearman) results between the actual and estimated post-release TRs/KLOC. The correlation measure serves to indicate the sensitivity between the actual and predicted post-release TRs/KLOC. Of nine random samples in the PCA, seven are statistically significant (between the estimated and actual post-release quality), indicating the efficacy of our approach for the open source projects case study (shown in bold in Table 5).
4.3.3 Industrial case study
In this section we describe the industrial case study that was performed with a multinational, travel services company to investigate the efficacy of the STREW-J metric suite to assess post-release field quality for three commercial software systems.
4.3.3.1 Description
Table 6: Industrial project sizes
Project Size
Project 1A 190 KLOC Project 1B 193 KLOC Project 2A 504 KLOC Project 2B 487 KLOC Project 3 13 KLOC
The development language used was Java, and the JUnit testing framework was used for unit and acceptance testing. Table 7 represents the descriptive project characteristics of our industrial case studies.
Table 7: Project characteristics
Factor Team value
Team size Ranged from 6 to 16 developers.
Team education level 62% had a bachelors degree and 34% had a masters degree or higher.
Experience level of team 57% have more than five years of experience in the industry Domain expertise Medium-High.
Language expertise Medium-High.
4.3.3.2 Limitations
Project 3 was of much smaller size compared to the other projects. Also Project 3 was a new release of a system. But all the three projects belonged to the same domain in terms of functional usage thereby having comparable TR/KLOC values.
4.3.3.3 Post-release field quality prediction
Figure 7: Prediction plots with PCA
Figure 7 indicates the predicted values of the actual TRs/KLOC and bounds for Projects 1A/B, 2A/B and C. The actual normalized TRs/KLOC values are close to the zero for all the projects. The critical nature of the project drives the development organization to focus on practices which yield high quality products. The lower confidence bounds (LCL) are all negative (although it is impossible to actually have a negative TR/KLOC) because the regression equation yields point estimates which appropriately predict a near-perfect project. Project 3 exhibits a variant behavior than the others. Project 3 may not be a comparable project because it is smaller than the other projects and was to form the core components of the organization’s future software products. Therefore, Project 3 was particularly well tested, considerably more than the other software systems used to build or evaluate the prediction. On closer observation of the nine STREW-J metric values for Project 3, we notice that metrics SM1, SM2 for Project 3 at least one order greater than all the projects (open source included). Metrics SM5, SM6, SM7, and SM8 for Project 3 are at least twice of SM5, SM6, SM7 and SM8 of all the other projects. SM5-SM8 indicate that Project 3 had a high testing effort (and complexity) compared to all the other projects. These differences prevent the open source model from being as accurate a predictor for Project 3.
the actual and estimated TRs/KLOC. The Pearson correlation coefficient = 0.962 (p = 0.009) and Spearman correlation coefficient = 0.500 (p = 0.391). This indicates the efficacy of the sensitivity of prediction between the actual and estimated TRs/KLOC, but is limited to a certain degree by the small sample size of the available projects.
5 CONCLUSIONS AND FUTURE WORK
An early estimation of potential software field quality can be useful to developers in predicting the overall quality of the software system. However, in most production environments, field quality is measured too late to affordably guide significant corrective actions. In this paper, we present the use of an in-process suite of static test metrics for providing an early warning regarding post-release field quality based on the thoroughness of a testing effort.
The STREW-J metric suite is intended to be easy to gather in the development environment so that developers can receive an early indication of system TRs/KLOC throughout development. Our results indicate that the STREW-J metric suite can be used to leverage the testing effort to estimate the post-release field quality of the software. The STREW-J metric suite is a set of static unit test measures that can be used to estimate the dynamic measure of post-release field quality. Three case studies in the academic, open source, and industrial environments yielded empirical evidence of the ability of the STREW-J metric suite to predict post-release field quality. The associations between appropriately-chosen functions of the metrics, (by using PCA) and the field quality measures were statistically significant.
The data used to build our models was obtained from a relatively small set of data points and contexts. We will continue as was done with the COCOMO II cost estimation model (Boehm, Abts et al. 2000) by Barry Boehm at USC. Over a period of 19 years, Boehm has collected 161 data points (Boehm, Abts et al. 2000) from commercial, aerospace, government, and nonprofit organizations. We will build a more general, robust STREW-based post-release field quality estimation model by obtaining data from many industrial organizations, in multiple domains, with varying degrees of quality. Similar to the progression of the COCOMO model, we plan to make our model robust to handle projects with a wide spectrum of post-release field quality.
We will continue to validate the metric suite in industrial and academic environments and to refine the metric suite according to specific industry characteristics with emphasis on smaller granularity of measurement, i.e. instead on a project basis, measure the STREW-J metrics on a function/class basis to provide more individual feedback to developers. We will continue to refine the metric suite by adding/deleting new metrics based on the results of further studies. An important step towards generalizing STREW-J would involve modifying STREW-J metrics for non–OO languages, such as C, that form a large part of the legacy code base. We plan to use non-automated test results with STREW-J to further enhance the measurement of the testing effort.
Acknowledgements
References
Basili, V. R., L. C. Briand, et al. (1996). "A Validation of Object Orient Design Metrics as Quality Indicators." IEEE Transactions on Software Engineering. 22(10): 751-761.
Basili, V. R., F. Shull, et al. (1999). "Building Knowledge Through Families of Experiments." IEEE Transactions on Software Engineering. 25(4): 456 - 473.
Beck, K. (2003). Test Driven Development -- by Example. Boston, Addison Wesley.
Boehm, B. W. (1981). Software Engineering Economics. Englewood Cliffs, NJ, Prentice-Hall, Inc.
Boehm, B. W., C. Abts, et al. (2000). Software Cost Estimation with COCOMO II. Upper Saddle River, NJ, Prentice Hall.
Brace, N., Kemp, R., Snelgar, R. (2003). SPSS for psychologists, Palgrave Macmillan.
Briand, L., J. Wuest, et al. (2000). "Exploring the Relationship between design measures and software quality in Object-Oriented Systems." Journal of Systems and Software. 51(3): 245-273.
Briand, L. C., J. Wust, et al. (1998). Investigating Quality Factors in Object-Oriented Designs: An Industrial Case Study. International Conference on Software Engineering, 345-354.
Chidamber, S. R., D. P. Darcy, et al. (1998). "Managerial Use of Object-Oriented Software: An Explanatory Analysis." IEEE Transactions on Software Engineering. 24(8): 629-639.
Chidamber, S. R., Kemerer, C.F. (1994). "A Metrics Suite for Object Oriented Design." IEEE Transactions on Software Engineering. 20(6): 476-493.
Churcher, N. I. and M. J. Shepperd (1995). "Comments on 'A Metrics Suite for Object-Oriented Design'." IEEE Transactions on Software Engineering. 21(3): 263-5.
Denaro, G., Morasca, S., Pezze., M (2002a). Deriving models of software fault-proneness. International Conference on Software Engineering Knowledge Engineering, 361-368.
Denaro, G., Pezze., M (2002b). An empirical evaluation of fault-proneness models. International Conference on Software Engineering, 241-251.
El Emam, K., S. Benlarbi, et al. (1999). "The Confounding Effect of Class Size on the Validity of Object-Oriented Metrics." IEEE Transactions on Software Engineering. 27(7): 630-650.
Fenton, N. E. and S. L. Pfleeger (1998). Software Metrics: A Rigorous and Practical Approach, Brooks/Cole.
IEEE (1990). IEEE Standard 610.12-1990, IEEE Standard Glossary of Software Engineering Terminology.
ISO/IEC (1996). "DIS 14598-1 Information Technology - Software Product Evaluation."
Jackson, E. J. (2003). A Users Guide to Principal Components. Hoboken, NJ, John Wiley & Sons Inc.
Kaiser, H. F. (1974). "An Index of Factorial Simplicity." Psychometrika. 39: 31-36.
Kan, S. (2003). Metrics and Models in Software Quality Engineering, Addison Wesley.
Khoshgoftaar, T. M. and J. C. Munson (1990). "Predicting Software Development Errors using Software Complexity Metrics." IEEE Journal on Selected Areas in Communications. 8(2): 253-261.
Khoshgoftaar, T. M., Munson, J.C., Lanning, D.L. (1993). A comparative study of Predictive Models for Program Changes During System Testing and Maintenance. International Conference on Software Maintenance, 72-79.
Khoshgoftaar, T. M. S., N.; (2003). "Fault Prediction Modeling for Software Quality Estimation: Comparing Commonly Used Techniques." Empirical Software Engineering. 8(3): 255-283.
Kleinbaum, D. G., Kupper, L.L., Muller, K.E. (1987). Applied Regression Analysis and Other Multivariable Methods. Boston, PWS-KENT Publishing Company.
McCabe, T. J. (1976). "A Complexity Measure." IEEE Transactions on Software Engineering. 2(4): 308-320.
Mohagheghi, P., Conradi, R., Killi, O.M., Schwarz, H. (2004). An Empirical Study of Software Reuse vs. Reliability and Stability. International Conference on Software Engineering, 282-292.
Nagappan, N. (2005a). A Software Testing and Reliability Early Warning (STREW) Metric Suite. Computer Science Department. PhD Thesis, Raleigh, North Carolina State University.
Nagappan, N., L. Williams, et al. (2003). Towards a Metric Suite for Early Software Reliability Assessment. International Symposium on Software Reliability Engineering Fast Abstract, Denver, CO,
Nagappan, N., Williams, L., Vouk, M., Osborne, J., (2004). Using In-Process Testing Metrics to Estimate Software Reliability: A Feasibility Study. Fast Abstract: International Symposium on Software Reliability Engineering, 21-22.
Rosenblum, D. S. (1995). "A practical approach to programming with assertions." IEEE Transactions on Software Engineering. 21(1): 19-31.
Subramanyam, R. and M. S. Krishnan (2003). "Empirical Analysis of CK Metrics for Object-Oriented Design Complexity: Implications for Software Defects." IEEE Transactions on Software Engineering. 29(4): 297-310.
Tang, M.-H., Kao, M-H, Chen, M-H. (1999). An Empirical Study on Object-Oriented Metrics. Sixth International Software Metrics Symposium, 242-249.
Troster, J. (1992). Assessing Design-Quality Metrics on Legacy Software. Ontario, Software Engineering Process Group, IBM Canada Ltd. Laboratory.