PRIMER
Examining the Process of
de Novo
Gene Birth:
An Educational Primer on
“
Integration of New
Genes into Cellular Networks, and Their
Structural Maturation
”
Seth Frietze and Judith Leatherman1
School of Biological Sciences, University of Northern Colorado, Greeley, Colorado 80639
SUMMARYNew genes that arise from modification of the noncoding portion of a genome rather than being duplicated from parent genes are calledde novogenes. These genes, identified by their brief evolution and lack of parent genes, provide an opportunity to study the timeframe in which emerging genes integrate into cellular networks, and how the characteristics of these genes change as they mature intobonafidegenes. An article by G. Abrusán provides an opportunity to introduce students to fundamental concepts in evolutionary and comparative genetics and to provide a technical background by which to discuss systems biology approaches when studying the evolutionary process of gene birth. Basic background needed to understand the Abrusán study and details on comparative genomic concepts tailored for a classroom discussion are provided, including discussion questions and a supplemental exercise on navigating a genome database.
Related article inGENETICS:Abrusán, G., 2013 Integration of New Genes into Cellular Networks, and Their Structural Maturation. Genetics 195:1407–1417.
Background
L
IFE as we know it is encoded by the DNA of our genomes. Every cellular being has its own genome specifying the information required for constructing and maintaining its exis-tence (its genotype). Within each genome there are important protein-coding genes. In cells, these proteins are instrumental in biological pathways that affect an organism’s health, appear-ance, and adaptation to changing environments (its pheno-type). During evolutionary time periods, species diverge and acquire new characteristics. Given the constraints of the genetic code, how do new attributes or morphological changes arise in species? New genes to carry out these new functions must be encoded in the DNA, and the DNA must be transcribed into mRNA and translated into protein.The best-documented mechanism whereby new genes arise is through duplication of existing genes, and this is generally the only mechanism mentioned in textbooks. Gene
duplication has occurred over and over during evolutionary history, leaving most species with“families”of related genes arising from multiple duplication events (Demuth and Hahn 2009). When an organism duplicates a gene, one gene copy can continue to perform the original function of that gene product, while the other copy, “relieved” of its normal duties, is now free to accumulate sequence changes that may eventually lead to a gene with a new, or specialized functionality. In addition, gene duplication may result in higher levels of the gene product. A variation that can also lead to big evolutionary changes is “tinkering”with the ex-pression patterns of existing genes. That is, small changes to regulatory sequences near protein-coding genes can change the levels or timing of transcription or change the cell popu-lation in which the gene is expressed—often leading to signif-icant functional or morphological changes in the organism (Flicek 2013).
In the past few years, scientists began to question the dogma that new genes ariseonlyfrom reshuffling and repur-posing an existing set of genes. Since the majority of an organism’s genome is non-protein-coding DNA, it is often thought of as“junk”DNA. Scientists have begun to explore
Copyright © 2014 by the Genetics Society of America doi: 10.1534/genetics.113.160895
whether there is a purpose for these cryptic sequences, and whether they contribute to fundamental biological processes like adaptation or evolution. Several research groups have now demonstrated that an important function of noncoding DNA is a source for new genes to arise“from scratch.”Because these new genes lack parents they are also called orphan genes.
How Do New Genes Emerge from Non-protein-coding DNA Sequences?
For genes that arise from scratch, at some point in history there was a DNA sequence that was not a gene, and then that sequence somehow became a gene. Lest we begin to think in terms of magical transfiguration, it is worthwhile to consider what being a gene entails. First, genes are transcribed into RNA. Until a few years ago, most scientists thought that only genes were transcribed into RNA. In courses, students learn about how meticulously gene tran-scription is regulated, with the implication that each cell transcribes only the genes that are needed at a given time. It turns out that transcription is much messier than anyone expected. New technologies have allowed researchers to de-termine the sequences ofallthe RNAs found in a cell, and it was found that a good portion of the genome is transcribed at one time or another, at least at low levels—even the parts thought not to contain genes (Bertone et al. 2004; Cheng et al. 2005; Gersteinet al.2007). Thus, as new genes arise from nongene regions, transcribing the DNA into RNA is not as big of a hurdle as was once thought.
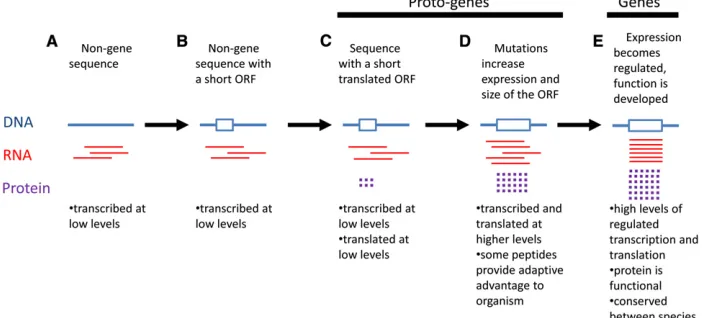
What else does being a gene entail? For protein-coding genes, the RNA must be processed and exported from the nucleus to associate with ribosomes in the cytoplasm for translation. Several recent studies have found that many non-protein-coding RNAs are found associated with ribo-somes, suggesting that some of the background “noise”of superfluous transcription gets translated into rudimentary proteins (Wilson and Masel 2011; Braret al.2012; Carvunis et al. 2012). With the knowledge that lots of extragenic transcription and translation occurs in the average cell, it is not hard to imagine how new protein-coding genes could begin to arise. Carvuniset al.(2012) have suggested a likely course of events whereby new genes arise, and we have summarized these steps in Figure 1. Nongene sequences are routinely transcribed at low levels (Figure 1A). Over time, mutations occur in DNA sequences that create stretches between start and stop codons called open reading frames (ORFs) (Figure 1B). These RNAs begin to be trans-lated at low levels (Figure 1C). Over time, some of these short ORFs may acquire new mutations, resulting in a longer ORF and, eventually, achieve higher levels of transcription and translation (Figure 1D). Carvunis et al. (2012) called
“developing”genes in the C and D groups proto-genes (Fig-ure 1), a term also used in the Abrusán (2013) article.
Another aspect of being a gene is that the gene product has somefunction. Gene function is thought to develop dur-ing the later proto-gene stages (Carvuniset al.2012). The
products of proto-genes may give the organism an adaptive advantage or begin contributing to a cellular process (Figure 1D). By the time a proto-gene becomes abonafidegene, it has developed a function. Genes also have developed robust and regulated transcription and translation, and they are generally conserved between related species (Figure 1E). The reason conservation is observed is because it takes a long time for a gene to develop from scratch, and chances are that during this long period, one or more speciation events takes place, leaving that gene in several closely related species.
How Can We Determine Which Genes Are in the Process of Being Born?
Even though the timescale for the progression of events in Figure 1 is millions of years, it is still possible to experimen-tally study the process of gene birth. At any given time, we can assume that all species have genes at each stage along the gene-birth continuum. To determine which genes are in the process of forming, the age of a gene can be estimated based on conservation with other species. The divergence of species during evolutionary history is a way of counting the passage of time (on a millions of years scale). If a particular gene sequence is found in two different species, it suggests that back before those species diverged from each other, that gene already existed. Once the speciation event occurred, both ended up with that sequence.
Once species have diverged from each other, each will continue to undergo random genetic change, and the shared sequences between them will begin to become more and more different from each other over time. However, impor-tant genes stay conserved (similar) between the species. Conservation suggests that gene is undergoing purifying selection—that is, loss of the gene has detrimental consequences for the organism and, thus, any individual with a severe mutation in that gene would not survive to pass on that genetic change.
Conservation of molecular sequence data (DNA, RNA, and protein) between different species is used by scientists to create depictions of evolutionary relatedness in the form of a tree diagram. A phylogenetic tree (also called a phylogeny) is a diagram that depicts the lines of evolutionary descent of different taxa from a common ancestor. Interpreting this information is not always straightforward and requires some understanding of the elements of a phylogeny and what they represent. There are different ways to depict phylogenies, but we discuss the specific type shown in Abrusán (2013, Figure 1).
scale, are millions of years (for example,Saccharomyces cer-evisiaeandSchizosaccharomyces pombediverged ~760 mil-lion years ago, or MYA). Such estimations are generally determined based on the degree of change between pub-lished DNA sequences from each species and standard mu-tation rates. In the tree shown in Figure 1, existing species are depicted on the right, connected by a series of branch points called nodes. Each node represents a putative com-mon ancestor of the two lineages that descended from that node. Since the tree branches from left to right, the earliest ancestor is on the left, and time increases to the right. For example, ancestor 10 existed prior to ancestors 9 and 8, etc. In the figure, there are nine different common ancestors, which include different fungal lineages based on this rank-ing of branch point nodes. Thus, the 14 different species on the tips of this tree cluster in a rank that is determined by relatedness (or conservation) at the genetic level.
Abrusán investigated the genes of the yeast S. cerevisiae and compared them to the genes in other sequenced ascomy-cete fungi species shown in Abrusán (2013, Figure 1). The classification scheme was similar to that previously used by Carvuniset al. (2012); briefly, ORFs were classified into 10 groups based on their level of conservation. For example, level 1 ORFs are annotated genes that are found only in S. cerevisiae, while level 2 ORFs are also conserved in the closely related S. paradoxus. About 2% of the total ORFs are found only in S. cerevisiae (level 1), whereas 12% are conserved among the four closely relatedSaccharomycesspecies (levels 1–4). Levels 1–4 have been designated proto-genes because of their relatively recent emergence. The remaining ORFs inS. cerevisiae(about 88%) had homologs in more dis-tant species (levels 5–10, shown in Abrusán (2013, Figure 1), and can be confidently consideredbonafidegenes.
A Systems Biology Approach Toward Investigating Gene Birth
Onefinal introductory note: while the Abrusán (2013) arti-cle is indeed hypothesis-driven research, it may seem a bit different from what most people think of as experimental
science. The study presented is completely computer based, using publicly available data sets. The Abrusán (2013) arti-cle uses a systems biology approach—rather than studying one gene at a time, allgenes,all proteins,alltranscription factor binding sites, etc., are considered. These data are frequently called “-omics” data (which includes genome, transcriptome, proteome, interactome), and the technical advances that have enabled the collection of these data have revolutionized the way biology can be studied. The work pre-sented by Abrusán provides an example of how to use-omics data to examine the differences between new and old genes.
Unpacking the Experiments
Using a computational systems biology approach, Abrusán explores the functional characteristics of proto-genes within the context of their cellular regulatory networks. Taking advantage of the entire collection ofS. cerevisiaeORFs clas-sified by conservation level (gene age), Abrusán investigates the differences between young and old genes by integrating gene classes with existing system-wide data. The features he examined, which we discuss here, fall into four categories: (1) gene regulatory interactions, (2) gene essentiality, (3) protein structure, and (4) genetic and protein interactions.
Gene regulatory interactions
Changes in the timing and the level in which genes are expressed are recognized to play an important role in evolution. A major mechanism underlying changes in gene expression involves the interactions between protein tran-scription factors and cis-regulatory DNA sequences surroun-ding gene regions (cisrefers to DNA sequences located near the gene, as opposed to a different part of the genome, or trans). Gene expression by its very nature involves multiple genes—both those that encode the regulatory transcription factors and those that are being regulated. Thus, rather than studying single genes as isolated entities, systems biology researchers are beginning to discern important evolutionary phenomena at the level of networks of regulatory interactions between genes.
Because the transition from proto-gene to gene is pre-dicted to involveregulatedtranscription (as opposed to the low-level chance transcription that occurs in nongene regions or early proto-genes), it is therefore expected that proto-genes will be in the process of developing distinct gene elements for regulated transcription. Regulated tran-scription requires cis-regulatory elements near the gene where RNA polymerase and transcription factors bind. To explore the gene regulatory interactions of new genes and compare them to older genes, Abrusán employed a database called YEASTRACT that catalogs information about tran-scription factors and their target genes. YEASTRACT is a compilation of data from S. cerevisiaeexamining 110 dif-ferent transcription factors, and the genes that they regulate (Abdulrehman et al. 2011). Much of these data originate from various types of high-throughput experiments.
A transcription factor may regulate many genes, but also, individual genes may be regulated by many transcription factors—some to turn it on, others to turn it off–in response to different cellular stimuli. It was previously shown that proto-genes in S. cerevisiaeare less likely than true genes to have a transcription factor bound nearby (Carvunis et al. 2012). Abrusán extended this analysis to examine the number of genes regulated by the same transcription factors, the number of transcription factors that regulate each gene, and the pres-ence of a feed-forward loop, where two transcription factors, one regulated by the other, both regulate the gene of interest. All of these measures aim to address how well integrated proto-genes are into the existing gene regulatory network.
Examination of the gene regulatory interactions of proto-genes revealed that young proto-genes have fewer known gene regulatory interactions and are regulated by fewer tran-scription factors than their older counterparts. However, the differences between old and young genes for each of the examined gene regulatory properties (co-regulated genes, number of transcription factors regulating a gene, and feed-forward loops) reveal that proto-genes still possess regula-tory interactions, suggesting that they are quite rapidly assimilated into the gene regulatory network.
Gene essentiality
Imagine all the parts that go into making a car. You could not remove a wheel or part of the engine and still have a drivable car, but the air conditioner and cup holders could certainly go. Similarly with genes, some are required for life, while others are not. You might predict that genes that are just beginning to acquire a cellular function would not yet be required for life, while older, highly conserved genes would be more likely to be essential to the cell.
The yeastS. cerevisiaehas been studied as a simple eukary-otic model organism for many years, and scientists have cre-ated separate strains of yeast that individually delete each and every gene (Winzeleret al.1999). Essentiality, as determined by the viability of a deletion mutant, gives an indication of the importance of the gene to the species. These“deletion strains” have also been used to assess the impact of the loss of a given
gene on the overall growth rate. Abrusán takes advantage of such a data set to compare the essentiality of newer genes to older genes. Yeast can grow as either haploid or diploid cells, and this study looked at how loss of one or two copies in a diploid state affected a yeast strain’s growth rate; thus, the genes in this data set are suggested to be required for normal yeast fitness (Deutschbaueret al. 2005). Using the homozy-gous deletion data sets, Abrusán found that older genes in higher conservation levels tend to be more essential than younger genes. Thus, only the oldest, most conserved genes seem to have a significant effect on yeastfitness.
Protein structure
Do new translatable open reading frames possess any structural characteristics? Due to their lack of conservation and young age, one might expect the protein products of new genes to initially be less structurally well formed. In contrast, the products of conserved genes are likely to have developed stable structures. A good starting point at which to address the structure of genes as they age is to examine the predicted secondary structures of the protein products from all different conservation levels.
As every protein is produced, it must be folded into its native conformation—that is, there are limited correct ways for the protein to fold, and alternative ways of folding will result in a nonfunctional protein. Many human genetic dis-orders are caused by DNA mutations that lead to small changes in the protein sequence that negatively affect the stability or structure of a protein. The sequence of the poly-peptide chain (the primary protein structure) of a predicted protein is determined by the genetic code or the codons within the boundaries of the open reading frame of the gene. The primary protein structure is a major determinant for the ability of a protein to fold into an ordered three-dimensional structure. A protein fold is a spatial arrange-ment of helices (generally a-helices) and extended chain segments (b-strands or sheets) that are separated byflexible loops and relatively rigid regions in the form of turns and coils. Helices are stabilized by local backbone hydrogen-bonding interactions. In turn,b-strands establish backbone interactions with distant strand elements. Folds are gener-ally defined by the composition and organization of their core helix and sheet secondary structure elements.
In contrast, the structures of proto-genes and randomly gen-erated protein sequences are predicted to be composed of higher levels of b-strands than what is predicted for older genes. These results suggest that newer translatable open reading frames have a propensity to form proteins contain-ing a higher degree ofb-strand content and that older open reading frames have lost this structural characteristic.
Is there a negative selective pressure againstb-strands in conserved genes? Proteins must carry out their functions in a crowded, complex environment of a cell, and while proteins will often physically interact with certain other proteins to carry out a task, it would be disastrous if a protein aggregated promiscuously with too many other cellular proteins. Some human disorders like Huntington’s disease are caused by mu-tant proteins that improperly aggregate with other proteins in the cell, eventually leading to cell death (Pollinget al.2012). Based on evidence that higherb-strand content is associated with protein aggregation, Abrusán tested the overall aggre-gation tendency using an algorithm that scores a protein’s aggregation propensity. The results of this test confirmed that proto-genes with higherb-strand content are more likely to aggregate. These results have implications on the evolution of protein structure and suggest that globally, higher b-strand content is a characteristic of less evolved structures.
Mutations accumulated over time shape the primary structure of a protein and its resulting three-dimensional structures. If a protein can tolerate a number of amino acid substitutions with little change in structure, stability, or function, it is said to be robust. Using a sequential in silico mutagenesis approach to simulate evolution, Abrusán tested proto-gene robustness, or the ability of a proto-gene to resist large structural changes with increasing mutation rates. His analysis showed that the predicted secondary structures of young genes change faster with sequence change than the older genes, and therefore proto-genes have low robustness against mutations. Similarly, he assessed the decay rates of a-helicesvs.b-strands and found thatb-strands decay con-siderably faster. Together, these data validate the suggestion that b-strand structure is more difficult to maintain over longer evolutionary periods thana-helices.
Genetic and protein interactions
Proteins generally carry out their biological functions in conjunction with other proteins in the cell. If two proteins physically interact with one another, it suggests that they function together. Other proteins genetically interact with each other. We discuss what a genetic interaction is, below, but this type of interaction also suggests that the two pro-teins function in the same process. Thus, both genetic and protein interactions are a measure of how well a gene is integrated into the cellular interaction network. Another way to think of this is whether the gene is a loner, working by itself within the cell, or whether it is social, doing its tasks in conjunction with other gene products.
We would expect that proto-genes, which are still in the process of developing a function, would have fewer genetic
and protein interactions, assuming that the increased aggre-gation propensity of proto-genes does not lead to non-specific protein interactions. Physical interactions between proteins are detected in several different types of experi-ments, including co-immunoprecipitation and yeast-two-hybrid assays (we do not discuss these methods here). The BioGRID database, which Abrusán used, includes protein– protein interaction data compiled from many different sour-ces (Chatr-Aryamontri et al.2013). Mining these data and binning the number of identified protein interaction part-ners for each gene in each of the 10 age groups revealed that older genes have more protein interaction partners. Thus, as a gene ages, it becomes much more connected to the interaction network than younger genes. These results are consistent with an earlier publication showing similar trends (Capraet al.2010).
Genetic interactions are a bit more complicated to understand than physical interactions. The way genetic interaction (also called epistasis) is observed is via mutant phenotype analysis. Specifically, when a mutation in one gene affects the phenotype conferred by a mutation in another gene, we say that the two genes genetically interact. This can happen in different ways. For example, two different genes may both function in muscle contractility. A mutation in each gene individually may decrease the contractile ability of muscle cells only slightly, but together they may cause complete contractility failure; this is an example of phenotype enhancement. Alternatively, a muta-tion in a second gene mightsuppressthe phenotype of a mu-tation in the first gene—this is also genetic interaction. Many studies have examined genetic interactions between genes, since it has been a useful method with which to identify new genes involved in particular biological pro-cesses. Most genetic interaction results have been compiled into the BioGRID database. Some of these genetic interac-tions also have scores associated with them, which indicate howstrongthat interaction is (Costanzoet al.2010). Abrusán used these data to compare the average strength of the genetic interactions between proto-genes and true genes. His analysis showed that genetic interactions, like protein interactions, also increase with age.
and significant amounts of systems biology data. Future stud-ies will show whether Abrusán’sfindings are indeed charac-teristic changes that occur to allde novogenes as they evolve in other lineages.
Suggestions for Classroom Use
This primer is aimed for undergraduate students. The pri-mer is meant to accompany the Abrusán (2013) article in a genetics or evolution course. We suspect that most faculty members have their own ideas for how to introduce under-graduates to the primary literature, and excellent ideas for such introductions have also been suggested in previous primer articles. We include two items to facilitate teaching with this article: a list of questions for review and discussion and a short supplemental exercise on navigating a genome database. For systems biology articles such as this, we think there is value in introducing students to some of the actual data sets that were used, to demystify the approach. The supplemental exercise could be done as a group exercise in class or expanded upon to create an assignment.
Questions for Review and Discussion
1. Estimate your evolutionary relatedness to the cockroach Periplaneta americana using TimeTree (http://www. timetree.org/index.php).
2. Consider the effects of mutations in protein-coding genesvs. mutations in noncoding DNA as driving evo-lutionary phenotypic change. How might mutation in noncoding DNA affect evolution?
3. On the basis of textbook knowledge of RNA polymerase II-mediated transcription and RNA processing, describe the steps required for a proto-gene to developregulated transcription and for the proto-gene mRNA to become translated into a protein.
4. Imagine yourself as a proto-gene, walking into a large, complex factory (the cell) with thousands of other
“worker”genes doing their specific jobs. You would like to be useful, but it seems that all the jobs are taken! How might you enhance the efficiency of production in the factory? Tie your ideas in to those examined by Abrusán—how far can you take this analogy?
5. In Figure 1 of this primer article, the arrows are going toward the right, toward gene evolution. Could the arrows also go backward? For example, could you have a proto-gene that loses its ORF, returning to become a nongene sequence? Would you expect the backward arrows be of equal, higher, or lower prevalence than the forward arrows?
6. In the phylogenetic tree in Abrusán (2013, Figure 1), if a gene that was present inS. cerevisiaewas also present inCandida albicans,but was not present in Debaryomy-ces hansenii, would you think that gene should be in-cluded in the conservation group for level 7? How could such a situation have arisen?
7. Abrusán (2013, Figure 3) reports on the number of essential genes in each conservation level group that do not overlap with other genes. For this analysis, why might you consider only proto-genes that do not overlap with other genes? How does the number of genes in each group affect your confidence in the data? Particularly note groups 1, 5, and 10.
8. In this study, Abrusán (2013) was limited by the data that were available, which is only on annotated genes (i.e., previously identified genes). How might this limita-tion skew thefindings on characteristics of proto-genes? 9. On the basis of results from this article, what additions would you suggest to Figure 1, the summary of how genes developde novo?
10. Abrusán investigated certain gene characteristics in this study. Can you think of any other characteristics for which it might be interesting to investigate the differ-ences between young and old genes?
Supplemental Exercise on Navigating a Genome Database
To begin, let us navigate through the Saccharomyces Ge-nome Database (SGD) to examine some specific yeast genes. We start with a well-annotated conserved gene, HMT1.
Step 1: Obtain HMT1 protein sequence information 1. Go tohttp://www.yeastgenome.org/.
2. In the search box in the upper right type HMT1 and click Enter.
From the Summary tab,what is the full name and function of this gene?
3. At the top of page click theProteintab.
How many amino acids does this protein have?
On the basis of the number of amino acids, how many nucleotides make up the protein-coding region in the DNA sequence?
4. Under the predicted sequence section, click on Down-load the sequencein FASTA format button. A new page will appear highlighting the HMT1 primary protein sequence. This can be highlighted and copied.
Step 2: Predict the HMT1 protein secondary structure 1. In a new tab, go to the protein secondary structure
prediction program PSSPred: http://zhanglab.ccmb. med.umich.edu/PSSpred/.
2. Paste the HMT1 protein sequence and input your e-mail address.
3. Press RunPSSPred.
5. The output is a secondary structure prediction pre-sented in different formats. The output shows the pro-tein sequence with a letter beneath each amino acid abbreviation, where C stands for coil (generally used when the sequence does not form an a-helix or b-strand), H stands for helix, and E stands for strand. 6. Tally up the number of H’s and E’s and determine the overall percentage of each structure by dividing the num-ber of each category by the total amino acids of HMT1.
What are the differences between primary,secondary, ter-tiary,and quaternary protein structure? Which of these are we investigating here?
7. Validate the prediction results with another program: SGD has a link to secondary structure predictions. Go back to the SGD HMT1 result under the summary tab andfind theExternal LinksunderResourcestoward the bottom of the page. Find the UniProtKB and click on the link to see an alternative database. Under the secondary structure prediction on UniProt, click the details link.
Does the UniProt prediction look similar to the PSSPred prediction?
Step 3: Explore other data sources
1. Explore how many other yeast species the HMT1 gene is conserved in. Under theSummarytab, in theAnalyze sequence section, click Fungal alignment. The results show an alignment of the protein sequence between different species, color coded for how similar they are.
How many other fungal species also have the HMT1 gene? Overall,how would you characterize the similarity (primar-ily identical/strong similarity vs. primar(primar-ily weak similarity)?
2. Explore the BioGRID protein interactions. These are summarized on SGD under theInteractionstab.
How many total interactors does HMT1 have?
How many are physical interactions vs. genetic interactions?
3. Explore gene regulatory interactions. Abrusán used the YEASTRACT data set; in SGD under theRegulationtab, YEASTRACT data (along with some other data sour-ces) are displayed. Only genes that are transcription factors would be expected to have any transcriptional targets (and HMT1 has none, since it is not a transcrip-tion factor). Transcriptranscrip-tional regulators are the genes that likely regulate the transcription of the HMT1 gene.
How many transcriptional regulators are predicted for HMT1?
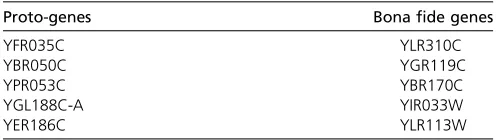
After having gone through this exercise, students should choose one S. cerevisiaeproto-gene and onebonafidegene from Table 1, and go through the same analysis steps. Did your two genes turn out to be similar to Abrusán’s systems biologyfindings (Table 1)?
Literature Cited
Abdulrehman, D., P. T. Monteiro, M. C. Teixeira, N. P. Mira, A. B. Lourencoet al., 2011 YEASTRACT: providing a programmatic access to curated transcriptional regulatory associations in Sac-charomyces cerevisiaethrough a web services interface. Nucleic Acids Res. 39: D136–D140.
Abrusán, G., 2013 Integration of new genes into cellular networks, and their structural maturation. Genetics 195: 1407–1417. Bertone, P., V. Stolc, T. E. Royce, J. S. Rozowsky, A. E. Urbanet al.,
2004 Global identification of human transcribed sequences with genome tiling arrays. Science 306: 2242–2246.
Brar, G. A., M. Yassour, N. Friedman, A. Regev, N. T. Ingoliaet al., 2012 High-resolution view of the yeast meiotic program re-vealed by ribosome profiling. Science 335: 552–557.
Capra, J. A., K. S. Pollard, and M. Singh, 2010 Novel genes exhibit distinct patterns of function acquisition and network integra-tion. Genome Biol. 11: R127.
Carvunis, A. R., T. Rolland, I. Wapinski, M. A. Calderwood, M. A. Yildirimet al., 2012 Proto-genes and de novo gene birth. Na-ture 487: 370–374.
Chatr-Aryamontri, A., B. J. Breitkreutz, S. Heinicke, L. Boucher, A. Winteret al., 2013 The BioGRID interaction database: 2013 update. Nucleic Acids Res. 41: D816–D823.
Cheng, J., P. Kapranov, J. Drenkow, S. Dike, S. Brubaker et al., 2005 Transcriptional maps of 10 human chromosomes at 5-nucleotide resolution. Science 308: 1149–1154.
Costanzo, M., A. Baryshnikova, J. Bellay, Y. Kim, E. D. Spearet al., 2010 The genetic landscape of a cell. Science 327: 425–431. Demuth, J. P., and M. W. Hahn, 2009 The life and death of gene
families. BioEssays 31: 29–39.
Deutschbauer, A. M., D. F. Jaramillo, M. Proctor, J. Kumm, M. E. Hill-enmeyeret al., 2005 Mechanisms of haploinsufficiency revealed by genome-wide profiling in yeast. Genetics 169: 1915–1925. Flicek, P., 2013 Evolutionary biology: the handiwork of tinkering.
Nature 500: 158–159.
Gerstein, M. B., C. Bruce, J. S. Rozowsky, D. Zheng, J. Du et al., 2007 What is a gene, post-ENCODE?: history and updated definition. Genome Res. 17: 669–681.
Hedges, S. B., J. Dudley, and S. Kumar, 2006 TimeTree: a public knowledge-base of divergence times among organisms. Bioin-formatics 22: 2971–2972.
Polling, S., A. F. Hill, and D. M. Hatters, 2012 Polyglutamine aggregation in Huntington and related diseases. Adv. Exp. Med. Biol. 769: 125–140.
Wilson, B. A., and J. Masel, 2011 Putatively noncoding transcripts show extensive association with ribosomes. Genome Biol. Evol. 3: 1245–1252.
Winzeler, E. A., D. D. Shoemaker, A. Astromoff, H. Liang, K. Anderson
et al., 1999 Functional characterization of theS. cerevisiaegenome by gene deletion and parallel analysis. Science 285: 901–906.
Communicating editor: E. A. De Stasio
Table 1 List of sample proto-genes and bona fide genes in
S. cerevisiae
Proto-genes Bonafide genes
YFR035C YLR310C
YBR050C YGR119C
YPR053C YBR170C
YGL188C-A YIR033W