Toward a Framework for Evaluating Extreme Programming
Laurie Williams
1,
William Krebs
2, Lucas Layman
1, Annie I. Antón
1 1North Carolina State University, Department of Computer Science
{lawilli3, lmlayma2, aianton}@ncsu.edu
2
IBM Corporation, [email protected]
Abstract
Software organizations are increasingly adopting the development practices associated with the Extreme Programming (XP) methodology. Most reports on the efficacy of these practices are anecdotal. This paper provides a benchmark measurement framework for researchers and practitioners to express concretely the XP practices the organization has selected to adopt and/or modify, and the outcome thereof. The framework enables the necessary meta-analysis for combining families of case studies. The results of running framework-based case studies in various contexts will eventually constitute a body of knowledge of systematic, empirical evaluations of XP and its practices. We present the initial validation of our XP evaluation framework based upon a year-long study of an IBM team that successfully adopted a subset of XP practices appropriate for their team culture and their project characteristics. Our findings suggest that agile/XP methodologies can be successfully adopted in environments reliant on traditional software methods.
1. Introduction
Often compelling empirical evidence is not available when a technology is introduced. Typically, such evidence evolves with the rate of adoption of the technology [17]. For example, strong empirical evidence of the value of the Software Capability Maturity Model (CMM) [35] came after wide initial adoption [17]. Similarly, Extreme Programming (XP) [8] is becoming increasingly popular. However, the evidence of its efficacy is still predominantly based upon experience reports. Anecdotes of industrial teams’ successes with partial or full implementations of XP are abundant [29, 30, 47]. However, organizations and researchers need a framework to assess empirically XP’s strengths and weaknesses in a variety of contexts. Examining the
efficacy of XP is a contemporary software engineering research challenge.
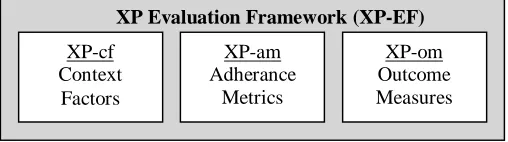
Sim et al. challenged the software engineering community to create benchmarks, or a set of tests used to compare the performance of alternative techniques [45]. In this paper, we provide a benchmark for expressing the XP practices an organization has selected to adopt and/or modify, and the outcome thereof. This benchmark, called the XP Evaluation Framework (XP-EF), is designed for use throughout development by agile [16] teams, and is comprised of metrics that are focused, concise, and can be collected by a small team without a dedicated metrics specialist. The XP-EF is comprised of three parts: XP Context Factors (XP-cf), XP Adherence Metrics (XP-am) and XP Outcome Measures (XP-om), as shown in Figure 1. Use of this framework enables the necessary meta-analysis for combining families of case studies. The results of running XP-EF-based case studies by our and other research teams in various contexts will eventually constitute a body of knowledge of systematic, empirical evaluations of XP and its practices. This body of knowledge will be valuable to organizations awaiting stronger evidence of the efficacy of the XP practices prior to adoption.
Figure 1. The structure of the XP-Evaluation Framework
In the XP-EF, researchers and practitioners record essential context information about a project via the XP Context Factors (XP-cf). Factors such as team size, project size, criticality, and staff experience can help explain variations in the results of applying the practices. The second part of the XP-EF is the XP Adherence Metrics (XP-am). Rarely, if ever, do software
XP Evaluation Framework (XP-EF)
XP-cf Context
Factors
XP-am Adherance
Metrics
development teams fully exercise all XP practices in a “pure” form [17]; some employ only a few practices. The XP-am enables one to express concretely and comparatively the practices a team utilizes. By examining multiple XP-EF case studies, the XP-am also allows researchers to investigate the interactions and dependencies between the XP practices and the extent to which the practices can be separated or eliminated.
Part three of the XP-EF is the XP Outcome Measures (XP-om); it provides researchers and practitioners a means to assess and report a team’s outcome from using a full or partial set of XP practices. The XP-om consists of traditional external software development metrics, such as productivity and quality. Ideally, a team (comprised of researchers and/or practitioners) performing a case study will have a baseline product that can be used for comparison.
The three parts of the XP-EF work together to enable the examination of the relationships between the context, the practices, and the team’s outcome, leading to the following general contention:
The use of {XP practices recorded by the XP-am} leads to {results recorded by the XP-om} when used by teams that operate within {context recorded by the XP-cf}.
In this research, we utilized the “industry-as-laboratory” [37] approach in which software engineering researchers worked closely with industry to create and evaluate solutions [37]. In a year-long, “in-vivo” (in the field, under normal conditions) [3] case study, the XP-EF was applied within an IBM software development team. This seven-person IBM team develops Servlet/XML applications for a toolkit that other IBM teams utilize to create products for external customers. The team adopted and sustained the use of a subset of XP practices deemed “safe” and appropriate for their team culture and project characteristics. This case study is the first of a family of XP-EF case studies, providing initial validation of the XP-am metrics. Additionally, it demonstrates how to conduct an XP assessment utilizing the XP-EF framework.
The remainder of this paper is as organized as follows. Section 2 discusses measurement frameworks and surveys related XP research. Section 3 sets the context for our IBM case study. Section 4 presents the results of the case study. Section 5 presents the analysis of our results and our plans for future work.
2. Background and related work
In this section, we discuss existing software measurement and assessment strategies, frameworks and metrics. We then provide a survey of prior XP studies.
2.1. Strategies and frameworks
Software measurement is imperative for companies competing in a rapidly-changing environment. McGarry proposes several project management strategies to establish a customized measurement framework [31]. Grady offers similar strategies tailored to customer satisfaction, defect prevention, analysis, and removal [20]. The ISO/IEC 14598 standard [22] establishes guidelines for measuring and assessing software quality.
Several frameworks for planning the collection of software metrics exist, including the Goal-Question-Metric (GQM) approach [1, 5], the Quality Improvement Paradigm (QIP) [4], the Model, Measure, and Manage Paradigm (M3P) [34], and the Measurement Information Model (MIM) [31]. These models are process-independent and may be used to establish systems of software measurement tailored to individual projects. Kitchenham et al. [25] proposed a detailed set of guidelines for designing, collecting data, analyzing, and reporting the results of empirical studies. The use of their guidelines is purported to improve the quality of individual studies and to increase the likelihood that meta-analysis can be used to combine the results of multiple related studies. These guidelines have been incorporated in the composition of the XP-EF.
Williams et al. [50] introduced a metric suite for empirically assessing an agile methodology’s effectiveness. Several hypotheses and metrics are proposed for productivity, cycle time, externally-visible pre- and post-release quality, responsiveness to customer change, internal code structure, and job satisfaction. This prior work serves as a foundation for the framework proposed herein.
2.2. Metrics and comparisons
The XP-EF is a compilation of validated and proposed metrics. Metric validation requires the convincing demonstration that (1) the metric measures what it purports to measure and (2) the metric is associated with an important external metric, such as field reliability, maintainability, or fault-proneness [18]. Schneiderwind proposes that six criteria be applied when validating software metrics: association, consistency, discriminative power, tracking, predictability, and repeatability [42]. The XP-om utilizes the CK suite of object-oriented metrics as defined by Chidamber and Kemerer [14]. These metrics have been repeatedly correlated with fault proneness in industrial projects. The consistency of these findings varies depending on the programming language under study [46] and therefore, the metrics are still open to criticism [15].
against a prior project’s measures within the same organization. Alternatively, comparisons can be made to industry standards and/or benchmarks. Jones has compiled data from many software organizations and provides benchmarks, best practices, and statistics for a range of software development topics [23].
2.3. XP studies
Practitioners and researchers have reported empirical and anecdotal studies of the XP methodology. Many, including the originator of XP, Kent Beck, contend that strict use of the specific XP practices is less important than embracing the methodology’s four values: communication, feedback, simplicity, and courage [8]. Robinson and Sharp [40] performed a participant-observer empirical study based on ethnography. The researchers immersed themselves and participated with an XP team to examine the relationship between the 12 XP practices and the XP values. Robinson and Sharp concluded that the practices can be used to create a community that supports and sustains a culture that includes the XP values. However, the specific 12 practices are not the only means for achieving the same underlying values; teams that adopt a subset of the practices can produce a similar culture [40]. There is a reflexive relationship whereby “the practices create and sustain values and values support, shape and frame practices” [40]. In our framework, we utilize the observable use of the XP practices to assess the extent to which a team has embraced the core XP values.
Companies are adopting XP in varying extents. Rasmussen describes a successful partial adoption of XP at TransCanada Pipelines Limited for the development of a new, web-based software product and for the rewrite of a legacy system [38]. Schuh describes a study in which XP was adopted to recover an ailing project [43] at Thoughtworks. Grenning provides lessons learned from the introduction of XP into a process-intensive organization [21] at a large company developing safety-critical systems. Lippert et al. suggest ways to successfully adapt and extend XP for complex projects based on experiences from five projects [28] at IT Workplace Solutions. Murru et al., describe a corporate research study in which a team of developers adopted different subsets of XP practices on two separate projects [33]. In the first of these two projects, the team eliminated the planning game practice and partially adopted the simple design paradigm; this project lacked process control and coordination. Comparatively, in the second project, the team adopted both the planning game and simple design and were successful. While practical and informative, these experience reports offer little formal validation to support claims of high customer
satisfaction, higher quality projects, and steady or improved schedules by XP projects.
In an XP university case study, Müller et al. found that pair programming, iteration planning, and test-driven development had mixed benefits and implementation difficulties. XP was best suited for small teams [32]; quantitative data and a replicable study will aid in substantiating these claims. Reifer reported the results of an industrial survey conducted to determine if agile methods/XP reduce costs and improve development time [39]. Results from 14 firms spanning 31 projects were collected. Most projects were characterized as small pilot studies, for internal use only, and of generally low risk. Most projects had average or better than average budget performance and schedule adherence. Projects in the software and telecommunications industry reported product quality on par with nominal quality ratings; e-business reported above par quality ratings; and the aerospace industry reported a below par quality rating for their agile/XP projects.
Poole and Huisman integrated several XP practices into an organization’s maintenance effort for a middleware project [36]. They observed a steady increase in the average number of closed bugs. The use of XP helped improve process visibility and discipline, and gathering metric results proved important. While quantitative results are limited, this study offers important first steps toward assessing the impact of XP practices. Wood and Kleb analyzed the productivity of an XP product [52]. They performed an experiment as part of a pilot study at NASA to assess XP in a mission-critical environment. The team used a new programming language and the XP practices to produce a project that evaluated the performance of a model for solving a mathematical problem. Taking into consideration a reduction in code size due to refactoring and use of a more concise programming language, the XP approach was approximately twice as productive as past similar projects. These results are intriguing, but data from larger teams in a less unique context is necessary before general conclusions can be drawn. Finally, Bowers et al. describe a study at Motorola where XP was partially adopted for developing mission-critical software [12]. The team developed a new release of a product, which entailed significant changes to a legacy code base. They observed increased productivity, higher velocity, and lower defect density compared to company averages. We envision researchers structuring case studies such as these using the XP-EF framework in the future.
3. IBM case study
relatively short time periods are often viewed as “research in the small” [19]. These experiments offer the ability to produce statistically significant results yet may suffer from external validity limitations. Alternatively, case studies can be viewed as “research in the typical” [19]. Concerns with case studies involve the internal validity of the research [13] because the baseline and new treatments generally are not identical projects and/or teams, and case studies are difficult to replicate [53]. Finally, case studies seldom yield statistically significant results due to a small sample size. Nevertheless, case studies are valuable because they involve factors that staged experiments generally do not exhibit, such as scale, complexity, unpredictability, and dynamism [37]. Researchers confidence in a theory increases when similar findings emerge in different contexts. By performing multiple case studies and/or experiments and recording the context variables of each case study, researchers can build knowledge through a family of empirical assessments. Replication addresses threats to experimental validity [6].
In this paper, we provide initial validation of the XP-EF and add to the knowledge of XP via a case study with an IBM development team in the United States. In our research, we compare the second and third releases of a product, heretofore referred to as the “old release” and the “new release” respectively. In the old release, the team began their initial adoption of XP practices. The team then increased and stabilized their XP adoption in the new release. This case study will be described in terms of the XP-EF. Detailed instructions and templates for measuring and reporting the XP case study data via XP-EF Version 1.2 have been documented by the authors of this paper [51] to aid other researchers in replicating our case studies.
3.1. XP-cf: Context factors
Drawing conclusions from empirical studies in software engineering is difficult as the results of any process largely depend upon the relevant context variables. One cannot assume a priori that a study’s results generalize beyond the specific environment in which it was conducted [6]. Therefore, recording an experiment’s context factors is essential for fully understanding the generality and utility of the conclusions as well as the similarities and differences between the case study and one’s own environment.
Software engineering has no well-defined standards for determining what contextual information should be recorded [25]. Jones [23] states that software projects can be influenced by as many as 250 different factors, but that most projects are affected by 10-20 major issues. He organizes key factors to be accounted for in every assessment into six categories: software classification,
sociological, project-specific, ergonomic, technological, and international. The XP-EF framework templates are correspondingly organized into these six categories, though we modify the last factor (international) to geographical. We also include developmental factors that use a risk-driven approach to determine whether a project would be most successful using an agile or plan-driven approach. In this subsection, we complete the XP-cf templates with data from the IBM case study.
Software classification. According to Jones, projects can be classified as one of six software types: systems (used to control physical devices); commercial (leased or marketed to external client); information systems (for business information); outsourced (developed under contract); military; or end user (private, for personal use). The IBM team developed software under contract for another IBM organization that ultimately marketed the product to external customers. We thus classify this project as outsourced software.
Sociological. Team conditions for both releases are shown in Table 1. Personnel is often considered the most prominent risk factor in software development [10], therefore, is it important to capture relevant information about team makeup. Sociological factors capture the development experience of the personnel, as well as their knowledge of the problem domain.
Table 1. Sociological factors Context Factor Old New
Team Size (Develop) 11 7 Team Education
Level
All: Bachelors Two: Masters
All: Bachelors Two: Masters Experience Level of
Team
20 years: 2 10 years: 3 <5 years: 2 Interns: 4
20 years: 1 10 years: 3 <5 years: 1 Interns: 1 Domain Expertise High
Language Expertise High Experience Proj Mgr High
Specialist Available GUI Designer Personnel Turnover 22% 36%
Morale Factors Manager change
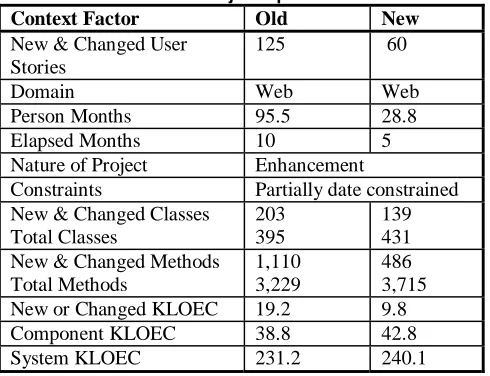
Project-specific. Projects of varying size and scope are subject to differing risk factors that may substantially affect development quality and schedule, making it necessary to record this context information. Table 2 compares the project-specific factors for the two releases. Based upon the number of new classes, methods, and lines of code (LOC), the new release is approximately half the size of the old release. In the Table 2, KLOEC are thousands of lines of executable (blank, non-commented) code. The team under study was responsible for the Component KLOEC, which this shipped as part of a larger product, the System KLOEC.
Table 2: Project-specific factors Context Factor Old New New & Changed User
Stories
125 60
Domain Web Web
Person Months 95.5 28.8
Elapsed Months 10 5
Nature of Project Enhancement
Constraints Partially date constrained New & Changed Classes
Total Classes
203 395
139 431 New & Changed Methods
Total Methods
1,110 3,229
486 3,715 New or Changed KLOEC 19.2 9.8 Component KLOEC 38.8 42.8 System KLOEC 231.2 240.1
Ergonomic. The physical working environment can have direct impact on communication flow and overhead. This is particularly important to XP’s core values of communication and feedback. Table 3 documents the projects’ ergonomic factors. Because both the old and new releases had the same conditions, no comparison is made. Ideally, an XP team has an open space office environment. The IBM team sat in one aisle of cubicles with room for two people to pair program. A white noise generator protected other development groups from the distractions of talking pairs. However, these white noise generators might also impede peripheral information between sets of pairs. Cockburn [16] and others emphasize the importance of this peripheral information flow. The IBM team, however, was unable to modify their facility.
Table 3: Ergonomic factors
Physical Layout Cubicles large enough to allow pair programming
Distraction level of office space
Low. White noise generators, semi-private cubicles Customer
Communication
E-mail, chat programs, phone, and databases
Technological. General software development tools and practices, such as code inspections, project management, and 4th generation languages, can have a dramatic effect on project productivity and quality. While the XP-am captures the use of XP practices, it is important to document other technological influences on a project’s outcome as well. During the three years prior to the old release, the IBM team had used successfully a blend of waterfall phases and informal small team practices that resembled those of XP. The team culture was small, informal, skilled, and adverse to heavy process. Due to their past success and their aversion to heavy process, the team often omitted heavyweight waterfall-development practices, including formal UML design documents and formal code inspections. In the new release, the team was more agile and adopted more of the XP practices. The project environment was marked by constraints that limited the team’s ability to adopt all 12 XP practices to their full extent, as discussed in Section 4. The team’s technology factors are summarized in Table 4.
Table 4: Technology factors Context Factor Old New Software
Develop-ment Methodology
Waterfall, with XP practices
Primarily XP
Project Management
Planning Game Gantt charts
Planning Game
Defect Prevention & Removal Practices
Design Reviews Pair Program, Customer Test, Unit Test
Language Java Java
Reusable Materials XML test data XML test data, IDE techniques
Geographical. Team location and customer location may greatly impact the feedback cycle length during software development. Table 5 documents the geographical factors. Because both the old and new releases had the same conditions, no comparison is made.
Table 5: Geographic factors
Team Location Collocated Customer
cardinality and location
Multiple; remote; multi-national, several time zones, some very far away
Supplier cardinality and location
Multiple; both remote and local; two time zones
understanding, dynamism, and culture) aid in selecting an agile, plan-driven, or hybrid process. Criticality indicates the magnitude of loss due to a defect, ranging from loss of many lives to loss of comfort. Personnel indicates the team’s ability, ranging from ability to perform procedural methods to ability to revise a method in an unprecedented situation. Dynamism is a measure of requirements volatility, and culture indicates the attitude of the team toward change.
These factors are graphed on a polar chart’s five axes, as shown in Figure 2. When a project’s data points for each factor are joined, shapes distinctly toward the graph’s center suggest using an agile method. Shapes distinctly toward the periphery suggest using a plan-driven methodology. More varied shapes suggest a hybrid method of both agile and plan-driven practices. The IBM development team’s factors are shown in Figure 2. The shape indicates that a hybrid “mostly agile, somewhat plan-driven method” is appropriate, which is what the team followed. The developmental factor that appears to necessitate plan-driven practices is criticality.
Figure 2: Developmental factors [adapted from [9, 11]]
3.2. Case study limitations
The second author of this paper tested, coded, and led the IBM team while participating as an action researcher in this study. His intimate knowledge potentially introduces some bias into the study. However, his direct involvement significantly aided the research because his detailed project knowledge provided qualitative details and insights. The team knew the study
was occurring, so a Hawthorne effect was a concern. However, the team was more concerned with completing the project and was generally ambivalent about the case study. An external team participated in part of the product test, which should help remove some bias.
Some learning effects must be considered because the comparison is made between two consecutive releases. However, we sought to reduce internal validity concerns by studying the same software project with a team comprised largely of the same personnel. The new release was approximately half the size of the old release and had a smaller development team. Smaller projects with smaller teams are often considered less complex. However, the new release involved understanding and updating a larger code base. The old release was available for eight months before the new release was made available in June 2003. Therefore, defects may still be discovered for the new release. A proportion of the defects discovered in field use of the new release can be attributed to unmodified code of the old release; these were counted as old release defects.
4. Framework/Results
This section explains the adherence and results metric suites.
4.1. XP-am: Adherence metrics
Determining and recording the subset of practices employed by a team is essential for comparison purposes. Additionally, organizations may be interested in the adherence to certain practices. For example, pair programming and test-driven development have been shown to improve quality [48, 49] and may be deemed high-priority practices. Adherence metrics also enable case study comparison, the study of XP practice interaction, and the determination of contextually-based, “safe” XP practice subsets. These metrics also provide insight into whether a team has adopted XP’s core values. The XP-am does not advocate high adherence as a universal benefit for all projects.
in-process corrections based on degree of use, trends, and variation between individuals. However, since the Shodan survey is subjective, it is not advisable to compare survey results across teams. Seven team members took the survey for the old release, and six did for the new release (this matches the number of full time team members). The objective measures thus portray the quantifiable adherence to XP practices for the old and new releases.
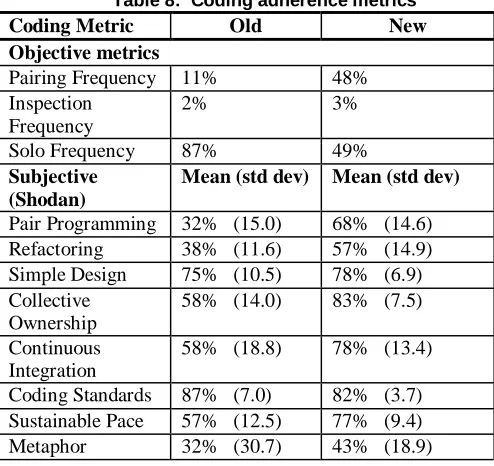
We present the combined results of these adherence metrics based upon three categories: planning (Table 6), testing (Table 7), and coding (Table 8).
Table 6: Planning adherence metrics
Though the customer was remote, the team was comfortable with their remote communication, feedback, and responsiveness via e-mail, chat programs, phone, and databases.
Table 7: Testing adherence metrics Testing Metric Old New Objective metrics
Test Coverage (quickset)
30% of lines 46% of lines
Test Run Frequency
< 10% 11%
Test Class to Story Ratio
N/A 0.45
Test LOC / Source LOC
< 0.30 0.42
Subjective (Shodan)
Mean (std dev) Mean (std dev)
Test First Design 17% (11.2) 55% (22.2) Automated Unit
Tests
43% (16.4) 67% (22.1)
Customer Acceptance Tests
63% (25.6) 78% (6.9)
Test coverage of new and modified code was high, but the measurement shown above is the average for the entire component, including code that was not modified or added. As such, this number underestimates the testing effort in the new release. Test-run frequency measures how often the automated tests are run. The data shown was manually calculated and partially estimated. Ideally, the measure should be automated, and the value should be at least 1.0, indicating that each team member runs the test suite at least once per day. The automated test classes per user story ratio allows the team to examine adherence to their goal of a test class for every user story. The team’s goals for coverage and run frequency were 60% and 90%, respectively. “Quickset” is the set of automated unit tests each developer runs several times a day before checking in code. Customer acceptance tests were run manually.
Table 8: Coding adherence metrics Coding Metric Old New Objective metrics
Pairing Frequency 11% 48% Inspection
Frequency
2% 3%
Solo Frequency 87% 49% Subjective
(Shodan)
Mean (std dev) Mean (std dev)
Pair Programming 32% (15.0) 68% (14.6) Refactoring 38% (11.6) 57% (14.9) Simple Design 75% (10.5) 78% (6.9) Collective
Ownership
58% (14.0) 83% (7.5)
Continuous Integration
58% (18.8) 78% (13.4)
Coding Standards 87% (7.0) 82% (3.7) Sustainable Pace 57% (12.5) 77% (9.4) Metaphor 32% (30.7) 43% (18.9)
Pairing frequency was calculated by examining file headers. In the program comment banner, the developers indicated who worked on any file creation or modification. Pairing frequency was calculated by searching for these comments; ideally a more automated, objective means of assessing pairing should be utilized. For the new release, people were given a choice of pairing, inspecting, or justifying why code was written alone. To satisfy remote stakeholders accustomed to traditional design artifacts, a Slim Design Up Front (SDUF) template was used that included the user story, test case, and design checklist.
Planning Metric Old New Objective metrics
Release Length 10 months 5 months Iteration Length Weekly Weekly Requirements
added or removed to Total Shipped Ratio
N/A 0.23 13 added,
1 removed, 60 delivered Subjective
(Shodan)
Mean (std dev) Mean (std dev)
Stand up meetings 72% (16.4) 90% (14.1) Short Releases 78% (27.3) 77% (9.4) Customer Access
/ Onsite Customer
60% (28.1) 87% (4.7)
4.2. XP-om: Outcome Measures
Of utmost importance to decision makers is whether or not adopting XP practices aids in productively creating a higher quality project. The IBM business-related results are shown in Table 9, using a relative scale to protect proprietary information.
Table 9: XP Outcome Measures (relative scale with the old release at 1.0)
XP Result Metric Old New Internal Code Structure (mean values)
Methods per class Depth of inheritance tree Number of children Coupling
Response for class Lines of code per class McCabe Complexity
1.0 1.0 1.0 1.0 1.0 1.0 1.0
0.96 0.96 1.55 1.01 0.99 0.98 0.74 Response to Customer Change (Ratio
(user stories in + out) /total)
N/A 0.23
Internally-Visible Quality (test defects/KLOEC of code)
1.0 0.502
Externally-Visible Quality*
(defects/KLOEC of code 6 months after release )
1.0 0.244
Productivity User stories / PM KLOEC / PM
1.0 1.0
1.34 1.7 Customer Satisfaction N/A High Morale (via survey) 1.0 1.11
Internal Code Structure. Since Big Design Up Front (BDUF) is not emphasized with XP, software developers can be concerned with the resulting design of the implemented code. We utilize CK metrics (discussed in Section 2.2) to assess the code structure. Table 9 displays the difference of the CK metrics between releases. With the exception of Number of Children, the internal code structure stayed relatively constant. In all cases, the mean values for these metrics did not exceed industry-standard thresholds [24, 41]. The cohesion metric of the CK suite was not computed due to lack of support for the validity of this metric [7]. Finally, the McCabe Complexity decreased.
Response to Customer Change. The number of user stories added and removed based on customer priority/preference change is important because it relates to an XP team’s degree of flexibility or agility. Response to Customer Change was not computed for the old release due to lack of availability. However, anecdotally, fewer requirements were added during the old release than the new release.
Internally-visible Quality. Internal (pre-release) quality improved by a factor of two. This metric was based upon the defects identified by an external IBM testing organization prior to release to the customer. For the old release, 65 scenarios were tested; for the new release, 96 were tested. Therefore, we assess that the testing effort for the new release was at least as thorough as that of the old release.
Externally-visible Quality. The new release’s six month post-release defect density has improved by a factor of four. The severity distributions of the defects between the two releases are similar. However, a direct comparison cannot be made because the severity scale changed during the new release.
Productivity. The productivity calculation used both user stories and lines of code (LOC) because neither measure is perfect. LOC is precise but customers pay for features, not LOC; the IBM team tries to reduce LOC via code reuse and refactoring. A benefit of the user stories/PM metric is it creates no extra work for the team, but this metric has not been calibrated. Function points were not used in this metric because they require use of a trained specialist and one was not available. Function points can be estimated from LOC, but the result can be inaccurate [23].
Customer satisfaction. XP proponents profess that customers are more satisfied with the resulting project because the team produced what the customer actually wanted, rather than what they had originally expressed they wanted. In the future, we plan to author and validate a customer satisfaction survey instrument. For the IBM project, anecdotally the customer was very satisfied with the team’s work.
Morale. Team morale was assessed via an additional question placed on the Shodan Adherence Survey. The question read, “How often can you say you are enjoying your work?” The survey results indicated an overall increase in morale as the team utilized more XP practices.
5. Discussion and Future Work
we acknowledge much work remains to further validate and extend this framework, particularly with regard to the XP adherence metrics.
We observed that practitioners can adopt a “safe” subset of XP practices despite warnings by XP advocates of the essential dependencies between practices, as supported by an interview study of 21 Canadian firms performed by El Emam [17]. In the case of the IBM case study team, some practices were used more than others. Variations occurred due to individual preference and corporate culture and constraints. We observed a steady increase in XP use by the team as they began to see perceived benefits of the process. The hybrid process was both agile and successful.
Our findings suggest that agile/XP methodologies can be successfully adopted in environments reliant on traditional software methods. Though the team members already considered themselves to be “lightweight” and informal, the traditional process at IBM was not and could not be totally abandoned. XP was adapted to provide prescriptive process guidance to the team while allowing them to maintain their desired informal culture. The consequent compromise between XP practices and existing methods generated a process that met project deadlines and produced a higher quality product. This case study advances the growing body of XP knowledge and suggests that the hybridization of agile and traditional methodologies is a viable middle ground for companies who do not fit into either archetype.
An active continuation of our research is refining and validating our suite of objective metrics, focusing on those metrics that can be automated. We are developing a written survey instrument to assess customer satisfaction. Quantitative studies, such as that outlined by the XP-EF, can be enriched via qualitative research [44]. We are currently piloting survey instruments that can be used to collect qualitative information to examine the “why” and the people aspects behind the quantitative findings. We are currently replicating this study with multiple industrial projects to compare the results. Specifically, we are utilizing the structure of the XP-EF to analyze the data of three completed case studies with varying contexts. Additionally, we are commencing two additional industrial case studies in 2004 that will also utilize the XP-EF. Finally, we have adapted the XP-EF for use in products development efforts that utilize functional languages and are in the midst of a case study with a small industrial team creating a compiler in Haskell. We welcome interested researchers to do the same. This family of case studies can be used to create an Experience Factory [2] of XP efficacy knowledge. Such research will also enable further validation of the XP-EF framework and aid in evolving this benchmark metric suite.
Acknowledgements
We wish to thank the IBM team for participating in this case study. Additionally, the participants of the Data Workshop at the XP/Agile Universe conference, Philip Johnson, and the NCSU Software Engineering Reading Group provided helpful feedback. This research was supported by NCSU CACC Grant 02-02.
References
[1] V. Basili, G. Caldiera, and D. H. Rombach, "The Goal Question Metric Paradigm," in Encyclopedia of Software Engineering, vol. 2: John Wiley and Sons, Inc., 1994, pp. 528-532.
[2] V. Basili, G. Caldiera, and H. D. Rombach, "The
Experience Factory," in Encycopedia of Software Engineering, J. C. Marciniak, Ed.: John Wiley, 1994.
[3] V. Basili, "The Role of Experimentation: Past, Present, Future (keynote presentation)," International Conference on Software Engineering, 1996,
[4] V. Basili and S. Green, "Software Process Evolution at the SEL," IEEE Software, vol. 11, no. pp. 58-66, July 1994. [5] V. Basili and D. Weiss, "A Methodology for Collecting Valid Software Engineering Data," IEEE Transactions on Software Engineering, vol. 10, no. pp. 728-738, Nov. 1984. [6] V. Basili, Shull, F.,Lanubile, F., "Building Knowledge through Families of Experiments," IEEE Transactions on Software Engineering, vol. Vol. 25, No.4, no., 1999.
[7] V. R. Basili, L. C. Briand, and W. L. Melo, "A Validation of Object Orient Design Metrics as Quality Indicators," IEEE Transactions on Software Engineering, vol. 21, no. 12, pp. 751-761, 1996.
[8] K. Beck, Extreme Programming Explained: Embrace Change. Reading, Massachusetts: Addison-Wesley, 2000. [9] B. Boehm and R. Turner, Balancing Agility and Discipline: A Guide for the Perplexed. Boston, MA: Addison Wesley, 2003.
[10] B. Boehm, "Software Risk Management: Principles and Practices," IEEE Software, no. pp. 32-41, January 1991. [11] B. Boehm and R. Turner, "Using Risk to Balance Agile and Plan-Driven Methods," IEEE Computer, vol. 36, no. 6, pp. 57-66, June 2003.
[12] J. Bowers, J. May, E. Melander, M. Baarman, and A. Ayoob, "Tailoring XP for Large System Mission-Critical Software Development," Extreme Programming/Agile Universe, Chicago, IL, 2002,
[13] D. T. Campbell and J. C. Stanley, Experimental and Quasi-Experimental Design for Research. Boston: Houghton Mifflin Co., 1963.
[14] S. R. Chidamber and C. F. Kemerer, "A Metrics Suite for Object Oriented Design," IEEE Transactions on Software Engineering, vol. 20, no. 6, 1994.
[17] K. El Emam, "Finding Success in Small Software Projects," Agile Project Management, vol. 4, no. 11. [18] K. El Emam, "A Methodology for Validating Software Product Metrics," National Research Council of Canada, Ottawa, Ontario, Canada NCR/ERC-1076, June 2000. [19] N. E. Fenton and S. L. Pfleeger, Software Metrics: A Rigorous and Practical Approach: Brooks/Cole Pub Co., 1998. [20] R. Grady, Practical Software Metrics for Project Management and Process Improvement. Englewood Cliffs, NJ: Prentice Hall, 1992.
[21] J. Grenning, "Launching Extreme Programming at a Process-Intensive Company," IEEE Software, vol. 18, no. 6, pp. 27-33, 2001.
[22] ISO/IEC, "DIS 14598-1 Information Technology - Software Product Evaluation," no., 1996.
[23] C. Jones, Software Assessments, Benchmarks, and Best Practices. Boston, MA: Addison Wesley, 2000.
[24] S. Kan, Metrics and Models in Software Quality Engineering: Addison Wesley, 2003.
[25] B. A. Kitchenham, S. L. Pfleeger, L. M. Pickard, P. W. Jones, D. C. Hoaglin, K. El Emam, and J. Rosenberg, "Preliminary Guidelines for Empirical Research in Software Engineering," IEEE Transactions on Software Engineering, vol. 28, no. 8, pp. 721-733, 2002.
[26] W. Krebs, "Turning the Knobs: A Coaching Pattern for XP Through Agile Metrics," Extreme Programming/Agile Universe, Chicago, IL, 2002,
[27] W. Krebs, L. Layman, and L. Williams, "The Extreme Programming Evaluation Framework Version 1.1," North Carolina State University Department of Computer Science TR-2003-17.
[28] M. Lippert, P. Becker-Pechau, H. Breitling, J. Koch, A. Kornstädt, S. Roock, A. Schmolitzky, H. Wolf, and H. Züllighoven, "Developing Complex Projects Using XP with Extensions," IEEE Computer, vol. 36, no. pp. 67-73, June 2003. [29] M. Marchesi and G. Succi, "Extreme Programming Examined," in XP Series, K. Beck, Ed. Boston: Addison Wesley, 2001.
[30] M. Marchesi, G. Succi, D. Wells, and L. Williams, "Extreme Programming Perspectives," in XP Series, K. Beck, Ed. Boston: Addison Wesley, 2002.
[31] J. McGarry, D. Card, C. Jones, B. Layman, E. Clark, J. Dean, and F. Hall, Practical Software Measurement: Objective Information for Decision Makers. Boston, MA: Addison Wesley, 2002.
[32] M. M. Müller and W. F. Tichy, "Case Study: Extreme Programming in a University Environment," 23rd International Conference on Software Engineering (ICSE2001), May 2001, 537-544.
[33] O. Murru, R. Deias, and G. Mugheddue, "Assessing XP at a European Internet Company," IEEE Software, vol. 20, no. 3, pp. 37-43, May-June 2003.
[34] R. Offen and R. Jeffery, "Establishing Software Measurement Programs," IEEE Software, no. pp. 45-53, March/April 1997.
[35] M. C. Paulk, B. Curtis, and M. B. Chrisis, "Capability Maturity Model for Software Version 1.1," Software Engineering Institute CMU/SEI-93-TR, February 24, 1993.
[36] C. Poole and J. W. Huisman, "Using Extreme
Programming in a Maintenance Environment," IEEE Software, vol. 18, no. pp. 42-50, Nov/Dec 2001.
[37] C. Potts, "Software Engineering Research Revisited," IEEE Software, no. pp. 19-28, September 1993.
[38] J. Rasmussen, "Introducing XP into Greenfield Projects: Lessons Learned," IEEE Software, vol. 20, no. pp. 21-28, May-June 2003.
[39] D. J. Reifer, "How to Get the Most out of Extreme Programming/Agile Methods," 2nd XP and 1st Agile Universe Conference, Chicago, IL, August 2002, 185-196.
[40] H. Robinson and H. Sharp, "XP Culture: Why the twelve practices both are and are not the most significant thing," Agile Software Development, Salt Lake City, UT, 2003, 12-21. [41] L. Rosenberg, "Applying and Interpreting Object Oriented Metrics," NASA Software Assurance Technology Center. [42] N. Schneidewind, "Methodology for Validating Software Metrics," IEEE Transactions on Software Engineering, vol. 18, no. 5, pp. 410-422, May 1992.
[43] P. Schuh, "Recovery, Redemption, and Extreme
Programming," IEEE Software, vol. 18, no. pp. 34-41, Nov/Dec 2001.
[44] C. B. Seaman, "Qualitative Methods in Empirical Studies of Software Engineering," IEEE Transactions on Software Engineering, vol. 25, no. 4, pp. 557-572, 1999.
[45] S. E. Sim, S. Easterbrook, and R. C. Holt, "Using Benchmarking to Advance Research: A Challenge to Software Engineering," International Conference on Software
Engineering, Portland, 2003, 74-83.
[46] R. Subramanyam and M. S. Krishnan, "Empirical Analysis of CK Metrics for Object-Oriented Design Complexity: Implications for Software Defects," IEEE Transactions on Software Engineering, vol. 29, no. pp. 297-310, April 2003.
[47] D. Wells and L. Williams, "Extreme Programming and Agile Methods -- XP/Agile Universe 2002," in Lecture Notes in Computer Science. Berlin: Springer-Verlag, 2002.
[48] L. Williams, R. Kessler, W. Cunningham, and R. Jeffries, "Strengthening the Case for Pair-Programming," in IEEE Software, vol. 17, 2000, pp. 19-25.
[49] L. Williams, E. M. Maximilien, and M. Vouk, "Test-Driven Development as a Defect-Reduction Practice," IEEE International Symposium on Software Reliability Engineering, Denver, CO, 2003,
[50] L. Williams, G. Succi, M. Stefanovic, and M. Marchesi, "A Metric Suite for Evaluating the Effectiveness of an Agile Methodology," in Extreme Programming Perspectives, M. Marchesi, G. Succi, D. Wells, and L. Williams, Eds. Boston, MA: Addison Wesley, 2003.
[51] L. Williams, W. Krebs, and L. Layman, "Extreme Programming Evaluation Framework for Object-Oriented Languages -- Version 1.2," North Carolina State University, Raleigh, NC Computer Science TR-2004-1, January 5, 2004. [52] W. Wood and W. Kleb, "Exploring XP for Scientific Research," IEEE Software, vol. 20, no. 3, pp. 30-36, May-June 2003.
![Figure 2: Developmental factors [adapted from [9, 11]]](https://thumb-us.123doks.com/thumbv2/123dok_us/1763519.1226758/6.612.62.304.326.560/figure-developmental-factors-adapted.webp)