J. Range Manage. 45277-284, May 1992
Estimating herbage standing crop from rainfall
data in Niger
BRUCE K. WYLIE, REX D. PIEPER, AND G. MORRIS SOUTHWARD
Authors are quantitative range scientist, professor, Dept. of Animal and Range Science; and professor, Dept. of Experimental Statitics, New Mexico State University, Las Cruces 88003.
Abstract
To help local Niger government authorities and donor countries ameliorate conditions in the advent of drought, a rapid yet simple means to assess annual herbrceous production at the end of the rainy season is needed. Several rainfall variables were tested as estimators of herbaceous production using weighted and loga- rithmic transformation in regression analysis. A computer pro- gram was developed in Basic to generate rainfall parameters from daily rainfall data. Input parameters used to calculate the rainfall variables were varied to minimize the regression standard error of the estimates. Selected regression models were compared using 80% confidence levels for mean values for each rainfall treatment class using logarithmic and weighted regressions. The selected weighted model involved the number of moist days and consecu- tive dry days as independent variables. The selected logarithmic model used total rainfall as the only independent variable. These models were tested by comparing an independent data set with the 95% confidence hrtervals for observations. Selected models separ- ated rangeland production classes of 200 kg l ha-r confidence lii- its for mean values. The logarithmic model could only do so when biomass levels were less than 800 l ha’*. Thus, these models only have application for predicting herbage biomass within rather large classes.
Key Words: production models, Sahel, biomass
An African bioclimatic zone where droughts are endemic, called the Sahel, extends east to west across the southern border of the Sahara Desert. The Sahel, roughly 200 km wide, is delineated by the 150-mm isohyet in the north and the 300-mm isohyet in the south (Justice and Hiemaux 1986). Droughts have devastating effects on national economies and people’s livelihoods. Pastoral- ism contributes to the livelihood of many people in the Sahelian country of Niger, with livestock being second only to uranium in foreign exchange earnings. In Niger, livestock numbers decreased by 50% during the 84-86 drought (Onwordi 1989). Attempts at predicting droughts in the Sahel are unreliable. Rather, current drought early warning systems address early identification of drought so government decision makers and donor countries can develop relief strategies (Sollod 1990, Wheeler 1988). A rapid pasture assessment program at the end of the growing season would not only help government annual management and policy decisions, but it would be an important complement to GIS oriented drought early warning systems which combine economic, health and ecological factors (Wheeler 1988). Rainfall data are relatively easy and inexpensive to obtain, and precipitation is an important determinant of primary productivity (Davy et al. 1976). The objective of this research was to develop a simple model to estimate upland rangeland production using rainfall indexes (cal- culated from daily precipitation data) as predictor variables.
Journal Article 1512 of the New Mexico Agr. Exp. SW, Las Cruces. Manuscript accepted 30 August 199 1.
JOURNAL OF RANGE MANAGEMENT 45(3), May 1992
Description of Area
The Sahel has a unimodal rainfall pattern, with the rainy season beginning as early as June and ending as late as mid-October in the pastoral zone. Most forage production occurs in the rainy season in the form of herbaceous annuals. The subsequent 8-9 month dry season is harsh for livestock because of the lack of green feed, low forage quality and, in some years, low forage quantity.
Sahelian herbaceous production exhibits extreme interannual variations. Average annual pasture production levels in the central pastoral zone of Niger from 1984 to 1987 varied from 8 to 388 kg l ha-’ north of 16” north latitude and from 32 to 816 kg l ha-’ south of 16” north latitude (Wylie et al. 1987).
Rainfall events in the Sahel tend to be high-intensity storms (Hoogmoed and Stroosnijder 1984) resulting from localized con- vection cells that exhibit high spatial variability. Estimated average storm cell size was 5 to 20 km along the wind direction (Davy et al. 1976). Year-to-year rainfall variation can differ from the mean by 50% in the Sahel and 100% in the southern Sahara.
The study area was the pastoral zone of central Niger, which is roughly square, with the towns of Tahousa, Tassara, Agadez, and Tanout located in each corner of the square (Fig. 1). The area includes 9 million ha with annual rainfall varying from 100 mm in the north to 400 mm in the south. Dominant ecological land systems in the southern half of the project zone are river-drained savannas and sand dune grasslands (Milligan 1982). These are dominated by annual grasses and forbs, primarily Arlstida mutabi- lls Trin. & Rupr., Cenchrus btjlorus Roxb., and Indigofera spp. The scattered trees are primarily Acacia spp. and Balanites aegyp- tlaca Del.
Major ecological land systems in the northern part of the project zone are uniform savannas, and runoff and flood plains. Vegeta- tion cover here is more sparse, with perennial grasses being more prevalent than in the south. Tree cover in the north is mostly Commiphora africana and Acacin spp.
Methods Biomass
Upland sites with sandy soils were selected to represent the river-drained savanna and the sand dune grassland ecological land systems mapped by Milligan (1982). Rangelands that develop in these ecoregions are traditionally grazed during the 9-month dry season. The sites were sampled at the end of the growing season (late August-September) in 1980-1986.
Biomass was estimated by double-sampling (Cook and Stub- bendieck, 1986 p. 245), using weighted least-squares regression analysis. Each site had 20 to 150 plots, with roughly 10% being clipped. Plot size varied among sites and years from 0.1 to 0.5 m*. Each pasture standing crop mean represented a l-ha area, except for 6 sites at Ibecetene in 1985, which were only 0.5 ha. Sampling was usually conducted within existing rain gauge exclosures; how- ever, if no suitable site was available at the rain gauge, and several exclosures or lightly grazed areas were available around the village,
24 ,
Fig. 1. Loerrtion of study area, mean annual kohyete (1951~1982), end the approximate limit of cultivation in the Republic of Niger.
22
18
16
14
12
after AGRHYMET 1984
At-lit
LIMIT OF CULTIVATION ---
ISOHYn
---
l
I
I
I
I
II
I I II
II
I
0
2
4
6
8
10
12
14
16
LONGITUDE
sampling was in the 4 cardinal directions from villages. Plot cluster placement was random. Within each plot cluster, several plots were placed systematically. The number of clusters and plots per cluster varied among sites and years.
rainfall summed for the rainy season in mm. These data were used in the analyses.
Moderate Analysis
A single, pooled regression equation based on double samplingwas established for each person estimating plot weights over the sampling period. These regression equations were then tested for possible differences in slopes and intercepts among sites (Neter et al. 1983; p. 285) to test site indicator variables and interaction terms. Sites found to have different slopes or intercepts were characterized by separate regressions.
Precipitation
Precipitation variables were generated from a Basic program, INTERVAL, which had the option to divide the rainy season into 2 periods based on calendar date. The output files generated by INTERVAL contained all the rainfall variables for the first period, second period, and the entire rainy season, respectively. The cutoff time between the early and later parts of the rainy season in INTERVAL was varied (15 Aug., 1 Sept., 10 Sept., and entire rainy season) to determine the usefulness of early rainy season precipitation to estimate end-of-rainy-season pasture standing crop. The rainfall variables produced by INTERVAL were grouped into 3 classes for rainfall-biomass model development: (1) minimal, (2) moderate, (3) extensive analysis of rainfall data.
Effective rainfall was the rain index used to test moderate analy- sis of daily rainfall data. Effective rainfall was defined as the total daily rainfall in mm between minimum and maximum rainfall limits. Rainfall events that exceeded the maximum were counted as the maximum amount. Rain events below some minimum amount contribute insignificantly to herbage production because of high evaporative losses. On the other hand, large rainfall events exceed- ing some maximum amount can completely saturate the soil at the herbaceous plant rooting depth. Additional moisture above the maximum results in percolation of soil moisture below the rooting depth of herbaceous plants, as well as high amounts of surface runoff.
Effective rainfall was calculated using inputed minimum (5,7, and 10 mm) and maximum rainfall limits (30, 40, and 50 mm). Appropriate effective rainfall limits were identified by selecting models with rainy-season-long and early-(up to 15 August) rainy- season effective moisture.
Extensive Analysis
Minimum Anrrlysis
The only minimum analysis rainfall variable was the total daily
Soil water-holding capacity in the rooting zone of annual her- baceous vegetation, daily evapotranspiration and a crude root growth model were user-defined inputs into INTERVAL.
INTERVAL allows soil water to increase with each rainfall event, up to the soil moisture-holding capacity in the rooting zone of herbaceous plants. The root growth model in INTERVAL is a linear regression, similar to that of Van Keulen et al. (1985), in which the user inputs the amount of rain available to germinating annual herbaceous plants (in mm) as the intercept, BO, and a daily growth factor, the slope (Bl), for each day the rooting zone was moist and conducive to plant growth. Root growth occurs up to a user-defined maximum root depth measured in mm of soil water.
For each day, the daily evapotranspiration amount was sub- tracted from the water stored in the rooting zone. The number of days when the rooting zone was moist and conducive to plant growth was called moist-days, and this variable was used as an index of rainfall quantity.
For extensive analyses of rainfall data, moist-days was the sole rainfall quantity variable. Two different sets of BO and Bl terms were tested: 80 = 5 mm and Bl = 1 .OO, and BO = 7 mm and Bl = 1.50. These root growth models allowed 35 and 22 moist days, respec- tively, to attain a rooting development sufficient to access the equivalent of 40 mm of rainfall in soil water. For each of these 2 soil root growth models, 3 levels of daily evapotranspiration were tested: 2, 4, and 6 mm/day. These evapotranspiration rates were similar to those recorded by Cocheme and Franquin (1967), Davy et al. (1976), and Hiemaux (1984). Within each of these daily evapotranspiration rates, 3 different values for the maximum root- ing zone or soil water capacity in mm of rainfall were tested: 30,40, and 50 mm, which roughly corresponded to the middle 2 groups of the 4 available soil water groups used by Davy et al. (1976).
Options available in INTERVAL include the subtraction of estimated runoff from the rainfall variables. The subroutine that estimates runoff from rainfall amount was taken from Penning de Vries and Djitiye (1982, p. 144). In addition, the daily evapotrans- piration rate could be varied as a function of the amount of soil water available in the rooting zone and the age of the vegetation.
Using the soil water model above, the number of days soil water was not conducive to plant growth were also identified and called dry-days. Drydays constitute a stress on plants, and should have a substantial negative effect on plant production, especially extended moisture stress periods. INTERVAL quantifies the number of consecutive days occurring in stress periods.
The rainfall distribution variables, dry-days and consecutive day-days, were calculated with varying input parameters. The input parameters were the number of consecutive dry-days needed to constitute a plant stress period (stress period), the cutoff date for stress period calculations (end date), and the number of moist-days needed to end or break a plant stress period (break). In general, these input parameters were similar to those used in Mali (Hier- naux 1984).
The rainfall distribution variables (consecutive dry-days and dry-days) were tested as possible additions to selected moist-days models. This was done with stepwise regression analysis consider- ing the 2 rainfall distribution variables for the first part of the rainy season (up to the respective cutoff date), the latter part of the rainy season (after the cutoff date) and the entire rainy season. The stress period calculation was done only until the number of moist-days exceeded the values input for the end date input parameter, 30 and 50 moist-days, respectively.
Precipitation-Biomass Regression
The precipitation variables and estimated biomass values for each site from 1980-1985 was used to establish regression relation- ships between biomass (dependent variable) and rain indices (independent variables calculated from respective input parame-
ters). The regression analysis strategies employed were weighted least-squares and ordinary least squares using a natural logarith- mic transformation. The weighting term used was the sampling variance of the respective biomass estimates.
The natural logarithmic transformations of the dependent vari- able was used because nonlinear increases in herbaceous growth have been monitored in the Sahel (Hiemaux 1984, Le HouCerou and Host 1977, Penning de Vries and Djiteye 1982, p. 166). Also plots of the data points indicated they conformed to a general form that is best explained by a logarithmic transformation of the dependent variable (Neter et al. 1983, p. 138). Residual plots of the models were used to assess linear trends and homogeneity of variances visually.
The most appropriate rainfall input parameters were determined by selecting input parameters that minimized the standard error of the regression estate. This was done for the 3 rainfall data analysis classes: (1) minimal, (2) moderate, and (3) extensive, employing both weighted and logarithmic models.
Models were evaluated by comparing the 80% confidence limits for predicted mean values of the different regression models. Because the models used different independent variables, the con- fidence intervals were plotted using actual versus predicted axes to facilitate comparisons. Comparisons of the best models from each of the 3 levels of rainfall analysis (minimal, moderate, and exten- sive) allowed selection of the weighted least squares and logarith- mic models. Selected models from the 1980-1985 data set were then tested by determining if an independent data set, the 1986 biomass and rainfall variables, were contained in 95% confidence intervals for observations. Binomial probabilities were used to test if the number of observations within the confidence intervals war- ranted rejecting or accepting the model.
Results
andDiscussion
Pasture production regression analyses were separated and/or pooled in accordance with the extra sum of squares principle. In general, the adjusted Rz values were acceptable with 5 having R2 values less than 0.60. Standard errors of the estimate, transformed by the weighting, were less than 40 kg l ha“, except in 4 cases, 2 of
which are from 1984, with Tabalak having the highest standard error of 91 kg l ha“ in 1986.
Regression equations were pooled to provide an adequate number of clipped plots to represent each regression equation. However, 3 of the regression equations had fewer than 10 clipped plots and 1 had only 3 clipped plots.
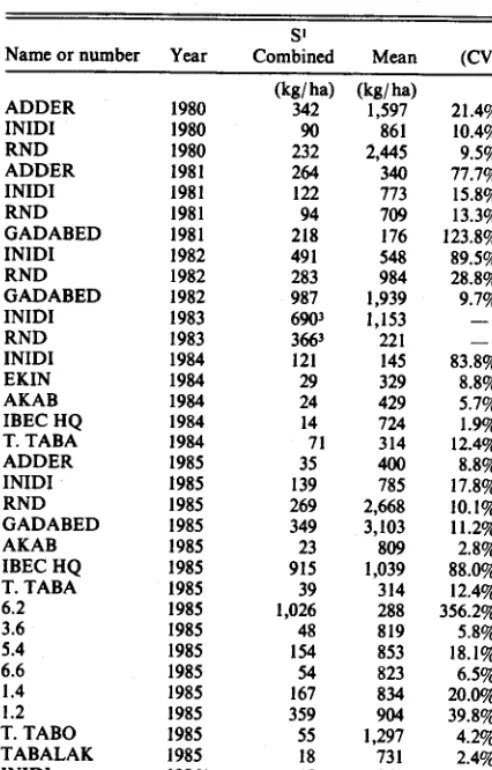
Fifteen regression equations were used to convert average esti- mated plot weight per site to estimated equivalent air dry weights (Table 1). The column of s combined is the sample standard deviation combined from both the regression and the mean esti- mated plot weight (Cook and Stubbendieck 1986 p. 247). Coeffi- cients of variations (CV) for pasture production means were gener- ally less than 30%. Raw data were not available for 2 sites in 1983, Inidi and Ranch North Dakoro (RND), so sampling standard deviations were estimated.
Weighted-Least-Square Analysis
The minimal analysis model with a cutoff date of 15 August had the lowest standard error of the regression estimate. August is usually the wettest month, with the reproductive phenological stage for the dominant grass (Cenchrus b1floru.s) and other species photoperiodically triggered around mid-August.
Selected effective moisture minimum and maximum parameter values were compared with varying cutoff dates for moderate analysis model. There was a better lit with the 15 August cutoff date and 7 and 30 as minimum and maximum effective parameter
Table 1. Pasture biomass estimates and statistics obtained with double
sampling for each site 1980-1986. values (Table 2). This implies that rainfall events of less than 7 mm and greater than 30 mm do not contribute significantly to herbage standing crop.
S’ Total
Name or number Year Combined Mean (CV) precip.
ADDER INIDI RND ADDER INIDI RND GADABED INIDI RND GADABED INIDI RND INIDI EKIN AKAB IBEC HQ T. TABA ADDER INIDI RND GADABED AKAB IBEC HQ T. TABA
F: 514 6.6 1.4 1.2 T. TAB0 TABALAK INIDI RND AKAB IBEC HQ TABALAK 1980 1980 1980 1981 1981 1981 1981 1982 1982 1982 1983 1983 1984 1984 1984 1984 1984 1985 1985 1985 1985 1985 1985 1985 1985 1985 1985 1985 1985 1985 1985 1985 19864 19864 19864 19864 19864 ‘bk:“’ 90 232 264 122 94 218 491 283 987 6903 3663 121 29 24 14 71 35 139 269 349 23 915 39 1,026 48 154 54 167 359 55 18 45 75 29 36 579
(kg/W O-N2
1,597 21.4% 108 861 10.4% 116 2,445 9.5% 204 340 77.7% 121 773 15.8% 213 709 13.3% 235 176 123.8% 37 548 89.5% 78 984 28.8% 214 1,939 9.7% 98
1,153 - 226
221
145 837%
118 85 329 8.8% 58 429 5.7% 83 724 1.9% 189 314 12.4% 62 400 8.8% 136 785 17.8% 163 2,668 10.1% 256 3,103 11.2% 257 1,:: 2.8% 162 88.0% 234 314 12.4% 67 288 356.2% 268 819 5.8% 256 853 18.1% 234 823 6.5% 251 834 20.0% 250 904 39.8% 246 1,297 4.2% 138 731 2.4% 314 868 5.2% 298 199 37.8% 167 619 4.6% 270 895 4.0% 321 3,117 18.6% 365
‘Sampling standard deviation (Cook and Stubbendieck, 1986 p. 247).
Total precipitation excludes early rains that occurred before the surviving germina- tion occurred.
‘Raw biomass data were not available for these sites. The s combined was estimated by averagmg the x combined for the closest larger and smaller biomass values. ‘The 1986 pasture production estimates were used only to test the models developed.
Table 2. Minimum and maximum early effective moisture limits xnd cutoff dates effects on standard errors using a linear weighted least-square~ model and a logxrithmic model.
Minimum Maximum Cutoff
Weighted Logarithmic standard standard
error error
5 5 5 5 5 5 5 5 7 7 7 7 10 10 10 10 40 40 40 40 50 50 50 50 :o” :o” 30 30 30 30 15-Aug 01-Sep IO-Sep 30-Sep 15-Aug 01-Sep IO-Sep 30-Sep 15-Aug 01-Sep IO-Sep 30-Sep 15-Aug 01-Sep IO-Sep 30-Sep ---kg/ha-‘---____
3.87 0.67 4.40 0.65 4.41 0.64 4.52 0.65 3.99 0.68 4.47 0.66 4.40 0.64 4.51 0.66 3.79 0.68 4.39 0.66 4.45 0.64 4.60
4.56 8.2 4.56 0:65 4.58 0.63 4.64 0.65
For early and entire season rainfall extensive analysis weighted models. the root deuth model of Bo = 7 and Bl = 1.50 had relatively
low standard errors of estimates and were selected. Daily evapora- tion rate had greater effects on the weighted standard errors of estimates than soil water-holding capacity. An evaporation rate of 4 mm l day“ and a soil water capacity of 40 mm were selected for analyses with different cutoff dates.
For this model, as with weighted least-squares models using effective rainfall and total rainfall, the weighted standard error of the estimate was lowest using the 15 August cutoff date. Using the weighted exensive model with selected input parameters given above, the lowest standard error of the estimates was attained with no runoff estimation and a constant evapotranspiration rate. The estimation of percent runoff as a linear function of daily rainfall amount did not improve the model. Perhaps the selection of upland sites with sandy to sandy loam soils minimized runoff effects, or runoff is more strongly related to rainfall intensity rather than amount (which was used here). The oversimplification of the factors affecting the fluctation of daily evapotranspiration rates added to the model’s variability.
Temporal Distribution
Some distribution variables were significant for particular soil moisture model input parameter variations with the selected exten- sive weighted model (Table 3). The minimum weighted standard error of the estimate (3.44) was obtained using a M-day period with 3 consecutive moist-days to break the plant stress period.
Table 3. Linear weighted least squares regreseion results with additional significant independent variables to the moist days independent vxriable.
7 15 15 30 7 7 15 15 30 Stress period (days) Weighted standard
error of estimate 3.71 3.47 3.52 3.71 3.51 3.50 3.44 3.46 37.1 Pearson correlation coefficient* -0.36 -0.08 -0.52 -0.31 -0.36 -0.10 End Independent
date variables
30 moist-days 30 moist-days, strlr 30 moist-days, strt4 30 moist-days 50 moist-days, strl 50 moist-days, strt 50 moist-days, strl 50 moist-days, strt 50 moist-days
‘Pearson correlation coefficient between independent variables. *Moist days variable up to the cutoff date.
‘Stress peti.od variable, consecutive dry days up to the cutoff date.
Stress pertod variable up to the number of moist days determined by the rainfall distribution input parameter, end date.
The 15 August cutoff date was used for both independent varia- bles. Pearson correlation coefficients between the independent variables were small. A condition number indicated multicollinear- ity was not a problem for this model (Belsley et al. 1980).
One would expect the consecutive dry-days variable to be nega- tively correlated to pasture production; however, in this model, it was positive:
P + 233.84 + 18.32 Xr + 4.48 Xz
where X1 q moist days
X2 q consecutive dry days 9 q estimated biomass (kg/ ha)
where P is the biomass estimate in kg l ha“. Stress periods for consecutive drydays were a minimum of only 15 dry-days. Smaller
900
700
500
300
100
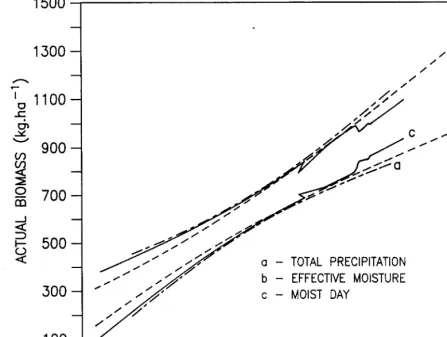
- TOTAL PRECIPITATION
EFFECTIVE MOISTURE
C-
MOIST DAY
200
400
600
800
1000
1200
ESTIMATED BIOMASS (kg.ha-')
Fig. 2. Comparison of best weighted least squares models 80%~ confidence intervals for mean valuee.
rainfalls could occur within these 15 days. Three moist-days were needed to break a plant stress period. Using the dailyevapotranspi- ration rate of 4 mm used in this model, rainfall events of up to 11 mm could occur without breaking the plant stress period. The positive coefficient for consecutive negative days may be indicating that plant efficiency of soil moisture use increases under moisture deficits. Stomata1 closure under moisture stress reduces daily eva- potranspiration rates and increases water use efficiency (Van Keulen et al. 1985). Thus, the constant daily evapotranspiration rate used in this model underestimated biomass levels when condi- tions are moderately xeric. In addition, widely spaced, large rain- fall events would favor deep root development, improving plant moisture availability.
Comparison of Better Models
The 80% confidence intervals for mean values showed little difference in the middle section of the respective regressions (Fig. 2). At the extreme ends of the regressions, however, confidence limits could be separated. The widest confidence limits were for total precipitation. The moderate-width confidence interval was for the moderate analysis of rainfall, or the effective moisture variable. The best extensive rainfall analysis model was a multiple regression including moist-day and consecutive dry-day as inde- pendent variables. These confidence limits are the narrowest at low and high biomass estimates. The peculiar fluctuations in these confidence limits at higher biomass values are the result of the effect of the second independent variable.
For a drought early warning system, the importance of accuracy in the extremely high and low biomass values should not be under- estimated. The extensive analysis of rainfall model was the selected
JOURNAL OF RANGE MANAGEMENT 45(3), May 1992 281
model for estimating pasture production with a linear weighted least squares-analysis.
Testing Selected Model
The plotting of the weighted 95% confidence limits was done on the transformed data set. This was necessary because of the high variability of the respective biomass error terms for a given pre- dicted biomass range. In the transformation process to simulate a weighted least-squares analysis, the divisor of both the independ- ent and dependent variables is the square root of the weighting term (Neter et al. 1983, p. 171). In this case, the divisor is the biomass sampling standard deviation from Table 1.
2400
800
a
0
40
80
120
160
200
240
280
320
TOTAL PRECIPITATION
(mm)
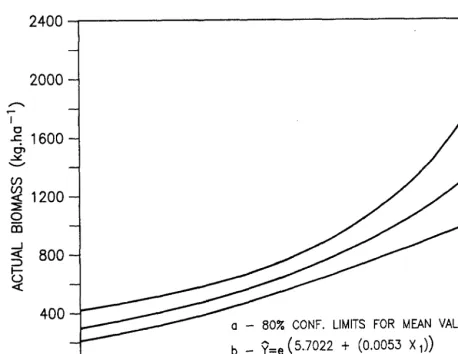
Fig. 3. The 80% confidence interval for mean values for the weighted moist day and consecutive dry-day model.
80% CONF. LIMITS
FOR MEAN VALUES
b- ?=&5.7022 t (0.0053 X,))
I
I
I
I
I
I
I
I
I
and should be tested with additional data in the future.
This model allows the estimation of end of rainy season pasture production using rainfall data only up to the mid- riny season, August 15. This could be useful predicting impending pasture deficits and surpluses in the pastoral zone of Niger midway through the rainy season.
The adjusted R2 for this model was 0.64, and the weighted standard error of the estimate was 3.4. No apparent lack of fit or heterogeneity was observed in the residuals.
This model would be applied to obtain herbage stand crop estimates to represent upland sites with sandy soils for regions within the pastoral zone. To obtain a regional biomass estimate, data from several rain gauges would be used. Thus, the moist-days and consecutive dry-days from each rain gauge would be averaged, then the averages would be entered into the regression equation. The 80% confidence intervals for mean values seem appropriate for this application. Figure 3 indicates pasture production levels could be separated using roughly 200 kg/ha incremented production means. The problem with weighted analysis is that the error term of the biomass value should be known. In some instances, estimated error term values can be used. Biomass sampling standard deviations used in this study were erratic and were not a function of the independent variables; consequently, biomass error terms would be difficult to estimate.
Logarithmic Analysis Minimal Analysis of R&fall
For the logarithmic model, total precipitation was most strongly associated with herbage standing crop using a cutoff date of 10
September. A logarithmic model would be appropriate to estimate exponential herbaceous growth that occurs in the Sahel until the above ground production is about 1,000 kg l ha-’ (Penning de
Vries and DjitCye 1982, p. 166). Moderate Analysis of Rainfall
Comparisons of the standard error of the estimates for selected input effective rainfall parameters and cutoff date using a loga- rithmic model are presented in Table 2. For the logarithmic model, it appears the cutoff date of 10 September, generally, has the lower standard error of the estimate. The lowest standard error of the estimate was obtained with a minimum effective moisture limit of
10 and a maximum of 30. Extensive Analysis of Rainfall
The root depth model of Bo = 5 and Bl = 1.00 had a lower minimum standard error of estimate. The most appropriate loga- rithmic model with an 15 August cutoff date had rainfall input parameters of 50 mm for soil water capacity, and a daily evapo- transpiration of 6 mm.
.
Using the most appropriate logarithmic input parameters deter- mined the cutoff date was varied (15 August, 1 Sept., 10, Sept. and entire season). The logarithmic model had a smaller standard error with a cutoff date of 10 September, as was the case with the logarithmic models for total precipitation and effective moisture. None of the distribution variables contributed significantly to this model.
Comparison of Better Models
900
700
500
300
100
R
= 0.64
200
400
600
800
ESTIMATED BIOMASS (kg.ha -‘)
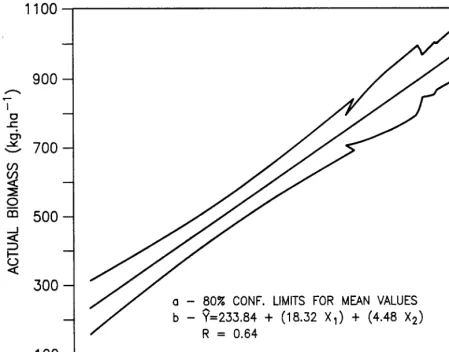
Fig. 4. The 80% confidence intervals for meen veh~es for the beat logarithmic model using total precipitation.
for best logarithmic models in each rainfall analysis category showed that even at the extreme estimated biomass values, differ- ences in accuracy of the models were nominal.
The lack of a substantial difference in the confidence interval widths indicates little precision was gained by using a logarithmic model with moderate or extensive analysis of the rainfall data. Therefore, use of total rainfall seems to be appropriate for the logarithmic model.
Testing Selected Models
The 1986 test data were plotted with the 95% confidence inter- vals for observations of the selected logarithmic model. The North Dakoro Ranch test data point again was low, as expected, but was still within the confidence intervals. The other 4 test data points were all well within the confidence intervals.
The 80% confidence intervals for mean values (Fig. 4) shows that production classes could be separated at about 200 kg l ha-’ inter-
vals for biomass estimates less than 800 kg l hg-‘. Above 800
kg l hg-‘, the confidence bands increase the interval spacing to 400
kg l hg-’ or more.
Model coefficients were: p = JS.702236 + (0.005338 Xl)]
where P = the estimated biomass (kg/ ha)
Xl = the total precipitation (mm)
The adjusted R2 was 0.29, and the logarithmically transformed standard error of the estimate as 0.65. The residual plot of the transformed data show no apparent lack of fit or heterogeneity of the variance.
1000
Using the 10 September cutoff date should include the bulk of the rainy season in the pastoral zone. This model is simple and appears to give moderately precise estimates of end of rainy season production levels on rainfall throughout the bulk of the rainy season.
Conclusions
Both selected models appear to have possibilities for applica- tion. For early warning of drought conditions, even before the completion of the rainy season, the selected weighted-least-squares model could be applied. The government of Niger could predict regional end of rainy season biomass levels by mid-August. How- ever, this model requires the use of a computer program (INTER- VAL) to generate rainfall indexes, moist-days, and consecutive dry-days. Average moist-days and consecutive dry-days indexes should be averaged across 20 or more rain stations within the region for which the biomass estimate is to be made. This model would require daily rainfall data from the pastoral zone of Niger, which is available daily for selected meteorological stations. How- ever, additional rain stations exist that may require regional or even site visits to acquire data. Other disadvantages of this model are: (1) it requires estimates of biomass error terms (one could estimate biomass with a CV of 3oo/o), and (2) that the test of this model was only marginally acceptable.
The logarithmic model that was selected does not require daily precipitation data, only total precipitation prior to 10 September. This is advantageous because some historical rainfall data sets are only available in monthly or IO-day totals, not in daily amounts. The logarithmic model also does not require a computer program
to generate the total rainfall index. These factors make this model appealing for estimating historical biomass levels within the pas- toral zone of Niger. The mean total precipitation from 20 or more rainfall stations should be used for this model when estimating biomass levels. Problems with the selected logarithmic model include widening of the confidence intervals for biomass levels above 800 kg l hg-’ and total rainfall index accounted for less than 30% of the variation in biomass levels, indicating relatively low predictive power of the model.
Literature Cited
Agrhymet Progrrme. 1984. Ten day regional agrometerological bulletin (May-October 1984). Centre Regional de Formationet d’Application en Agrometerologie et Hydrologie Operationelle, Niamey, Niger.
Belsey, D.A., E. Kuh, nd R.E. Welsh. 1980. Regression diagnostics: infuen- tial data and sources of collinearity. John Wiley & Sons, N.Y.
Cocheme, J., and P. Franquht. 1967. An agroclimatology survey of a semiarid area in Africa south of the Sahara. Tech. Note 86, WMO-210. TP. 110. World Meteorological Organization, Geneva.
Cook, C.W., and J. Stubbendieck (eds.). 1986. Range research: basic problems and techniques. Sot. Range Manage. Denver, Colo.
Davy, E.G., F. Marrei, and S.I. Solomon. 1976. An evaluation of climate and water resources for development of agriculture in the Sudano- Sahelian zone of West Africa. Spec. Environ. Rep. 9, W-459. World Meteorological Organization, Geneva.
Hiernaux, P. 1984. Distribution des pluies et production herbacee au Sahel: line methode empirique pour caracteriser la distribution des precipita- tions journalieres et ses effets sur la production herbacee, premiers resultats acquis dans le Sahel maien. ILCA Programme document N AZ 98. Feb.
Le Houerou, H.N., and C.H. Hoste. 1977. Rangeland production and annual rainfall relations in the Mediterranean basin and in the African Sahelo-Sudanian zone. J. Range Manage. 30:181-189.
Hoogmoed, W.B., and L. Stroosnijder. 1984. Crust formation on sandy soil in the Sahel. I. Rainfall and infiltration. Soil and Tillage Res. 4:5-23.
Justice, C.O., and P.H.Y. Hiernaux. 1986. Monitoring of grasslands of the Sahel using NOAA AVHRR data: Niger 1983. Int. J. Remote Sensing 7:1475-1497.
Van Keulen, H., H. Breman, J.J. van der Lek, J.W. Menke, J. Stroosni- jider, and P.W.J. Uithol. 1985. Prediction of actual primary production under nitrogen limitation. In: N. de Ridder et al. Proc. of ILCA-ARO- CAB0 workshop. ARO, Bet Dagan, Israel.
Milligan, K. 1982. Aerial survey of humane, livestock, and environmental conditions in a central region of the pastoral zone of Niger. ILCA. Final Report. March.
Neter, J., W. Wasserman, and M.H. Kutner. 1983. Applied linear regres- sion models. Richard D. Irwin, Inc. Ill.
Dnwordi, I. 1989. Drought in the Sahel. Camel Express (Friends of Niger) Edition II. 4066th St. SE, Washington, D.C.
Sollod, A.E. 1990. Rainfall, biomass and the pastoral economy of Niger: assessing the impact of drought. J. Arid Envir. 18:97-107.
Penning de Vries, F.W.T., and M.A. Djiteye. (eds.). 1982. La productivitt des pltuarages saheliens, une etude des sols, des vevitations et de 1 exploitatin de cette ressource naturelle. Centre for Agr. Publ. Dot., Wageningen.
Wheeler, D.L. 1988. Field workers collect data for early warnings of famine in sub-Saharan Africa. Cronic. of Higher Ed. A5. 23 March.