Western University Western University
Scholarship@Western
Scholarship@Western
Electronic Thesis and Dissertation Repository
11-21-2017 11:00 AM
Exploiting Fission Yeast Genetic Interaction Data to Identify
Exploiting Fission Yeast Genetic Interaction Data to Identify
Disease-Specific Drug Targets for Tuberous Sclerosis Complex
Disease-Specific Drug Targets for Tuberous Sclerosis Complex
Ashyad Rayhan
The University of Western Ontario
Supervisor
Dr. Jim Karagiannis
The University of Western Ontario Graduate Program in Biology
A thesis submitted in partial fulfillment of the requirements for the degree in Master of Science © Ashyad Rayhan 2017
Follow this and additional works at: https://ir.lib.uwo.ca/etd
Part of the Biology Commons, Disease Modeling Commons, Genetics Commons, and the Molecular Genetics Commons
Recommended Citation Recommended Citation
Rayhan, Ashyad, "Exploiting Fission Yeast Genetic Interaction Data to Identify Disease-Specific Drug Targets for Tuberous Sclerosis Complex" (2017). Electronic Thesis and Dissertation Repository. 5067. https://ir.lib.uwo.ca/etd/5067
This Dissertation/Thesis is brought to you for free and open access by Scholarship@Western. It has been accepted for inclusion in Electronic Thesis and Dissertation Repository by an authorized administrator of
i ABSTRACT
Tuberous sclerosis complex (TSC) is an inherited genetic disorder caused by
loss-of-function mutations in either TSC1 or TSC2. Their respective gene products regulate the
mechanistic target of rapamycin (mTOR) signaling pathway, which serves as an activator
of cellular proliferation, metabolism, and cell survival. Orthologs of the TSC1 and TSC2
genes exist in a wide range of organisms, including the commonly used and genetically
tractable model eukaryote, Schizosaccharomyces pombe. To better understand the
functional roles of S. pombetsc1 and tsc2, I exploited recent advances in genetic interaction
biology to identify and characterize genes that modulate the phenotypic effects of tsc1 and
tsc2 gene deletions. As part of this work, I found ypa1 (encoding a peptidyl-prolyl cis-trans
isomerase) and fft3 (encoding an ATP-dependent DNA helicase) to be negatively
interacting with both tsc1 and tsc2. Importantly, while the loss of either ypa1 or fft3 in
isolation had negligible effects on colony growth, their loss in tsc1Δ or tsc2Δ backgrounds
resulted in significant growth impediments. Thus, the inhibition of either ypa1 or fft3 might
represent an “Achilles’ heel” of cells defective in tsc1 or tsc2 function. Lastly, I found that
the negative interaction between ypa1 and tsc2 is conserved in mammalian cells. This
suggests that the targeted inhibition of the orthologous gene product in humans epitomizes
a novel therapeutic strategy to combat the TSC pathology.
Keywords: tuberous sclerosis complex, fission yeast, gene buffering, genetic interaction,
ii
CO-AUTHORSHIP STATEMENT
This thesis incorporates material that is the result of joint research between Ashyad Rayhan
and Adam Faller (under the supervision of Dr. Jim Karagiannis) and between Ashyad
Rayhan and Dr. Alexander Timoshenko. A. Faller’s contribution is limited to the
construction of the tsc2-R1296P mutant fission yeast strain and the tsc2-R1296P ypa1Δ
and tsc2-R1296P fft3Δ double mutant strains used in this study. Dr. Timoshenko provided
expert guidance with respect to the culturing of mouse embryonic fibroblasts. In all other
instances, the experimental work, data analysis, interpretation, and writing were performed
iii
ACKNOWLEDGEMENTS
I would like to begin by thanking Dr. Jim Karagiannis for granting me the opportunity to
work as a graduate student. I am forever grateful for his unconditional support and
unwavering guidance throughout the course of my work. His utmost confidence in my
abilities and constant encouragement were invaluable, not only to my thesis work, but also
to my future career aspirations. I am eternally appreciative of the knowledge and skillset I
have been able to harness from Dr. Karagiannis.
I would like to also thank members of my advisory committee – Dr. Anne Simon,
Dr. David Smith, and Dr. Alexander Timoshenko. Together, they provided invaluable
comments, feedback and constructive criticism that helped fuel successful completion of
my thesis work. I am forever indebted to Dr. Timoshenko for providing me with access to
his laboratory and equipment to complete crucial cell culture experiments.
I would like to extend my utmost gratitude to Dr. DJ Kwiatkowski and Kathryn
Lasseter of Brigham and Women’s Hospital and Harvard Medical School, Boston, MA,
USA. Dr. Kwiatkowski kindly provided the MEF samples and Kathryn provided crucial
assistance with cell culture handling and procedures. I would like to also thank members
of the Karagiannis Lab – Farzad Asadi, Adam Faller, and Dorothy Michalski, for countless
discussions and constant encouragement. I am specially indebted to Adam for his
assistance in the completion of several experiments.
Lastly, I am forever thankful to my parents for their undying support and love. They
are incredible human beings who have taught me the value of respect, patience, humility,
iv
TABLE OF CONTENTS
Abstract ………... i
Co-authorship statement ………. ii
Acknowledgements ………...… iii
Table of contents ……….... iv
List of tables ………... vi
List of figures ……….... vii
List of abbreviations ………..… ix
Chapter I: Introduction ………... 01
1.1Tuberous sclerosis complex ……… 01
1.2The Akt-TSC1/2-mTOR signaling pathway ………...…… 03
1.3Fission yeast as a model system to study TSC pathology ……….…. 07
1.4Gene buffering and genetic interactions ……….. 09
1.5Genetics to therapeutics: rationale for my study ...……….……. 13
1.6Hypothesis and predictions ……….…… 15
Chapter II: Materials and methods ……….... 16
2.1Yeast strains and culture conditions ………...…. 16
2.2Generation of S. pombe double mutants ……….. 21
2.3Colony growth analysis ………...……… 21
2.4Cell culture and reagents ………... 21
2.5Genotyping the mouse embryonic fibroblasts ………...…….. 22
v
2.7RNA extraction and cDNA synthesis ………..…… 24
2.8Cell viability assay ……….. 26
2.9Data analysis ………... 26
Chapter III: Results ………...…… 27
3.1Validation of candidate negative interactors ………..………..………... 27
3.2Additional synthetic interaction screens ………. 29
3.3Identification of catalytic sites within the interactors ………..… 33
3.4Assaying clinically orthologous mutations in S. pombe ………..… 39
3.5Genotyping the mouse embryonic cell lines ……….…………... 45
3.6Conservation of negative interactions in mouse embryonic fibroblasts ... 49
Chapter IV: Discussion ………. 53
4.1Overview of the fission yeast genetic interactome ……... 53
4.2Characterization of the validated negative interactors ……….……..… 54
4.3Applying the concept of synthetic chemical-genetic interactions …...……… 58
4.4Investigating disease-causing clinical mutations in S. pombe ………...…….. 60
4.5Conservation of synthetic interactions ……….... 62
4.6Implications, challenges and future directions …………..………..… 63
Literature cited …..……….... 68
vi LIST OF TABLES
Table 2-1: S. pombe strains used in this study ………..………..…. 20
vii LIST OF FIGURES
Figure 1-1: The multisystem pathogenesis of tuberous sclerosis complex ……….. 02
Figure 1-2: The conservation of hamartin and tuberin across species ……….. 04
Figure 1-3: The Akt-TSC1/2-mTORC1 signaling cascade ………..………. 06
Figure 1-4: The TSC/Rheb/mTOR signaling pathway is well conserved in S. pombe …. 08
Figure 1-5: The buffering of genetic variation ………..… 11
Figure 1-6: Applying synthetic lethality to cancer therapeutics ………..……….. 12
Figure 2-1: Methodology used to construct the Bioneer haploid gene deletion mutant set
…...……….... 17
Figure 2-2: Methodology used to generate ypa1 and fft3 mutant strains via site-directed
mutagenesis ……….………. 18
Figure 2-3: Generation of the Tsc2-/- allele in mouse embryonic fibroblasts ……....…… 23
Figure 3-1: Representative example of YES-agar media plate used in colony growth
analysis………...………...………..………….. 28
Figure 3-2: tsc1∆ypa1∆ and tsc2∆ypa1∆ double mutants exhibit reduced colony growth
relative to the respective single mutants ………...……….... 30
Figure 3-3: tsc1∆fft3∆ and tsc2∆fft3∆ double mutants display decreased colony growth
relative to the respective single mutants ……….………..…….……… 31
Figure 3-4: tsc1∆cdk11∆ and tsc21∆cdk11∆ double mutants do not exhibit differences in
colony growth relative to the respective single mutants ……….………... 32
Figure 3-5: Double mutants of lip2∆ and aap1∆ (adjacent to ypa1) do not exhibit growth
viii
Figure 3-6: Double mutants of atg14∆ and spac25a8.03c∆ (adjacent to fft3)do not exhibit
growth defects relative to the respective single mutants ………...……… 36
Figure 3-7: Multiple sequence alignments comparing Ypa1p and Fft3p to their human and
mouse orthologs .……….………..… 38
Figure 3-8: tsc1∆ypa1-D212G and tsc2∆ypa1-D212G double mutants do not exhibit
reduced colony growth relative to the respective single mutants ...………….………. 40
Figure 3-9: tsc1∆ypa1-V208D and tsc2∆ypa1-V208D double mutants do not exhibit
reduced colony growth relative to the respective single mutants ...……….………. 41
Figure 3-10: tsc1∆fft3∆791-872 and tsc2∆fft3∆791-872 double mutants do not exhibit
reduced colony growth relative to the respective single mutants ....…………..………… 42
Figure 3-11: tsc1∆fft3-K418R and tsc2∆fft3-K418R double mutants demonstrate reduced
colony growth relative to the respective single mutants …...……….……… 43
Figure 3-12: Clustal Omega alignment of human TSC2 and fission yeast Tsc2p …….... 44
Figure 3-13: tsc2-R1296P ypa1∆ and tsc2-R1296P fft3∆ double mutants demonstrate
reduced colony growth relative to the respective single mutants ……….…...… 46
Figure 3-14: Genotyping of the P118 and P119 MEF cell lines ………... 48
Figure 3-15: siRNA knockdown at 48 hours ………...……….. 51
ix
LIST OF ABBREVIATIONS
4E-BP1 4E binding protein-1
Akt Akt serine/threonine kinase
cDNA complementary DNA
DMEM Dulbecco’s modified eagle’s medium
DNA-PK DNA-dependent protein kinase
DPBS Dulbecco’s phosphate-buffered saline
DSB double stranded breaks
EMM Edinburgh minimal medium
FBS fetal bovine serum
Fft3p fission yeast gene product of fft3
GAP GTPase activating protein
gDNA genomic DNA
gRNA guide RNA
HR homologous recombination
IR insulin receptors
LAM lymphangioleiomyomatosis
MEF mouse embryonic fibroblasts
mTOR mechanistic target of rapamycin
mTORC1 mTOR complex 1
mTORC2 mTOR complex 2
x
NHEJ non-homologous end joining
NPD non-parental ditype
ORF open reading frame
PCR polymerase chain reaction
PDK1 phosphoinositide dependent protein kinase-1
Pen-strep penicillin-streptomycin solution
PI3K phosphoinositide 3-kinase
PP2A serine/threonine protein phosphatase 2A
PTPA phosphotyrosyl phosphatase activator
Rheb ras homolog enriched in brain
RNAPII RNA polymerase II
ROS reactive oxygen species
S6K1 ribosomal s6 kinase-1
SGA synthetic genetic array
shRNA short hairpin RNAs
siRNA small interfering RNAs
SPA sporulation agar
TAE tris-acetic EDTA
Tor fission yeast target of rapamycin
TrypLE cell culture dissociation agent
TSC tuberous sclerosis complex
tsc1 fission yeast gene encoding hamartin
xi
Tsc1p fission yeast hamartin
tsc2 fission yeast gene encoding tuberin
TSC2 human gene encoding tuberin
Tsc2p fission yeast tuberin
YES yeast extract with supplements
1
CHAPTER I: INTRODUCTION
1.1Tuberous sclerosis complex
Tuberous sclerosis complex (TSC) is an autosomal dominant genetic disorder with an
occurrence of approximately 1 in 8,000 live births (Rosner et al., 2004; Rosser et al., 2006).
The disease causes benign tumors (known as hamartomas) in the brain, heart, kidneys,
lungs, and eyes (Napolioni and Curatolo, 2008; Roux et al., 2004). Moreover, patients often
suffer from a variety of skin conditions (e.g. hypomelanotic macules, facial angiofibromas,
and forehead plaques) (Rosner et al., 2008). Neurological conditions such as autism,
seizures, and learning disabilities are also common among affected individuals (Sampson,
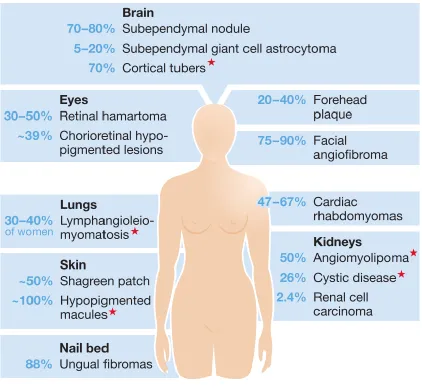
2009; Young and Povey, 1998). Figure 1-1 outlines the major clinical manifestations of
the TSC pathology.
Loss of heterozygosity in either TSC1 gene or the TSC2 gene is frequently
associated with the TSC pathology in humans (Hengstschlӓger et al., 2001; Jones et al.,
1999). The TSC1 gene on chromosome 9q34 encodes hamartin, a 130-kDa hydrophilic
protein containing a transmembrane domain and a coiled-coil domain that mediates
protein-protein interactions (van Slegtenhorst et al., 1997; Jozwiak, 2006). The TSC2 gene
on chromosome 16p13.3 encodes tuberin (The European Chromosome 16 Tuberous
Sclerosis Consortium, 1993). Tuberin, a protein of approximately 200 kDa, forms an
intracellular heterodimeric complex with hamartin to regulate downstream signaling
(Jozwiak, 2006; Rosner et al., 2004). This process is regulated by tuberin phosphorylation
which prevents both the degradation of tuberin by ubiquitination and the formation of
2
Figure 1-1: The multisystem pathogenesis of tuberous sclerosis complex. A range of tissues and organs are affected in those with TSC. Respective clinical conditions are noted in the blue boxes with percentages representing the corresponding occurrence in
patients. Red stars (*) indicate clinical conditions that may arise from alternate
3
The hamartin-tuberin heterodimer is a key upstream component of the mechanistic
target of rapamycin (mTOR) signaling pathway (Laplante and Sabatini, 2006).
Importantly, homologs of the human TSC1 and TSC2 proteins are found across a range
species, demonstrating that the signaling network is highly conserved (Figure 1-2)
(Serfontein et al., 2011). Studies have also shown that the TSC1-TSC2 heterodimeract as
a tumor suppressing complex to regulate cellular growth and proliferation (Mak and
Yeung, 2004; Piedimonte et al.,2006; Roux et al., 2004). Interestingly, TSC-specific tumor
progression follows the Knudson two-hit model of oncogenesis (i.e. where an inherited
loss of function mutation in one allele and a sporadic loss of function mutation in the
remaining allele lead to loss of heterozygosity at either the TSC1 or TSC2 locus) (Jozwiak
et al., 2008; Mak and Yeung, 2004).
1.2The Akt-TSC1/2-mTOR signaling pathway
The mTOR signaling pathway plays an important role in regulating cellular growth,
proliferation, survival and metabolism (Franz and Weiss, 2012). mTOR is a
serine/threonine kinase that belongs to the phosphoinositide 3-kinase (PI3K) related kinase
family (Xu et al.,2014). mTOR is evolutionarily conserved and forms the catalytic core of
two distinct multi-protein complexes, mTOR complex 1 (mTORC1), and mTOR complex
2 (mTORC2) (Laplante and Sabatini, 2012); together, they promote cell growth in response
to positive inputs such as nutrients and growth factors (Menon et al.,2014).
The hamartin-tuberin heterodimer (TSC1-TSC2 complex) is a key upstream
regulator of mTORC1 (Laplante and Sabatini, 2012). Tuberin possesses a catalytic GTPase
4
Figure 1-2: The conservation of hamartin and tuberin across species. Domain structure of the TSC1 (hamartin) and TSC2 (tuberin) proteins across species. Various colours indicate the relative level of homology to the orthologous human TSC proteins. The fission yeast Tsc1p and Tsc2p proteins are indicated with a red arrow. The coiled-coil (CC) domains of the human TSC1 and TSC2, in addition to the TSC1 interaction
domain (T1-ID) and GAP domain of TSC2 are conserved in S. pombe. The TSC2
5
protein (Manning and Cantley, 2003). Rheb (Ras homolog enriched in brain) is rendered
inactive (GDP bound) by the negative GTPase activity of tuberin (Laplante and Sabatini,
2012). Once growth factors and nutrients activate the insulin receptors (IR), PI3K can
recruit phosphoinositide dependent protein kinase-1 (PDK1) which mediates serine
phosphorylation of serine/threonine kinase Akt (Xu et al.,2014). Upon activation, Akt can
phosphorylate and subsequently inhibit the TSC1-TSC2 complex; this results in the
activation of Rheb (now GTP bound), which mediates the downstream activation of
mTORC1 (Astrinidis and Henske, 2005; Benjamin and Hall, 2014; Dalle Pezze et al.,
2012). Aforementioned cell growth and proliferation is achieved upon further
phosphorylation of several downstream effectors by mTORC1, leading to activation of the
ribosomal s6 kinase-1 (p70S6K1) and inhibition of the 4E binding protein-1 (4E-BP1)
(Manning and Cantley, 2003).
Adding to the complexity of the Akt-TSC1/2-mTORC1 pathway is a negative
feedback loop, initiated by p70S6K1-dependent phosphorylation and inhibition of IRs
(Dalle Pezze et al., 2012). Furthermore, low energy levels, hypoxia, and cellular stress are
also able to inactivate mTORC1 signaling (Benjamin and Hall, 2014). Growth factors can
also modulate mTORC2 activation, however, the complex is geared towards cell survival,
metabolism, and cytoskeletal organization (Dalle Pezze et al., 2012; Laplante and Sabatini,
2012). Previous works suggest that mTORC2 activity is dependent on PI3K and is resistant
to both rapamycin and the negative feedback loop that moderates mTORC1 activity (Dalle
Pezze et al., 2012). Interestingly, mTORC2 activity is independent of Akt-TSC1/2
regulation, suggesting a different regulatory mechanism for this signaling cascade (Dalle
6
7
1.3Fission yeast as a model system to study the TSC pathology
The fission yeast Schizosaccharomyces pombe is a unicellular organism commonly used
in the field of eukaryotic cellular and molecular biology. It is genetically tractable and is
often used to examine fundamental cellular processes such as transcription, translation,
cell-cycle control, DNA damage and repair, signaling pathways, and epigenetics (Forsburg,
2005; Hoffman et al., 2015).
The S. pombe genome has been fully sequenced to reveal ~ 5000 protein-coding
genes (ORFs) distributed among three chromosomes (Wood et al., 2002). Among the
proteins encoded by the S. pombe genome, a subset of 172 proteins share close homology
with human disease proteins (Wood et al., 2002). Moreover, the S. pombe laboratory strains
can be diploid or haploid – carrying only a single set of chromosomes (Forsburg and Rhind,
2006). This is crucial in examining genes of interest in disease models, as mutant alleles
can be screened for loss-of-function phenotypes when compared to the wild type alleles
(Hoffman et al., 2015). Altogether, the ease of manipulation and the genomic conservation
of S. pombe makes it a powerful tool to study human disease.
Orthologs of human TSC1 and TSC2 genes have been identified in fission yeast
(named tsc1 and tsc2, respectively) (Serfontein et al., 2011; Sun et al., 2013). In addition,
several components of the mTOR signaling pathway are also conserved in S. pombe
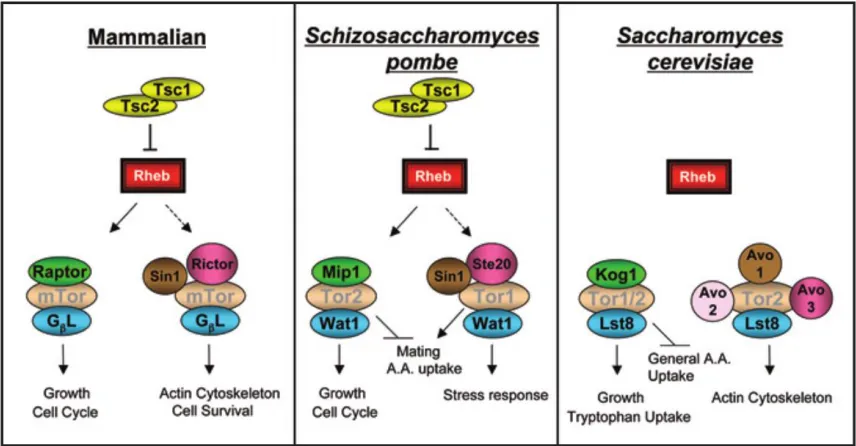
(Figure 1-4) (Aspuria et al., 2007; Wullschleger et al., 2006). Functional Tsc1p and Tsc2p
are crucial in nutrient uptake and the regulation of biosynthetic pathways (Mak and Yeung,
2004). Moreover, the fission yeast Tsc1p-Tsc2p heterodimer regulates a downstream Rheb
protein (ortholog of mammalian Rheb) through its GAP activity (Aspuria et al., 2007). As
8
Figure 1-3: The TSC/Rheb/mTOR signaling pathway is well conserved in S.
pombe. Orthologs of human TSC1 and TSC2, along with several components of the
mTOR signaling pathway is conserved in fission yeast. TSC1 and TSC2 orthologs do
not exist in the budding yeast Saccharomyces cerevisiae. Furthermore, S. pombe Tor2p
forms a complex (with Mip1p and Wat1p) akin to the mammalian mTORC1 to regulate cell cycle and cellular growth. The Tor2p is activated by the upstream Rheb protein which is regulated by the GAP activity of Tsc1p-Tsc2p heterodimer. However, unlike in mammalian cells (Akt phospohorylation of TSC1-TSC2), the upstream regulatory mechanisms of the Tsc1p-Tsc2p complex in fission yeast remain unknown. Proteins with the same color share substantial structural homology across species (i.e.
mammalian Raptor, fission yeastMip1p, and budding yeast Kog1p). Reproduced from
9
(orthologs of mTOR) (Wullschleger et al., 2006). However, in S. pombe, the Tor2p forms
the TOR1 complex which interacts in a mTORC1-like manner to regulate protein
translation, metabolism and nutrient dependent cellular growth and proliferation (Gonzalez
and Rallis, 2017; Matsuo et al.,2007; Rallis et al., 2014). Nonetheless, S. pombe is a great
adjunct in examining the mechanisms of mammalian TOR signaling and, as such, is
important in the understanding of the TSC pathology.
1.4Gene buffering and genetic interactions
Loss-of-function mutations are crucial in contrasting mutant phenotypes with their
respective wild-type phenotypes. In nature, however, these phenotypes are often
quantitative and the mechanisms underlying a disease are multifaceted (Hartman IV et al.,
2001; Horn et al., 2011). Gene buffering is a phenomena which provides robustness against
genetic mutations leading to phenotypic variation and complexity (Kitami and Nadeau,
2002). Classically, gene buffering occurs between genes within the same biological
pathway or in parallel pathways with complementary cellular functions (Hartman IV et al.,
2001). However, genes in ‘redundant’ pathways of unrelated biochemical functions can
also buffer one another (Kitami and Nadeau, 2002).
Unpredicted phenotypic outcomes resulting from gene buffering between genes are
coined as genetic interactions (Costanzo et al., 2011). Recent advances in genome-wide
synthetic genetic array (SGA) analysis have allowed for high-throughput identification of
these interactions (Collins et al., 2007; Costanzo et al., 2010). Furthermore, digenic
(between two genes) interactions can be scored by comparing the fitness of the double
10
(Baryshnikova et al., 2010; Costanzo et al., 2011; Frost et al., 2012). A digenic genetic
interaction is categorized as being either ‘positive’ or ‘negative’ in nature (Baryshnikova
et al., 2010). Positive interactions occur when the observed double mutant fitness is greater
than expected (Costanzo et al.,2011). In contrast, negative interactions occur when double
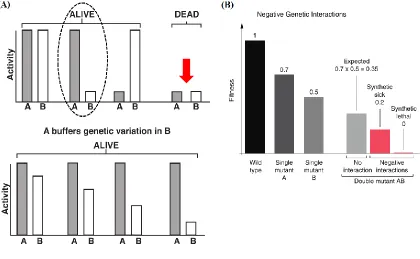
mutant fitness is less than expected (Baryshnikova et al., 2010). Figure 1-5 summarizes the
key concepts of gene buffering.
Included in the set of negative interactions are cases of synthetic lethality/sickness
(Dixon et al., 2008). In these cases, the simultaneous loss of two gene products results in
death or severe growth defects, but the loss of either gene-product individually has little or
no effect (Baryshnikova et al., 2013; Costanzo et al., 2011). In tumor cells, synthetic
growth defects may also arise between genes and small molecules as a mode of drug
discovery; this is because, a typical tumor cell accumulates genetic mutations and
morphological changes, exposing the tumor cell to vulnerabilities that a normal cell would
not face (Nijman, 2011). Thus, protein products of genes that are synthetic lethal to
tumor-forming genetic mutations are ideal candidates for therapeutic targets (Kaelin, 2005).
Hartwell et al. (1997) forged this concept of selectively targeting tumor cells to uncover
prospective anticancer drugs. The group used yeast gene deletion mutants to screen
pharmaceutical inhibitors (Kaelin, 2005). However, technological advances in gene
knockdowns using short interfering RNAs (siRNAs) and short hairpin RNAs (shRNAs),
and CRISPR/Cas9-mediated complete gene knockouts through guide RNAs (gRNAs) have
made it possible to lead high-throughput screens for synthetic lethality across genomes
(Beijersbergen et al., 2017). Figure 1-6 highlights the fundamental strategies used with
11
Figure 1-5: The buffering of genetic variation. (A) Phenotypic variation due to gene A is modulated by gene B, and vice versa. The dotted circle (upper panel) highlights the capacity of gene A to “buffer” variation in gene B. This is to say, in the presence of functional gene A, gene B can accumulate genetic variation without affecting its activity (lower panel). Simultaneous mutations in both genes A and B lead to an abrogation of genetic buffering and a lethal phenotype (red arrow). Modified from Hartman IV et al.
(2001)under the fair use provision of the Canadian Copyright Modernization Act (2012).
(B) Negative genetic interactions arise when the double mutant (AB) fitness/phenotype
12
Figure 1-6: Applying synthetic lethality to cancer therapeutics. (A) Standalone mutations to either gene A or gene B is tolerated (viable phenotype). However, simultaneous mutation of both genes causes lethality. Reproduced from Kaelin W (2005) under the fair use provision of the Canadian Copyright Modernization Act
(2012). (B) The tumor cells have acquired a genetic mutation in gene A. Since gene A
and B are synthetic lethal, inhibition of gene Bor the gene B protein product with an
Anti-B agent (gene knockout or pharmacological inhibitor) will lead to tumor-specific
cell death. Awt = wild-type gene A, and Am = mutant gene A. Reproduced from
13
Fortunately, these strategies have led to the discovery of numerous drug targets across a
variety of cancer models (Beijersbergen et al., 2017; Costa-Cabral et al., 2016; Pourdehnad
et al.,2013).
1.5Genetics to therapeutics: rationale for my study
Inhibition of mTOR signaling with rapamycin has previously shown therapeutic benefits
in treating TSC patients; but, rapamycin-independent pathways are also thought to play a
role in the manifestation of the disorder (Franz and Weiss, 2012; Kenerson et al., 2005).
Furthermore, resistance to rapamycin treatment has been observed in rat models of the
disease (Kenerson et al.,2005; Mak and Yeung 2004). Interestingly, combination therapies
involving rapamycin and secondary drugs have shown potency in limiting tumorigenesis
(Li et al., 2007; Perera et al., 2009). Hence, the identification of alternate ‘drugable’ targets
for novel and/or combination therapies may provide more effective options for the
treatment of the TSC pathology (Neuman and Henske, 2011).
Fortunately, recent advances with respect to genetic buffering have provided novel
avenues of therapeutic exploration. These avenues rely on the creation of genetic
interaction maps, known as genetic interactomes (Costanzo et al., 2011). Genome-wide
interactomes and subsequent analyses in budding yeast, Caenorhabditis elegans, and
mouse fibroblasts, have shown that these interactions can influence a variety of phenotypes
associated with complex genetic phenomenon, including human disorders (Baryshnikova
et al., 2013). Of particular interest to TSC researchers are negative interactor genes that
display synthetic growth defect in conjunction with the TSC1 or TSC2 loss of
14
homozygous tumor cells (bearing two mutant copies of the affected TSC gene) while
leaving phenotypically normal heterozygous cells unaffected (carrying only the mutant
germline copy) (Beijersbergen et al., 2017; Kaelin, 2005). Interestingly, a recent screen for
synthetic growth defects in mammalian cells led to the identification of candidate drug
targets for the TSC pathology (Housden et al., 2015). Therefore, these negative interactors
might represent an “Achilles’ heel” of tumor cells deficient in hamartin/tuberin function
and, therefore, are ideal targets for therapeutic intervention in TSC patients.
Ryan et al. (2012) recently constructed a large-scale genetic interactome for the
fission yeast S. pombe. The group has provided an opportunity to test the idea that genetic
buffering relationships can indeed be exploited to identify novel drug targets. Using the
genetically tractable fission yeast as a model, my study aimed to utilize advances in genetic
interaction biology to elucidate the cellular and molecular mechanisms of TSC
pathogenesis. In brief, a series of experiments were conducted to address the following
areas of interest: (i) the validation of putative negative interactors of fission yeast tsc1 and
tsc2, (ii) the identification of sites within these interactors that may be amenable to
pharmacological inhibition, (iii) investigation of the fission yeast tsc2 alleles bearing
orthologous mutations to clinical TSC patients, and (iv) the conservation of S. pombe
synthetic interactions in mammalian cells. Altogether, my study sought to identify novel
targets for inhibitory drugs, to be used alone (or in combination with rapamycin) to obstruct
15
1.6Hypothesis and predictions
I hypothesize that perturbation of the fission yeast negative interactor genes will alter the
cellular growth of the tsc1Δ and tsc2Δ mutants as well as the tsc2 strains bearing
orthologous clinical mutations (i.e. loss of function mutations). Additionally, I predict that
complete gene deletions of the validated interactors, or the site-directed mutagenesis within
their catalytic sites will result in the impediment of colony growth in tsc1Δ and tsc2Δ
mutant backgrounds. In contrast, I predict that the effect of the mutated interactors in
fission yeast cells lacking loss of function mutations of tsc1 and tsc2 will be negligible.
Moreover, I hypothesize that the synthetic interactions in S. pombe will be
conserved in mammalian cells. I predict that RNAi-mediated knockdowns of target genes
(orthologous to the validated fission yeast negative interactors) in TSC2-deficientmouse
fibroblasts will result in cell-specific lethality. I expect such treatments to reduce cellular
16
CHAPTER II: MATERIALS AND METHODS
2.1Yeast strains and culture conditions
Fission yeaststrains were cultured as indicated in YES, SPA, or EMM media supplemented
with a combination of adenine, histidine, leucine, and uracil (Forsburg and Rhind, 2006).
Gene deletion strains used in the study were obtained from Bioneer Corporation
(https://us.bioneer.com/products/spombe/Library-overview.aspx). Bioneer employs
homologous recombination (HR) to replace an ORF of interest with a deletion cassette
(Kim et al., 2010). The deletion cassettes are comprised of a kanMX4 selection marker,
which confers resistance to the antibiotic, G418, along with flanking tag sequences and
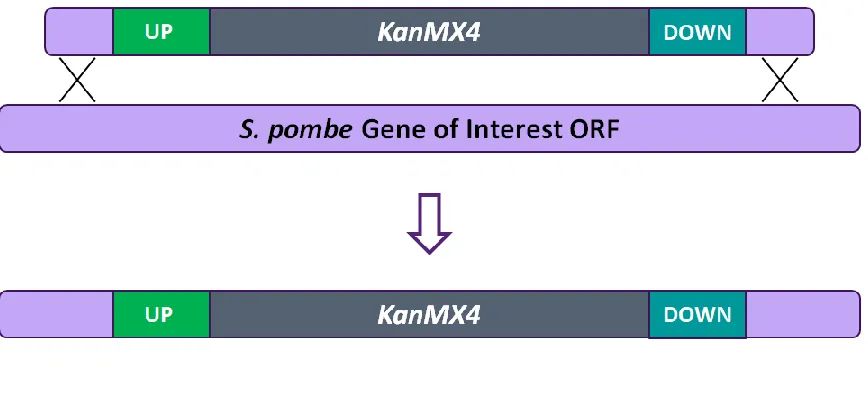
two fragments homologous to the 5’ and 3’ flanking region of the target ORF (Figure 2-1).
Several S. pombe strains bearing site-directed mutations were also constructed. The
relevant DNA sequences bearing the desired mutations were synthesized by GenScript®
and cloned into the S. pombe integration vector, pJK210. The integration constructs were
linearized and then transformed into a wild-type strain using the lithium acetate protocol
(Gietz et al., 1992). Viable colonies in uracil-deprivedEMM-agar media were assessed for
integration at the desired locus through colony PCR (Figure 2-2). The products of the
colony PCR reactions were analyzed on 1% agarose gels made with tris-acetic EDTA
(TAE) buffer and stained with RedSafe™ solution (iNtRON Biotechnology). The
17
Figure 2-1: Methodology used to construct the Bioneer haploid gene deletion
mutant set. Deletion cassettes bearing i) the kanMX4 marker, ii) flanking tag sequences, and iii) sites of homology to the fission yeast gene of interest were integrated
into wild-type S. pombe cells via homologous recombination (Kim et al., 2010).
19
Figure 2-2: Methodology used to generate ypa1 and fft3 mutant strains via
site-directed mutagenesis. The relevant mutant DNA sequences (e.g. to generate the fft3-K418R mutant) were designed and ordered from GenScript®. The synthesized
sequences arrived cloned into the pUC57 vector. (1) The mutant sequence is freed from
the pUC57 vector by restriction digestion (digestion site indicated by vertical grey
lines). (2) The restriction fragment is cloned into the S. pombe integrating vector
pJK210 via enzymatic ligation. (3) The vector is linearized via restriction digestion
(digestion site indicated by a vertical grey line). (4, 5) The linearized vector is
transformed into S. pombe where it integrates at the native locus via homologous
recombination to generate mutant colonies on uracil-deprived EMM media. (6, 7)
Integration at the correct locus is verified by colony PCR (2678 bp amplification).
Vertical red bars represent the site-directed mutation of Lysine418 (K418R). Bright teal
arrows indicate the primer set used to verify fft3-K418R integration into the wild-type
20
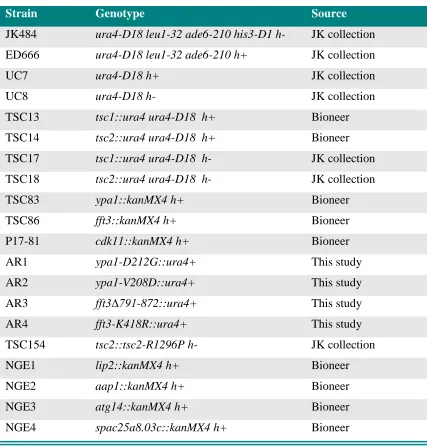
Table 2-1. S. pombe strains used in the study.
Strain Genotype Source
JK484 ura4-D18 leu1-32 ade6-210 his3-D1 h- JK collection
ED666 ura4-D18 leu1-32 ade6-210 h+ JK collection
UC7 ura4-D18 h+ JK collection
UC8 ura4-D18 h- JK collection
TSC13 tsc1::ura4 ura4-D18 h+ Bioneer
TSC14 tsc2::ura4 ura4-D18 h+ Bioneer
TSC17 tsc1::ura4 ura4-D18 h- JK collection
TSC18 tsc2::ura4 ura4-D18 h- JK collection
TSC83 ypa1::kanMX4 h+ Bioneer
TSC86 fft3::kanMX4 h+ Bioneer
P17-81 cdk11::kanMX4 h+ Bioneer
AR1 ypa1-D212G::ura4+ This study
AR2 ypa1-V208D::ura4+ This study
AR3 fft3∆791-872::ura4+ This study
AR4 fft3-K418R::ura4+ This study
TSC154 tsc2::tsc2-R1296P h- JK collection
NGE1 lip2::kanMX4 h+ Bioneer
NGE2 aap1::kanMX4 h+ Bioneer
NGE3 atg14::kanMX4 h+ Bioneer
21
2.2Generation of S. pombe double mutants
Fission yeastdouble mutants were generated using standard genetic techniques (Forsburg
and Rhind, 2006). Briefly, cells of each single mutant strain were mixed on SPA-agar
media and incubated at 30°C as mating process is temperature-sensitive. SPA media is
nitrogen-deprived and induces mating and sporulation, resulting in tetrads, each comprised
of four haploid spores. Once a given cross was plated on a fresh YES-agar plate, a Zeiss
Axioskop 40 microscope was utilized to dissect the individual tetrad. Following a brief
incubation period at 30°C (to break down tetrad walls), the haploid spores were separated.
The individual spores formed colonies within 48 hours and viable double mutants were
isolated on YES-agar plates containing G418 antibiotic and/or EMM media lacking uracil.
2.3Colony growth analysis
The S. pombe double mutant strains were streaked onto YES-agar plates along with the
respective single gene deletion mutants and a wild-type control. Next, the Zeiss Axioskop
40 microscope was utilized to separate individual cells and arrange them across the
YES-agar media (three trials consisting a maximum of four technical replicates from each
strain). The plates were incubated at 30°C for five days to assay colony growth. Images
were taken every 24 hours using an Alpha Innotech Flurochem SP imaging system. Colony
sizes were measured using ImageJ (Abràmoff et al.,2004).
2.4Cell culture and reagents
Tsc2+/+p53-/- (P118) and Tsc2-/-p53-/- (P119) mouse embryonic fibroblasts (MEFs) were
22
Medical School, Boston, MA, USA. These MEFs are connective tissue cells that are
precursors to extracellular matrix and collagen, harvested from mouse embryos age
embryonic day10.5 (E10.5) (Zhang et al., 2003). The p53 knockout (p53-/-) was necessary
to prevent premature senescence of the Tsc2-/- MEFs (Zhang et al., 2003). All cells were
maintained in Dulbecco’s modified Eagle’s medium (DMEM) supplemented with 10%
fetal bovine serum (FBS), 100 IU/mL penicillin, and 100 µg/mL streptomycin (pen-strep).
The cells were grown at 37°C in a humidified atmosphere of 5% CO2 and 95% air up to
70-90% confluency before sub-culturing. P118 and P119 cell cultures were observed and
imaged using an inverted Leica DM IL LED microscope in integrated modulation contrast
(IMC) mode. DMEM and FBS were purchased from Life Technologies. Pen-strep, DPBS,
and TrypLE were obtained from Gibco. Trypan Blue for cell counting was purchased from
Sigma-Aldrich. Falcon T-25 and T-75 animal cell culture flasks were used to passage and
maintain the MEFs.
2.5Genotyping the mouse embryonic fibroblasts
The Tsc2-/- line was previously generated by inserting a neomycin cassette into exon 3 of
the Tsc2 gene (Figure 2-3) (Onda et al., 1999). To confirm the knockout, genomic DNA
(gDNA) was isolated from the P118 and P119 MEFs using DNAzol® (Molecular Research
Centre, Inc.). Subsequent PCR reactions were performed using oligonucleotides H162,
H163, and H164 (Table 2.2). PCR products were analyzed on 1.7% agarose gel made with
23
Figure 2-3: Generation of the Tsc2-/- allele in mouse embryonic fibroblasts. A
neomycin cassette was inserted into exon 3 of the mouse Tsc2 gene (Onda et al., 1999).
This construct disrupted Tsc2 coding sequence (CDS). Coloured arrows represent the
24
2.6Transfections
siGENOME SMARTpool siRNAs targeting Ppp2r4 and Smarcad1 mouse genes were
purchased from Dharmacon™. In addition, a scrambled siRNA targeting no known mouse
gene was also obtained. A working concentration of 10 nM was used for each siRNA for
transfections. All transfections were done using the Lipofectamine® RNAiMAX
transfection reagent (Invitrogen) according to the manufacturer’s protocol. Cells were
grown to 40-60% confluency in media lacking pen-strep. Transfections were then
performed in either 24-well or 96-well plates. Cells were then incubated at 37°C with 5%
CO2 for 48 hours before further assays were performed.
2.7RNA extraction and cDNA synthesis
Cells were transfected with siRNAs in 24-well plates and incubated for 48 hours. Total
RNA was then isolated from transfected cells using TRIzol™ Reagent (Invitrogen)
according to the manufacturer’s protocol. SuperScript™ III First-Strand Synthesis
Supermix for qRT-PCR kit (Invitrogen) was used to generate respective cDNA from 1 µg
of total RNA. Subsequent PCR reactions were performed with AR3F and AR3R, AR4F
and AR4R, or AR5F and AR5R to confirm gene knockdowns (Table 2-2). PCR products
were then analyzed on 1.7% agarose gel made with TAE buffer and stained with SYBR®
Safe (Invitrogen).
25
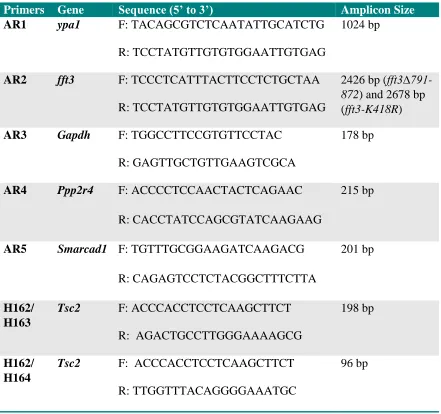
Table 2-2. Oligonucleotides used in the study. Complete forward (F) and reverse (R) primer sequences along with the size of the PCR products are shown.
Primers Gene Sequence (5’ to 3’) Amplicon Size
AR1 ypa1 F: TACAGCGTCTCAATATTGCATCTG
R: TCCTATGTTGTGTGGAATTGTGAG
1024 bp
AR2 fft3 F: TCCCTCATTTACTTCCTCTGCTAA
R: TCCTATGTTGTGTGGAATTGTGAG
2426 bp (
fft3∆791-872) and 2678 bp
(fft3-K418R)
AR3 Gapdh F: TGGCCTTCCGTGTTCCTAC
R: GAGTTGCTGTTGAAGTCGCA
178 bp
AR4 Ppp2r4 F: ACCCCTCCAACTACTCAGAAC
R: CACCTATCCAGCGTATCAAGAAG
215 bp
AR5 Smarcad1 F: TGTTTGCGGAAGATCAAGACG
R: CAGAGTCCTCTACGGCTTTCTTA
201 bp
H162/ H163
Tsc2 F: ACCCACCTCCTCAAGCTTCT
R: AGACTGCCTTGGGAAAAGCG
198 bp
H162/ H164
Tsc2 F: ACCCACCTCCTCAAGCTTCT
R: TTGGTTTACAGGGGAAATGC
26
2.8Cell viability assay
The viability of siRNA-transfected cells was evaluated using the CellTiter-Glo®
Luminescent Cell Viability Assay (Promega). The assay mobilizes ATP in the viable cells
to emit stable luminescent signals that can be measured. The results from the assay
estimates metabolically active cells and can be analyzed to determine differences in cell
viability among various groups. P118 and P119 MEFs were first seeded at 0.25 x 10⁶
cells/mL in 96-well plates (100 µL/well). Cells were then transfected with the relevant
siRNAs within a 24 hours incubation period. After a transfection period of 48 hours, 100
µL of the CellTiter-Glo reagent was directly added to the individual wells. The Infinite
M1000 (Tecan) monochromator based microplate reader was utilized to quantify the
“glow-type” luminescent signals in the 96-well plates.
2.9Data analysis
Pairwise comparisons of colony sizes were performed among the wild-type, single mutant
and the double mutant S. pombe strains. Statistically significant differences were
determined by the non-parametric Wilcoxon Rank Sum test in R v3.2.2 after applying the
Benjamini and Hochberg multiple-testing correction (Benjamini and Hochberg, 1995).
Statistically significant differences between control and siRNA treatment groups in
cell viability assays were determined by the non-parametric Friedman test in GraphPad
Prism v7.0.2 adjusted with the Benjamini and Hochberg multiple-testing correction
(Benjamini and Hochberg, 1995). Graphical illustrations were produced using the
27
CHAPTER III: RESULTS
3.1Validation of candidate negative interactors
Recent high-throughput efforts in S. pombe have resulted in the creation of a genetic
interaction map (http://interactome-cmp.ucsf.edu/pombe2012/modules/search.html; Ryan
et al., 2012). Analysis of this publicly available database revealed a subset of thirteen genes
that are negative interactors of both tsc1 and tsc2. This small group of genes displayed
strong synthetic growth defects (SGA scores of less than -4) when deleted in combination
with tsc1 or tsc2 gene deletions. Of these genes, only ypa1 and fft3 were selected for
validation and detailed analysis as they have clear orthologs in a variety of developmentally
complex eukaryotes, including humans (Costelloe et al., 2012; De Virgilio and Loewith,
2006; Durand-Dubief et al., 2012; Goyal and Simanis, 2012; Neves-Costa et al.,2009).
Interestingly, a genome wide screen in Drosophila spp. also identified the Pitslre gene as
a negative interactor of the fruit fly genes – Tsc1 and Tsc2 (Housden et al., 2015). As this
gene is conserved in humans (known as CDK11) as well as fission yeast (known as cdk11),
it was also included in this study.
Crosses of ypa1∆, fft3∆, and cdk11∆ mutants with either tsc1∆ or tsc2∆ S. pombe
strains were performed to generate the respective double mutants. Colony growth analysis
was then performed to monitor the growth of individual yeast cells over a period of five
days (see Figure 3-1, for an example of ypa1 mutants). Comparisons were made among
cells from the following groups – wild-type S. pombe, single gene deletion mutants, and
28
Figure 3-1: Representative example of YES-agar media plate used in colony
growth analysis. Several S. pombe strains were plated in an YES-agar media plate. Growth was monitored for 5 days. Images were taken at every 24 hours interval. Red
box highlights the tsc1∆ypa1∆ double mutant that exhibits severe growth defect
29
The colony growth analysis revealed that ypa1∆ demonstrated strong synthetic
growth defects with both tsc1∆ and tsc2∆ mutants (Figure 3-2). Although, both tsc1∆ and
ypa1∆ single mutant strains were hindered in their ability to grow, the tsc1∆ypa1∆ double
mutant colony sizes were significantly perturbed (p < 0.0005 at day 5, for all pairwise
comparisons with double mutants; Figure 3-2B). The tsc2∆ypa1∆ double mutants also
followed a similar trend of growth impediment (p < 0.0005 at day 5, for all pairwise
comparisons with double mutants; Figure 3-2D). In addition, fft3∆ mutant demonstrated
strong negative interaction with both tsc1∆ and tsc2∆ mutants (p < 0.0005 at day 5, for all
pairwise comparisons with double mutants; Figure 3-3 B, D). The resultant colony growth
defects of the double mutants (tsc1∆fft3∆ and tsc2∆fft3∆) followed similar growth pattern
to that of the tsc1∆ypa1∆ and tsc2∆ypa1∆ double mutants (Figures 3-2 A, C & 3-3 A, C).
In contrast, the cdk11 gene deletion mutants did not exhibit any clear growth
impediment. The tsc1∆cdk11∆ and tsc2∆cdk11∆ double mutant colonies were significantly
smaller than the wild-type colonies (p < 0.0005 at day 5, for all pairwise comparisons with
double mutants; Figure 3-4 B, D). However, the double mutant colonies demonstrated
similar growth to tsc1∆, tsc2∆, and cdk11∆ single mutants (p > 0.05 at day 5, for all
pairwise comparisons with double mutants; Figure 3-4 A, C). Altogether, ypa1 and fft3
were confirmed as negative interactors of both tsc1 and tsc2. As such, the two fission yeast
genes were carried forward for further detailed analysis.
3.2Additional synthetic interaction screens
Recent work in S. cerevisiae has indicated that negative interactions can be falsely
30
Figure 3-2: tsc1∆ypa1∆ and tsc2∆ypa1∆ double mutants exhibit reduced colony
growth relative to the respective single mutants. (A) Heat map describing average
colony size (arbitrary units) in wild-type, tsc1Δ, ypa1Δ, and tsc1Δypa1Δ mutants over
five days (n = 12, for all groups). (B) Box and whisker plot describing average colony
size (arbitrary units) in wild-type, tsc1Δ, ypa1Δ, and tsc1Δypa1Δ mutants at day 5. (C)
Heat map describing average colony size (arbitrary units) in wild-type, tsc2Δ, ypa1Δ,
and tsc2Δypa1Δ mutants over five days (n = 12, for all groups). (D) Box and whisker
plot describing average colony size (arbitrary units) in wild-type, tsc2Δ, ypa1Δ, and
tsc2Δypa1Δ mutants at day 5. Lower case letters represent significant differences (if
31
Figure 3-3: tsc1∆fft3∆ and tsc2∆fft3∆ double mutants display decreased colony
growth relative to the respective single mutants. (A) Heat map describing average
colony size (arbitrary units) in wild-type, tsc1Δ, fft3Δ, and tsc1Δfft3Δ mutants over five
days (n = 12, for all groups). (B) Box and whisker plot describing average colony size
(arbitrary units) in wild-type, tsc1Δ, fft3Δ, and tsc1Δfft3Δ mutants at day 5. (C) Heat
map describing average colony size (arbitrary units) in wild-type, tsc2Δ, fft3Δ, and
tsc2Δfft3Δ mutants over five days (n = 12, for all groups). (D) Box and whisker plot
describing average colony size (arbitrary units) in wild-type, tsc2Δ, fft3Δ, and tsc2Δfft3Δ
32
Figure 3-4: tsc1∆cdk11∆ and tsc21∆cdk11∆ double mutants do not exhibit differences in
colony growth relative to the respective single mutants. (A) Heat map describing average
colony size (arbitrary units) in wild-type, tsc1Δ, cdk11Δ, and tsc1Δcdk11Δ mutants over five
days (n = 11, 12, 12, and 12, respectively). (B) Box and whisker plot describing average colony
size (arbitrary units) in wild-type, tsc1Δ, cdk11Δ, and tsc1Δcdk11Δ mutants at day 5. (C) Heat
map describing average colony size (arbitrary units) in wild-type, tsc2Δ, cdk11Δ, and
tsc2Δcdk11Δ mutants over five days (n = 12, for all groups). (D) Box and whisker plot
describing average colony size (arbitrary units) in wild-type, tsc2Δ, cdk11Δ, and tsc2Δypa1Δ
33
affect the adjacent genes along a genome leading to improper annotation of negative
interactions (Atias et al., 2015). In fact, NGE is relatively extensive with a ~10% rate,
which can distort large-scale genetic interactomes (Ben-Shitrit et al., 2012). As such,
inappropriate recordings of genetic interactions require correction and subsequent
replacement with new and correct mapping of the relevant interactions. I examined
potential NGE effects on the observed data using the following mutants – lip2∆, aap1∆,
atg14∆, and spac25a8.03c∆. These genes are immediately adjacent to the previously
validated tsc1 and tsc2 negative interactors, ypa1 and fft3. The data demonstrated that the
corresponding double mutants of the adjacent gene deletion mutants do not exhibit any
significant growth defects compared to the single mutants (p > 0.05 at day 5, for all pairwise
comparisons with double mutants; Figure 3-5 & 3-6). These results provide strong evidence
that the synthetic interactions mapped in this study are not influenced by NGEs.
3.3Identification of catalytic sites within the interactors
The determination of specific functional domains within Ypa1p and Fft3p can help identify
sites that may be amenable to pharmacological inhibitors. Based on current literature and
bioinformatic analyses, three domains were identified – one within the Ypa1p (PPIase
domain) (Jordens et al.,2006; Jouvet et al.,2011; Leulliot et al.,2006), and two within the
Fft3p(ATPase domain and helicase domain) (Byeon et al., 2013; Chen et al.,2012; Eapen
et al.,2012; Steglich et al.,2015). An online based multi-alignment tool, Clustal Omega
(Sievers et al., 2011), was used to verify the conservation of these putative sites across
several eukaryotes (Figure 3-7). Using this information, several integration constructs were
34
A
B
C
D
E
F
35
Figure 3-5: Double mutants of lip2∆ and aap1∆ (adjacent to ypa1) do not exhibit
colony growth defects relative to the respective single mutants. (A, C) Heat map
describing average colony size (arbitrary units) in wild-type, tsc1Δ, tsc2Δ, lip2Δ,
tsc1Δlip2Δ, and tsc2Δlip2Δ mutants over five days (n = 12, 11, 12, 12, 11, and 11,
respectively). (B, D) Box and whisker plot describing average colony size (arbitrary
units) in wild-type, tsc1Δ, tsc2Δ, lip2Δ, tsc1Δlip2Δ, and tsc2Δlip2Δ mutants at day 5.
(E, G) Heat map describing average colony size (arbitrary units) in wild-type, tsc1Δ, tsc2Δ, aap1Δ, tsc1Δaap1Δ, and tsc2Δaap1Δ mutants over five days (n = 12, 12, 12, 12,
10, and 12, respectively). (F, H) Box and whisker plot describing average colony size
(arbitrary units) in wild-type, tsc1Δ, tsc2Δ, aap1Δ, tsc1Δaap1Δ, and tsc2Δaap1Δ
36
A
B
C
D
E
F
37
Figure 3-6: Double mutants of atg14∆ and spac25a8.03c∆ (adjacent to fft3) do not
exhibit colony growth defects relative to the respective single mutants. (A, C) Heat
map describing average colony size (arbitrary units) in wild-type, tsc1Δ, tsc2Δ, atg14Δ,
tsc1Δatg14Δ, and tsc2Δatg14Δ mutants over five days (n = 12, 11, 12, 11, 8, and 11,
respectively). (B, D) Box and whisker plot describing average colony size (arbitrary
units) in wild-type, tsc1Δ, tsc2Δ, atg14Δ, tsc1Δatg14Δ, and tsc2Δatg14Δ mutants at day
5. (E, G) Heat map describing average colony size (arbitrary units) in wild-type, tsc1Δ, tsc2Δ, spac25a8.03cΔ, tsc1Δspac25a8.03cΔ, and tsc2Δspac25a8.03cΔ mutants over
five days (n = 12, 11, 12, 11, 12, and 12, respectively). (F, H) Box and whisker plot
describing average colony size (arbitrary units) in wild-type, tsc1Δ, tsc2Δ,
38
Figure 3-7: Multiple sequence alignments comparing Ypa1p and Fft3p to their
human and mouse orthologs. A Highly conserved PPIase domain is present within Ypa1p (purple box). The Fft3p contains a highly conserved ATPase domain (purple arrow) and a helicase domain (*not shown). The pink letter boxes denote the
site-directed mutagenesis of fission yeast strains performed in this study. Sp,
39
fft3Δ791-874 (see Materials and Methods). The mutant strains were then crossed to either
tsc1∆ or tsc2∆ strains to generate the respective double mutants.
The ypa1 site-directed double mutants (tsc1∆ypa1-D212G, tsc2∆ypa1-D212G,
tsc1∆ypa1-V208D, and tsc2∆ypa1-V208D) did not show any significant differences in
colony growth compared to their respective tsc1∆ and tsc2∆ mutant strains (p > 0.05 for
all pairwise comparisons at day 5; Figure 3-8 & Figure 3-9). Likewise, the helicase-deleted
fft3 double mutants also followed the growth trends of the tsc1∆ and tsc2∆ mutants (p >
0.05 for the pairwise comparisons at day 5; Figure 3-10). In contrast, fft3-K418R double
mutants did show a significant impediment in colony growth compared to the wild-type
and respective single mutant strains (p < 0.05 for all pairwise comparisons at day 5; Figure
3-11). However, the synthetic growth defects witnessed in these double mutants were not
as prominent as the growth defects previously seen in the fft3∆ double mutants.
Nonetheless, the result suggest that the ATPase domain within the Fft3p may be
pharmacologically targeted in cells with loss of function mutations in tsc1 and tsc2.
3.4Assaying clinically orthologous mutations in S. pombe
As part of an ongoing project in the lab, strains expressing tsc2 alleles bearing mutations
orthologous to those found clinically have been created (G296E, R927W, N1191K,
N1199S, P1223L, R1296P) (Figure 3-12). These tsc2 alleles were examined to screen any
negative interactions with fft3 and ypa1. Of the six mentioned tsc2 mutants, only
tsc2-R1296P mutants were found to negatively interact with both ypa1 and fft3 (p < 0.05 for all
double mutant pairwise comparisons at day 5; Figure 3-13 A to D; data not shown for the
40
A
B
`
C
D
Figure 3-8: tsc1∆ypa1-D212G and tsc2∆ypa1-D212G double mutants do not exhibit
reduced colony growth relative to the respective single mutants. (A) Heat map
describing average colony size (arbitrary units) in wild-type, tsc1Δ, ypa1-D212G, and
tsc1Δypa1-D212G mutants over five days (n = 12, 12, 11, and 12, respectively). (B)
Box and whisker plot describing average colony size (arbitrary units) in wild-type, tsc1Δ, ypa1-D212G, and tsc1Δypa1-D212G mutants at day 5. (C) Heat map describing
average colony size (arbitrary units) in wild-type, tsc2Δ, ypa1-D212G, and
tsc2Δypa1-D212G mutants over five days (n = 12, 12, 12, and 11, respectively). (D) Box and
whisker plot describing average colony size (arbitrary units) in wild-type, tsc2Δ,
41
A
B
C
D
Figure 3-9: tsc1∆ypa1-V208D and tsc2∆ypa1-V208D double mutants do not exhibit
reduced colony growth relative to the respective single mutants. (A) Heat map
describing average colony size (arbitrary units) in wild-type, tsc1Δ, ypa1-V208D, and
tsc1Δypa1-V208D mutants over five days (n = 11, 12, 12, and 11, respectively). (B)
Box and whisker plot describing average colony size (arbitrary units) in wild-type, tsc1Δ, ypa1-V208D, and tsc1Δypa1-V208D mutants at day 5. (C) Heat map describing
average colony size (arbitrary units) in wild-type, tsc2Δ, ypa1-V208D, and
tsc2Δypa1-V208D mutants over five days (n = 12, 12, 10, and 11, respectively). (D) Box and
whisker plot describing average colony size (arbitrary units) in wild-type, tsc2Δ,
42
A
B
C
D
Figure 3-10: tsc1∆fft3∆791-872 and tsc2∆fft3∆791-872 double mutants do not
exhibit reduced colony growth relative to the respective single mutants. (A) Heat
map describing average colony size (arbitrary units) in wild-type, tsc1Δ, fft3∆791-872
and tsc1Δfft3∆791-872 mutants over five days (n = 12, 12, 12, and 11, respectively).
(B) Box and whisker plot describing average colony size (arbitrary units) in wild-type,
tsc1Δ, fft3∆791-872, and tsc1Δfft3∆791-872 mutants at day 5. (C) Heat map describing
average colony size (arbitrary units) in wild-type, tsc2Δ, fft3∆791-872, and
tsc2Δfft3∆791-872 mutants over five days (n = 12, for all groups). (D) Box and whisker
plot describing average colony size (arbitrary units) in wild-type, tsc2Δ, fft3∆791-872,
43
A
B
C
D
Figure 3-11: tsc1∆fft3-K418R and tsc2∆fft3-K418R double mutants demonstrate
reduced colony growth relative to the respective single mutants. (A) Heat map
describing average colony size (arbitrary units) in wild-type, tsc1Δ, fft3-K418R, and
tsc1Δfft3-K418R mutants over five days (n = 12, 11, 12, and 11, respectively). (B) Box
and whisker plot describing average colony size (arbitrary units) in wild-type, tsc1Δ,
fft3-K418R, and tsc1Δfft3-K418R mutants at day 5. (C) Heat map describing average
colony size (arbitrary units) in wild-type, tsc2Δ, fft3-K418R, and tsc2Δfft3-K418R
mutants over five days (n = 12, 11, 12, and 12, respectively). (D) Box and whisker plot
describing average colony size (arbitrary units) in wild-type, tsc2Δ, fft3-K418R, and
tsc2Δfft3-K418R mutants at day 5. Lower case letters represent significant differences
44
Figure 3-12: Clustal Omega alignment of human TSC2 and fission yeast Tsc2p.
Colored bars indicate domains of the human TSC2 protein that are conserved in S.
pombe Tsc2p. Pink labelled boxes indicate fission yeast Tsc2p mutations that are
orthologous to the corresponding disease-causing human TSC2 alleles. Sp,
45
and tsc2-R1296P fft3∆ double mutants were highly comparable to those of the tsc2∆ypa1∆
and tsc2∆fft3∆ double mutants (Figure 3-13 E, F). Thus, the observed interactions between
tsc2 and ypa1 or fft3 are indeed allele specific. This demonstrates that the loss of fft3 or
ypa1 activity is not necessarily detrimental to growth in all cells exhibiting deficiencies in
hamartin or tuberin function. Instead, the results imply that the genetic interactions depend
on the subtleties of Tsc1p/Tsc2p molecular function in an allele specific manner (see
Discussion).
3.5Genotyping the mouse embryonic cell lines
The validated interactors from the initial screen in S. pombe have clear orthologs in
organisms ranging from yeast to humans. Thus, Ppp2r4 (ortholog of ypa1) and Smarcad1
(ortholog of fft3) were tested to see if the negative interactions were conserved in more
developmentally complex eukaryotes. To this end, Tsc2+/+p53-/- and Tsc2-/-p53-/- mouse
embryonic fibroblasts (MEFs) were obtained from Dr. DJ Kwiatkowski (Onda et al., 1999).
After the initial thawing process, the P118 (Tsc2+/+p53-/-) and P119 (Tsc2-/-p53-/-)
MEFs were sub-cultured twice before genotyping. Cells show typical fibroblastic
morphology (Figure 3-14 A, B) as reported earlier (Onda et al., 1999). For each type of
cells, gDNA was isolated and two simultaneous PCR reactions were performed using one
of either H163 (within exon 3 of Tsc2) or H164 primers (within the neomycin cassette
insert) in combination with the H162 primer (within exon 3 of Tsc2). Results show an
expected 198 base pairs (bp) PCR amplificon for the P118 MEFs (PCR product of
H163/H162), with no PCR product from H164/H162 (Figure 3-14 C). In contrast, there
46
A
B
C
D
47
Figure 3-13: tsc2-R1296P ypa1∆ and tsc2-R1296P fft3∆ double mutants
demonstrate reduced colony growth relative to the respective single mutants. (A)
Heat map describing average colony size (arbitrary units) in wild-type, tsc2-R1296P,
ypa1∆, and tsc2-R1296P ypa1∆ mutants over five days (n = 8, 8, 8, and 6, respectively).
(B) Box and whisker plot describing average colony size (arbitrary units) in wild-type,
tsc2-R1296P, ypa1∆, and tsc2-R1296P ypa1∆ mutants at day 5. (C) Heat map
describing average colony size (arbitrary units) in wild-type, tsc2-R1296P, fft3∆, and
tsc2-R1296P fft3∆ mutants over five days (n = 10, for all groups). (D) Box and whisker
plot describing average colony size (arbitrary units) in wild-type, tsc2-R1296P, fft3∆,
and tsc2-R1296P fft3∆ mutants at day 5. (E) tsc2-R1296P ypa1∆ and tsc2∆ypa1∆
double mutants suffer from similar growth perturbations. (F) tsc2-R1296P fft3∆ and
48
Figure 3-14: Genotyping of the P118 and P119 MEF cell lines. (A) Microscopic view of the P118 MEFs at passage 2, objective 20X, scale bar – 100 µm (light
microscopy). (B) Microscopic view of the P119 MEFs at passage 3, objective 20X,
scale bar – 100 µm (light microscopy). (C) The indicated primers (combination of
H162, H163, and H164) were used to PCR amplify genomic DNA from P118 and P119 cells. The resulting amplicons were run on a 1.7% agarose gel to confirm the presence/absence of the neomycin cassette.