I
MPLICATIONS FOR TISSUE ENGINEERING AND CANCER METASTASISThesis by Melissa Davis Pope
In partial fulfillment of the requirements For the degree of
Doctor of Philosophy
C
ALIFORNIAI
NSTITUTE OFT
ECHNOLOGY Pasadena, CA2010
© 2010 Melissa Davis Pope
I would first like to express much gratitude to my research advisor, Anand Asthagiri. Anand is full of genuine excitement about the work undertaken in our laboratory. His unfailing zeal for scientific discovery and the precision and persistence with which he pursues it has not only provided a wonderful model, but in addition, has provided me much encouragement, especially at times when my own enthusiasm temporarily waned. Anand has taught me a great deal and I am very happy and grateful to have been his student.
I would also like to thank my labmates – Nicholas Graham, Claudiu Giurumescu, Stephen Chapman, Keiichiro Kushiro, Jin-Hong Kim, Paul Minor and Larry Dooling – for daily lunches, many birthday cakes, and the occasional bit of harmless gossip around our “conference” table. And, of course, for all of those helpful science-related conferences as well. It’s been an absolute pleasure to have spent these past years with you. In addition, I am grateful to my two SURF students – Beijing “Kara” Huang and Duc-Huy Tran Nguyen – for their curiosity, enthusiasm and hard work. It was a joy to work with you as well.
thesis – I think he’ll be as pleased as me on the day I turn it in. Because of sharing these past years with Brian, life outside of Caltech has been happy, fun and exciting. In fact, we recently welcomed a new member into our family. Our son, Jackson, with his boundless energy, great curiosity and bright smile has brought such joy into our lives. I am blessed to be Brian’s wife and Jackson’s mommy and I love them with all my heart.
I am deeply indebted to my wonderful parents, Ian Davis and Pamela Davis Kotzin, who have been endlessly enthusiastic through all of my endeavors. It is due to their love and encouragement that I have found much happiness and fulfillment in my life. A special thank you to my mom for spending many of her days caring for Jackson while I finished my thesis. And a special thank you to my dad for getting me started on the whole “science” thing in the first place – I think you would have gotten a kick out of “Melissa, Ph.D.”
I am also grateful to my mother-in-law, Judith Pope, who made several trips from Pennsylvania to live with us and care for Jackson while I finished my thesis. She cared for Jackson (and for Brian and me) with much energy and love. Much thanks too to my father-in-law, Robert Pope, for parting with his beloved Judy for so many weeks.
D
YNAMICS OFM
ULTICELLULARA
GGREGATION ANDD
ISAGGREGATION:
IMPLICATIONS FOR TISSUE ENGINEERING AND CANCER METASTASIS
May 2010
Melissa Davis Pope
B.S., Chemical Engineering, University of California, Irvine Ph.D., Bioengineering, California Institute of Technology
Multicellular aggregation is reversible. In fact, the break-up of multicellular clusters (“cell scatter”) is not only important for developmental processes, but also contributes to metastasis. However, current molecular genetics studies of cell scatter are predominantly qualitative and do not provide a quantitative assessment of the relative strengths of molecular signals in inducing cell scatter. By developing and implementing an automated image processing algorithm, we quantify two aspects of cell scatter – the breakdown of cell-cell adhesions and the dispersion of detached cells – in mammary epithelial cells treated with different combinations of biochemical cues (Chapter III). We demonstrate that our metrics of cell scatter identify the effects of individual cues and detect synergies between them. We envision that this approach will be useful for mapping the relative potencies of regulators of cell scatter and may guide therapeutic strategies.
Acknowledgements………iii
Abstract………v
Table of Contents………...vii
List of Tables………...x
List of Figures……….xi
Chapter I. Introduction 1. Introduction... 1
2. Adherens junctions mediate strong cell-cell adhesion... 2
3. Focal adhesions assemble at sites of cell-matrix adhesion ... 3
4. Cell migration on the extracellular matrix ... 3
5. Current results... 4
6. References... 8
Chapter II. Short-lived cell-cell interactions foster transport-limited cell aggregation: biphasic dependence of aggregation dynamics on substratum adhesivity 1. Abstract... 10
2. Main Text... 11
3. Acknowledgements... 18
4. Materials and Methods... 19
4.1. Substratum preparation ... 19
4.2. Cell culture... 19
4.3. Quantification of cell-cell adhesion dynamics... 19
4.4. Quantification of migration speeds... 20
4.5. Quantification of aggregate size ... 20
5. Supplemental Methods... 22
6. Supplemental Data ... 24
Chapter III. Automated Quantitative Analysis of Epithelial Cell Scatter
1. Abstract... 35
2. Introduction... 37
3. Results... 39
3.1. EGF regulates MCF-10A scatter ... 39
3.2. Quantitative metrics of cell scatter ... 40
3.3. The distribution of cluster sizes is differentially altered by EGF-containing media... 41
3.4. The distribution of nearest-neighbor distances is differentially altered by EGF-containing media... 44
3.5. Automated image processing... 45
4. Discussion... 50
5. Materials and Methods... 54
5.1. Cell culture... 54
5.2. Plasmid Constructs... 54
5.3. Retroviral Infection... 54
5.4. Cell scatter assay... 55
5.5. Live cell microcopy ... 55
6. Supplemental Data ... 56
7. References... 58
Chapter IV. A microtiter assay for quantifying protein-protein interactions associated with cell-cell adhesion 1. Abstract... 61
2. Introduction... 63
3. Results and Discussion ... 65
3.1. Development and validation of a quantitative microtiter ELISA for E-cadherin:β-catenin protein complexes ... 65
3.2. Compatibility of the protein complex ELISA with standard sandwich ELISAs71 3.3. Quantitative comparison of E-cadherin:β-catenin interactions in transformed versus non-transformed cells ... 73
5. Acknowledgements... 82
6. Materials and Methods... 83
6.1. Cell Culture... 83
6.2. Cell Lysis ... 83
6.3. Protein complex and standard ELISAs ... 84
6.4. Validation of protein capture by Western blotting ... 85
6.5. Plasmid Constructs... 86
6.6. Retroviral Infection... 86
6.7. Data Analysis and Statistical Calculations ... 86
7. Supplemental Data ... 88
L
IST OFT
ABLESTable II-1. Initial density of substratum-attached cells. ... 29
Table II-2. Incubation times for Ln-coated substrata. ... 30
Table II-3. Cell seeding concentrations for Ln-coated substrata. ... 31
Figure I-1. Generalized structure of adherens junctions... 2
Figure I-2. Generalized structure of focal adhesions. ... 3
Figure I-3. Steps in cell migration. ... 4
Figure II-1. Two-step model for multicellular aggregation dynamics... 12
Figure II-2. The dependence of timescales of local cell-cell reactivity (tadhesion) and transport (tmotility) on substratum adhesivity... 14
Figure II-3. Biphasic dependence of aggregate size on substratum adhesivity: evidence for motility-limited aggregation dynamics. ... 17
Figure II-4. Effect of antibody treatments on the lifetime of cell-cell interactions. ... 24
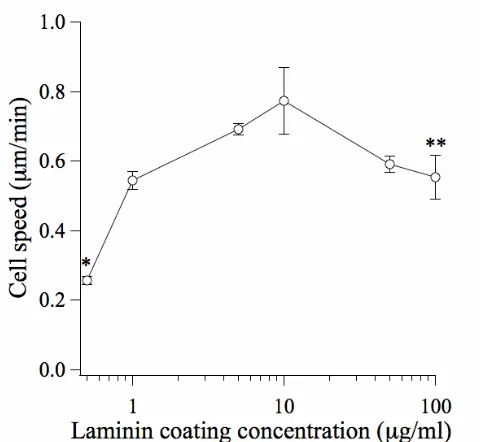
Figure II-5. Cell speed exhibits a biphasic dependence on surface adhesivity... 25
Figure II-6. Time-course of aggregate assembly. ... 26
Figure II-7. Substratum adhesivity affects the rate of cell attachment to the substratum... 27
Figure II-8. Substratum adhesivity affects the fraction of seeded cells that attach. ... 28
Figure III-1. EGF is a key regulator of epithelial cell scatter. ... 40
Figure III-2. Distribution of cluster sizes for scattering cells. ... 43
Figure III-3. Distribution of nearest-neighbor distances for scattering cells. ... 45
Figure III-4. Automated image processing using MATLAB... 47
Figure III-5. Comparison of manual and automated techniques... 49
Figure III-7. Phase contrast images of MCF-10A cell aggregates treated with EGF + CT
+ insulin. ... 57 Figure IV-1. Antigen capture and protein:protein co-capture. ... 67 Figure IV-2. Detection of E-cadherin:β-catenin protein complexes by protein complex
ELISA. ... 68 Figure IV-3. Specificity test for E-cadherin:β-catenin ELISA... 71 Figure IV-4. Detection of E-cadherin and β-catenin total protein levels by sandwich
ELISA. ... 73 Figure IV-5. Quantitative comparison of the levels of E-cadherin:β-catenin complexes,
E-cadherin and β-catenin expression in normal and tumorigenic cell lines. ... 75 Figure IV-6. Quantifying the effect of constitutively-active Src on cellular levels of
E-cadherin:β-catenin complexes and the expression of E-cadherin and β-catenin... 79 Figure IV-7. Quantification of E-cadherin, β-catenin, and E-cadherin:β-catenin
complexes in normal and tumorigenic cell lines... 88 Figure IV-8. Quantifying the effect of constitutively-active Src on cellular levels of
1. Introduction
The assembly of migratory cells into a cohesive group is a key facet of embryonic tissue development. Multicellular condensation occurs in the initial stages of chondrogenesis (cartilage formation), for example, and is believed to be a prerequisite for chondrogenic differentiation.1 In addition, migrating neural crest cells are observed to condense into sub-populations en route to distant embryonic sites. This is thought to facilitate the immobilization of these cells to form solid tissues.2
In addition to multicellular aggregation, the dissociation of single cells from condensed tissue can also play a key role in tissue development. Kidney development, for example, is characterized by repeated cycles of condensation and dissociation.3-5 In addition, delamination of endothelial cells from the embryonic atrioventricular canal gives rise to a cell population that eventually forms the heart valves.6 Cellular dissociation also plays a role in tumorigenesis. In this context, metastatic cells delaminate from the tumor mass and migrate to secondary sites, thereby initiating the lethal phase of cancer progression.7
characterized by the gain (MET) or loss (EMT) of epithelial characteristics such as the expression of cell-cell adhesion receptors. Condensation and dissociation also involve cellular processes, such as cell-cell adhesion, cell-matrix adhesion and cell migration on the extracellular matrix.
2. Adherens junctions mediate strong cell-cell adhesion
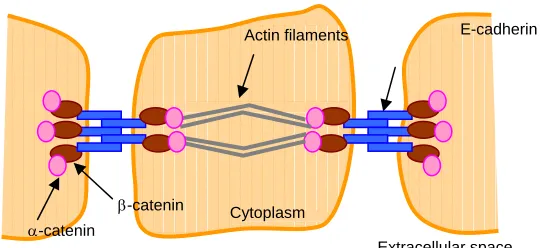
In epithelial tissues, E-cadherin-containing adherens junctions are important mediators of cell-cell adhesion.9 E-cadherin is a transmembrane protein, the extracellular domain of which homotypically binds E-cadherin molecules on adjacent cells.10 The intracellular tail connects to the actin cytoskeleton via protein:protein interactions involving α-catenin, β-catenin, vinculin and many other proteins. In this manner, adherens junctions link the actin cytoskeleton of contacting cells, creating an “actin belt” that imparts structural strength to a multicellular aggregate (Figure I-1).
Figure I-1. Generalized structure of adherens junctions.
E-cadherin molecules span the plasma membrane to bind E-cadherin molecules on neighboring cells. E-cadherin’s cytoplasmic tail interacts with β-catenin and α-catenin, forming a connection to the actin cytoskeleton.
Cytoplasm Actin filaments
β-catenin
α-catenin
Cells use many adhesion receptors to attach to the extracellular matrix, the most prominent being the integrin family of transmembrane receptors. Integrin extracellular domains recognize a protein component of the extracellular matrix, while the intracellular domain interacts with numerous anchor proteins to form signaling-rich complexes called focal adhesions.11 These anchor proteins, which include talin, α-actinin and vinculin, tether integrins to the actin cytoskeleton and enable cell-generated contractile forces to be transmitted onto the underlying substratum, generating the driving force needed for cell migration (Figure I-2).12
Figure I-2. Generalized structure of focal adhesions.
Integrin transmembrane receptors bind to extracellular matrix ligands. Integrin cytoplasmic tails bind to multiple anchor proteins, which tether integrins to the actin cytoskeleton to mediate strong cell-substratum adhesion.
4. Cell migration on the extracellular matrix
Cell migration is a cyclic process. A cell first extends membrane protrusions – spike-like filopodia and broad lamellopodia – in the direction of movement. These
Extracellular matrix ligand
Integrin receptor Cytoplasm
Actin filaments
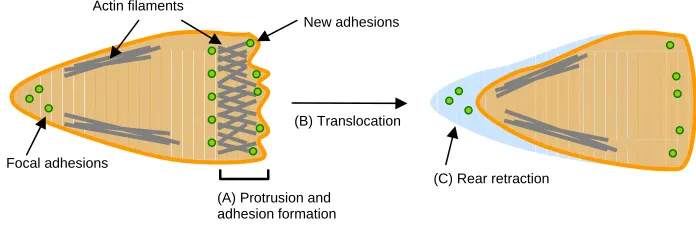
protrusions are driven by actin polymerization and stabilized by the assembly of focal adhesions beneath them. Focal adhesions provide the traction necessary to translocate the cell body forward, and are subsequently disassembled at the cell rear to allow the trailing edge to detach from the substratum (Figure I-3).12 Because migrating cells must be able to exert traction yet readily detach, cell speed exhibits a biphasic dependence on substratum adhesivity – a weakly adhesive substratum facilitates little traction while a strongly adhesive substratum inhibits detachment.13
Figure I-3. Steps in cell migration.
(A) Actin polymerization drives membrane protrusions at the leading end of the cell, where new cell-substratum adhesions are formed. (B) These newly-formed adhesions provide the traction necessary to translocate the cell body forward. (C) Adhesions are disassembled at the trailing end of the cell to allow cell detachment from the substratum. Adapted from Ridley et al. Science (2003).
5. Current results
To better understand the roles of cell-cell interactions, cell-matrix adhesions and cell migration in condensation and dissociation, we utilize in vitro aggregation and scatter assays that mimic these in vivo phenomena. Epithelial cells cultured on adhesive substrata self-assemble into 2D multicellular clusters (“aggregation”). In response to
(B) Translocation
(C) Rear retraction Focal adhesions
New adhesions
Aggregation and scatter are widely used model systems in which to study condensation and dissociation events. In fact, the current understanding of the complex biochemical network regulating EMT comes largely from studies of cell scatter.8
The classical paradigm describing multicellular aggregation asserts that the equilibrium state of aggregation is determined by differential cell adhesivity to neighboring cells versus the underlying substratum.14-16 Because organ formation is a multi-step process, in vivo aggregation events must occur within specific time constraints. Therefore, aggregation dynamics are likely to be important. We assert that because cells must first “find” a neighbor (a transport step) before forming cell-cell contacts, aggregation dynamics may follow a transport-reaction model ascribed widely to physiochemical systems.17, 18 In Chapter II, we present quantitative studies of aggregation dynamics that probe this possibility. Using timelapse microscopy, we tracked collisions between migrating cell pairs and quantified the lifetimes of cell-cell interactions (tadhesion). Based on the initial density of seeded cells and quantitative
measurements of cell speed, we also determined the mean time between cell-cell collisions (tmotility). We find that tmotility is greater than tadhesion across a range of adhesive
cellular motility in aggregation dynamics. Our study provides insight into a developmental phenomenon and design principles useful for facilitating multicellular aggregation in tissue engineering contexts.
Because of the physiological and clinical significance of dissociation events, much effort has been made to identify the molecular signals that control cell scatter. Advancements are being made in cataloging the signaling pathways involved; however because current studies of cell scatter are largely qualitative, an emerging challenge is to understand the quantitative contributions of these signals and any coupling between them. In Chapter III, we have therefore developed novel quantitative metrics to systematically characterize cell scatter. Our metrics capture two aspects of scatter – the break-down of cell-cell contacts and cellular dispersion. In mammary epithelial cells treated with stimulatory cocktails containing epidermal growth factor (EGF), we demonstrate that our metrics delineate the effects of individual molecular signals and detect synergies between them. To facilitate the rapid extraction of our metrics from fluorescence images of scattering cells, we have also developed automated image processing techniques using MATLAB. We envision that these metrics coupled with our automated image processing techniques will facilitate quantitative mapping of the biochemical cues governing scatter as well as high throughput screening of cancer therapeutics.
of their integrity. To complement our imaging-based studies at the cellular and multicellular levels, we have developed a quantitative microtiter assay for determining the amount β-catenin bound to E-cadherin in cultured cells (Chapter IV). In two case studies closely related to cancer cell biology, we demonstrate that our assay can provide a more detailed picture of molecular dynamics within adherens junctions, which will provide added insight into aggregation and scatter.
6. References
1. Oberlender SA, Tuan RS. Expression and functional involvement of N-cadherin in embryonic limb chondrogenesis. Development (Cambridge, England) 1994; 120:177-87.
2. Nakagawa S, Takeichi M. Neural crest cell-cell adhesion controlled by sequential and subpopulation-specific expression of novel cadherins. Development (Cambridge, England) 1995; 121:1321-32.
3. Davies JA. Mesenchyme to epithelium transition during development of the mammalian kidney tubule. Acta anatomica 1996; 156:187-201.
4. Dressler G. Tubulogenesis in the developing mammalian kidney. Trends in cell biology 2002; 12:390-5.
5. Hay ED, Zuk A. Transformations between epithelium and mesenchyme: normal, pathological, and experimentally induced. Am J Kidney Dis 1995; 26:678-90. 6. Mercado-Pimentel ME, Runyan RB. Multiple transforming growth factor-beta
isoforms and receptors function during epithelial-mesenchymal cell transformation in the embryonic heart. Cells, tissues, organs 2007; 185:146-56. 7. Thiery JP. Epithelial-mesenchymal transitions in tumour progression. Nat Rev
Cancer 2002; 2:442-54.
8. Thiery JP, Sleeman JP. Complex networks orchestrate epithelial-mesenchymal transitions. Nature reviews 2006; 7:131-42.
connections to the actin cytoskeleton. Biochimica et biophysica acta 2008; 1778:660-9.
11. Critchley DR. Focal adhesions - the cytoskeletal connection. Current opinion in cell biology 2000; 12:133-9.
12. Ridley AJ, Schwartz MA, Burridge K, Firtel RA, Ginsberg MH, Borisy G, Parsons JT, Horwitz AR. Cell migration: integrating signals from front to back. Science (New York, NY 2003; 302:1704-9.
13. Palecek SP, Loftus JC, Ginsberg MH, Lauffenburger DA, Horwitz AF. Integrin-ligand binding properties govern cell migration speed through cell-substratum adhesiveness. Nature 1997; 385:537-40.
14. Steinberg MS. On Mechanism of Tissue Reconstruction by Dissociated Cells .3. Free Energy Relations and Reorganization of Fused, Heteronomic Tissue Fragments. P Natl Acad Sci USA 1962; 48:1769-&.
15. Steinberg MS. Differential adhesion in morphogenesis: a modern view. Current opinion in genetics & development 2007; 17:281-6.
16. Steinberg MS, Foty RA. Intercellular adhesions as determinants of tissue assembly and malignant invasion. Journal of cellular physiology 1997; 173:135-9. 17. Lin MY, Lindsay HM, Weitz DA, Ball RC, Klein R, Meakin P. Universality in
Colloid Aggregation. Nature 1989; 339:360-2.
Chapter II.
S
HORT-
LIVED CELL-
CELL INTERACTIONS FOSTERTRANSPORT
-
LIMITED CELL AGGREGATION:
BIPHASICDEPENDENCE OF AGGREGATION DYNAMICS ON SUBSTRATUM ADHESIVITY
1. Abstract
Multicellular aggregation is fundamental to development and tissue repair.1-3 The classical equilibrium model for multicellular aggregation is based on differential cell adhesivity to its neighbors versus the underlying substratum.4-6 In many biological contexts, however, dynamics is critical. Here, we demonstrate that multicellular aggregation dynamics involves both local adhesive interactions and transport by cell migration. Quantitative measurements by time-lapse video microscopy reveal that the lifetime of cell-cell interactions is shorter than the mean time between cell-cell collisions, suggesting aggregation may be transport-limited. Consistent with this hypothesis, the transient aggregate size exhibits a biphasic dependence on substratum adhesivity, matching independent measurements of the trend in cell migration speed. These results demonstrate that cell aggregation adheres to a transport-reaction model ascribed widely to physicochemical systems.7, 8 Our findings have implications for the role of cell motility during developmental aggregation processes and provide design principles for tuning aggregation dynamics in applications such as tissue engineering.
Multicellular aggregation is fundamental to embryonic development and tissue repair,1-3 and the loss of aggregate integrity is associated with pathologies such as metastasis.9 The classical paradigm is that the equilibrium state of aggregation is determined by minimizing the adhesive free energy of the system.4-6 This model predicts that if the cumulative strength of cell-cell adhesion (as quantified by the number and affinity of receptor-ligand bonds) exceeds the strength of cell-substratum adhesion, cells will organize into aggregates. Conversely, if the strength of cell-substratum adhesion exceeds the strength of cell-cell adhesion, cells will adopt a dispersed phenotype. This monotonic relationship between aggregation and substratum adhesivity has been demonstrated experimentally.10 When cells of equal cohesivity are employed, those seeded onto weakly adhesive substrata aggregate while those seeded onto highly adhesive substrata dissociate.
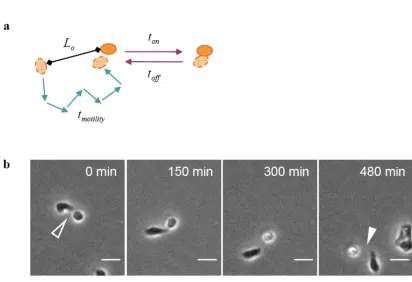
Figure II-1. Two-step model for multicellular aggregation dynamics.
(a) To form aggregates, distant cells must first move close together (a transport step) and then undertake reversible cell-cell interactions (a reaction step). Transport occurs by cell migration, and the mean time to collide (tmotility) depends on the mean initial spacing
between cells (Lo) and the speed and persistence of cell movement. Meanwhile, the local
cell-cell interaction involves adhesion (ton) and detachment (toff). (b) Timelapse images
of migrating MDCK cells show the initiation of cell-cell contact (open arrowhead) and the subsequent detachment (closed arrowhead). Because ton and toff cannot be
distinguished experimentally, timelapse images were used to quantify the total duration of cell-cell interactions (tadhesion) as a lumped measure of ton and toff. Scale bar, 25 μm.
adhering to an underlying substratum. Furthermore, these cell-cell and cell-substratum adhesions involve common molecular components and physical machinery, such as actin and cell-generated contractile forces, respectively.13, 14
To quantify the dynamics of cell-cell interactions, we identified cell-cell collisions in time-lapse videos and recorded the duration of intercellular contact. These measurements were performed using substrata coated with different amounts of the adhesion ligand laminin (Ln) in order to better understand how varying substratum adhesivity affects the lifetime of cell-cell interactions. We observe that the mean lifetime of cell-cell interactions (tadhesion) exhibits a monotonic dependence on substratum
adhesivity (Figure II-2). Increasing adhesion ligand density reduces the lifetime of cell-cell interactions: tadhesion is nearly 600 min on substrata of low adhesivity and is reduced
to approximately 200 min on substrata of high adhesivity. To confirm that our measurements are capturing specific cell-cell interactions, we treated cells with an antibody (DECMA) that blocks E-cadherin, a cell surface receptor that mediates intercellular adhesion. Treatment with DECMA reduces tadhesion compared to treatment
with a non-specific IgG control, confirming that E-cadherin is involved in mediating these cell-cell interactions (Figure II-4, Supplemental Data).
Figure II-2. The dependence of timescales of local cell-cell reactivity (tadhesion) and transport (tmotility) on substratum adhesivity.
The duration of cell-cell interactions (tadhesion) and the mean time for nearest neighbors to
collide (tmotility) were quantified for substrata prepared with different coating
concentrations of Ln. Error bars, SEM (n = 2-3).
Using these values for S and P, we calculated the mean time required for a cell to collide with its nearest neighbor (tmotility = Lo2/μ) where Lo ~ 108 μm is the mean
intercellular spacing based on the initial cell density of 8.5 x 10³ cells/cm2 and the
motility coefficient μ is equal to S2P. This time scale for transport exhibits a biphasic
dependence on substratum adhesivity; therefore cell-cell collisions are infrequent on substrata of low and high adhesivity (tmotility = 6.1 ± 1.8 x 10³ and 1.3 ± 0.6 x 10³ min,
respectively) and occur with greatest frequency on substrata of moderate adhesivity (tmotility = 6.8 ± 3.2 x 10² min) (Figure II-2).
Comparing the measured time scales of transport and local reactivity reveals that tmotility is greater than tadhesion across the complete range of Ln coating concentrations.
Methods). Our method yields highly uniform initial conditions: for all Ln coating concentrations, the initial density of substratum-attached cells was 8.5 ± 0.2 x 10³ #/cm2 (Table II-1, Supplemental Data).
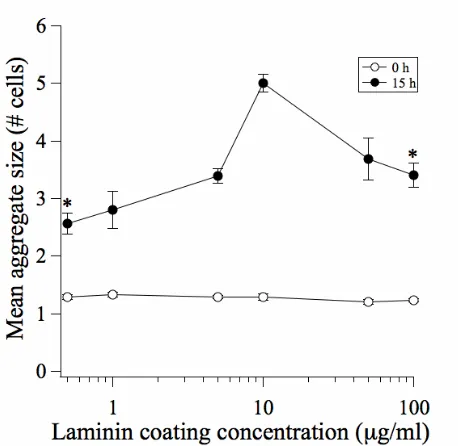
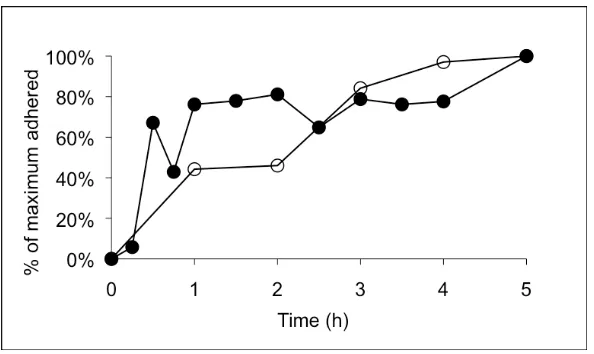
To quantify aggregate sizes, two-channel fluorescence images were acquired of multicellular aggregates stained with a nuclear and cell membrane marker. The mean number of cells per aggregate was determined using previously described automated image processing techniques.20 We first performed a time course study to identify an appropriate time-point at which to examine the dynamics of our system. Mean aggregate size was found to increase monotonically with time until reaching a plateau after 20 h of incubation (Figure II-6, Supplemental Data). Therefore, we selected 15 h as an appropriate incubation time for capturing aggregation dynamics.
Figure II-3. Biphasic dependence of aggregate size on substratum adhesivity: evidence for motility-limited aggregation dynamics.
The mean aggregate size (# cells per aggregate) was quantified at initial time (0 h) and 15 h after the attachment of MDCK cells to Ln-coated substrata. Error bars, SEM (n = 3-4). *, p < 0.05 in comparing to the 10 μg/mL condition.
Our findings establish a key role for cell motility in multicellular aggregation. Evidence is also mounting for the role of cell motility in mediating another multicellular process: cell sorting of heterogeneous cell populations. Though proposed years ago as a potential mediator of cell sorting, differential motility has only recently been discussed as a driving mechanism for this phenomenon.21, 22 A recent mathematical model of Dictyostelium slug formation, for example, demonstrates that motility differences among
sorting together with our results pertaining to cellular aggregation demonstrate the emerging importance of cell motility in the dynamics of multicellular re-arrangements.
In addition to natural developmental processes, our findings have direct implications for tissue engineering. Although engineering biomaterials with reduced adhesivity may enhance aggregation at equilibrium24, we demonstrate that a qualitatively distinct strategy is needed to ensure optimal kinetics of aggregation. When dynamics is the chief concern, we propose that the design strategy must account for whether transport or local cell-cell reactivity is rate-limiting. Where transport is rate-limiting, a biomaterial with intermediate adhesivity will provide maximal aggregation dynamics. In conclusion, our results provide a dynamical physical perspective on engineering microenvironments to promote multicellular aggregation, an important precursor to more mature multicellular structures and tissues.
3. Acknowledgements
4.1. Substratum preparation
Tissue culture-treated polystyrene dishes (Corning) were incubated overnight at 4°C with laminin (Sigma) diluted in PBS. Prior to use, dishes were blocked with 1 mg/mL heat-inactivated (55 C for 1 hour) BSA (Sigma) in PBS at 37oC for 1 h.
4.2. Cell culture
MDCK cells were cultured in Dulbecco’s modified Eagle’s medium (DMEM, Invitrogen) supplemented with 10% (v/v) fetal bovine serum (Invitrogen) and 1% (v/v) penicillin/streptomycin (Invitrogen). For collision, motility and aggregation assays, confluent MDCK monolayers were suspended by treatment with 0.25% trypsin/53 mM EDTA (Invitrogen) for 5 minutes at 37 C and plated at the desired cell density in serum-free medium (SFM: DMEM supplemented with 1% (v/v) penicillin/streptomycin and 1 mg/mL BSA (Sigma)) supplemented with 20 ng/mL epidermal growth factor (EGF) (Peprotech). After allowing cells to adhere to the substratum for 1 – 3 hours, non-adherent cells were washed and the remaining non-adherent cells were incubated in fresh SFM supplemented with 20 ng/mL EGF.
4.3. Quantification of cell-cell adhesion dynamics
maintains temperature, humidity and CO2 levels. 5x phase contrast images were
collected every 5 minutes for 24 hours. Cell-cell interactions that were initiated in the first 12 hours of observation were tracked, and the duration of cell-cell contact was recorded. Interacting cell pairs observed to collide with an additional cell or group of cells were excluded from the analysis.
4.4. Quantification of migration speeds
Migration tracks of individual cells were imaged by time-lapse microscopy. 10x phase contrast images were collected every 15 minutes for 15 hours. Nuclei of isolated cells were marked using ImageJ software (National Institutes of Health), and mean squared displacements were determined for each cell using overlapping intervals.16 The mean squared displacements were averaged and fit to a persistent random walk model to calculate cell speed, S, and persistence time, P: <d2(t)> = 2S2P[t-P(1-e-t/P)].15, 16 Persistence was averaged across all laminin coating concentrations to determine a mean persistence time.
4.5. Quantification of aggregate size
5. Supplemental Methods
In order to study how local cell-cell reactivity and transport by cell migration affect aggregation dynamics, it is essential to ensure that (1) isolated cells (not pre-formed aggregates) are seeded initially on the substrata, (2) any non-adherent cells are removed to prevent them from drifting and binding to adherent cells/aggregates, and (3) the initial density of isolated cells (and, therefore the initial mean intercellular spacing) is equal among all samples.
To address these considerations, MDCK cells were suspended using traditional cell dissociation techniques, and a desired concentration of single cells (Nc) was seeded
onto Ln-coated substrata. After incubating cells for an appropriate duration (tinc) to allow
cell adhesion onto the substratum, non-adherent cells were removed by medium aspiration. The key issue, however, lies in determining the appropriate values for Nc and
tinc to ensure that the initial cell density on the substratum is equal for all Ln coating
concentrations.
h and is much shorter than the time at which aggregation is quantified (15 h after tinc).
In addition to the time of incubation, careful attention was given to the concentration of cells (Nc) seeded for each Ln coating concentration. We observed that
the fraction of seeded cells that attach to the substratum at tinc varied with Ln coating
concentration (Figure II-8, Supplemental Data). Therefore, to ensure equivalent initial cell density among the different Ln-coated substrata, we seeded a greater concentration of cells (Nc) on substrata coated with lower amounts of Ln than on those coated with higher
Ln density. Because the fraction of adherent cells was likely to also vary between trials, we took an additional precaution by performing each trial as follows: duplicate sets of cell suspensions containing three closely-spaced Nc were seeded for each Ln coating
6. Supplemental Data
Figure II-4. Effect of antibody treatments on the lifetime of cell-cell interactions. The lifetime of cell-cell adhesions (tadhesion) was measured in the presence of an
Figure II-5. Cell speed exhibits a biphasic dependence on surface adhesivity.
Figure II-6. Time-course of aggregate assembly.
Figure II-7. Substratum adhesivity affects the rate of cell attachment to the substratum.
0 0.2 0.4 0.6 0.8 1 1.2
1 10 100
Ln coating concentration (μg/mL)
F
ract
ion of
c
e
lls
The number of substratum-attached cells per unit surface area was quantified at initial time (0 h) from fluorescence images of MDCK cells stained with DAPI. Error bars, SEM (n = 3-4).
Ln coating concentration (μg/mL)
0.5 1 5 10 50 100
Initial cell surface density x 10-3
(#/cm2)
8.3 ± 0.78
8.2 ± 0.32
9.1 ± 0.50
8.9 ± 0.59
8.2 ± 0.59
Table II-2. Incubation times for Ln-coated substrata.
Ln coating concentration (μg/mL) 0.5 1 5 10 50 100
Nc x 10-4 (#/mL)
Ln coating concentration (μg/mL) 3.75 5.0 6.75 7.5 10.0 12.5
0.5 X X X
1 X X X
5 X X X
10 X X X
50 X X X
7. References
1. Gumbiner BM. Cell adhesion: the molecular basis of tissue architecture and morphogenesis. Cell 1996; 84:345-57.
2. Nakagawa S, Takeichi M. Neural crest cell-cell adhesion controlled by sequential and subpopulation-specific expression of novel cadherins. Development (Cambridge, England) 1995; 121:1321-32.
3. Oberlender SA, Tuan RS. Expression and functional involvement of N-cadherin in embryonic limb chondrogenesis. Development (Cambridge, England) 1994; 120:177-87.
4. Steinberg MS. On Mechanism of Tissue Reconstruction by Dissociated Cells .3. Free Energy Relations and Reorganization of Fused, Heteronomic Tissue Fragments. Proceedings of the National Academy of Sciences of the United States of America 1962; 48:1769-&.
5. Steinberg MS. Differential adhesion in morphogenesis: a modern view. Current opinion in genetics & development 2007; 17:281-6.
6. Steinberg MS, Foty RA. Intercellular adhesions as determinants of tissue assembly and malignant invasion. Journal of cellular physiology 1997; 173:135-9. 7. Lin MY, Lindsay HM, Weitz DA, Ball RC, Klein R, Meakin P. Universality in
Colloid Aggregation. Nature 1989; 339:360-2.
8. Seinfeld J, Pandis S. Atmospheric Chemistry and Physics: From Air Pollution to Climate Change (Wiley, Hoboken, 2006).
substrates is a competitive outcome of cell-cell vs. cell-substratum adhesivity. Proceedings of the National Academy of Sciences of the United States of America 2001; 98:4323-7.
11. Palecek SP, Loftus JC, Ginsberg MH, Lauffenburger DA, Horwitz AF. Integrin-ligand binding properties govern cell migration speed through cell-substratum adhesiveness. Nature 1997; 385:537-40.
12. Sung KL, Sung LA, Crimmins M, Burakoff SJ, Chien S. Determination of junction avidity of cytolytic T cell and target cell. Science 1986; 234:1405-8. 13. Hartsock A, Nelson WJ. Adherens and tight junctions: structure, function and
connections to the actin cytoskeleton. Biochimica et biophysica acta 2008; 1778:660-9.
14. Ridley AJ, Schwartz MA, Burridge K, Firtel RA, Ginsberg MH, Borisy G, Parsons JT, Horwitz AR. Cell migration: integrating signals from front to back. Science 2003; 302:1704-9.
15. Dickinson RB, Tranquillo RT. Optimal Estimation of Cell-Movement Indexes from the Statistical-Analysis of Cell Tracking Data. Aiche J 1993; 39:1995-2010. 16. Walmod PS, Hartmann-Petersen R, Berezin A, Prag S, Kiselyov VV, Berezin V,
Bock E. Evaluation of individual-cell motility. Methods in molecular biology (Clifton, NJ 2001; 161:59-83.
morphology of non-tumorigenic and tumor cells. In vitro cellular & developmental biology 1994; 30A:105-10.
18. Maheshwari G, Wiley HS, Lauffenburger DA. Autocrine epidermal growth factor signaling stimulates directionally persistent mammary epithelial cell migration. The Journal of cell biology 2001; 155:1123-8.
19. Mori H, Gjorevski N, Inman JL, Bissell MJ, Nelson CM. Self-organization of engineered epithelial tubules by differential cellular motility. Proceedings of the National Academy of Sciences of the United States of America 2009; 106:14890-5.
20. Pope MD, Graham NA, Huang BK, Asthagiri AR. Automated quantitative analysis of epithelial cell scatter. Cell adhesion & migration 2008; 2:110-6.
21. Stefanelli A ZA CV. Retinal reconstitution in vitro after disaggregation of embryonic chicken eyes. Acta Embryol Morphol Exper 1961; 4:47-55.
22. Townes PL, Holtfreter J. Directed Movements and Selective Adhesion of Embryonic Amphibian Cells. J Exp Zool 1955; 128:53-120.
23. Umeda T, Inouye K. Cell sorting by differential cell motility: a model for pattern formation in Dictyostelium. Journal of theoretical biology 2004; 226:215-24. 24. Powers MJ, Rodriguez RE, Griffith LG. Cell-substratum adhesion strength as a
determinant of hepatocyte aggregate morphology. Biotechnology and bioengineering 1997; 53:415-26.
E
PITHELIALC
ELLS
CATTER1. Abstract
Epithelial cells have an intrinsic ability to self-assemble into multicellular structures. For example, submandibular gland (SMG) epithelial cells isolated from embryonic mice retain the ability to self-organize into branched tissue aggregates in a manner analogous to that which occurs in vivo.1 These epithelial tissues have a distinct, well-ordered structure. Namely, constituent cells tightly adjoin to their neighbors and form highly polarized multicellular sheets that provide physical barriers between external and internal environments. In addition, epithelial cells are motile, in that they can move away from their neighbors, but generally remain within the epithelial layer.2
Many epithelial tissues are dynamic structures that undergo constant regeneration. Disruptions in the self-assembly and maintenance of epithelial cell structures can have drastic pathological consequences such as cancer development.3 These physical disruptions are driven by molecular perturbations that alter cell behavior. For example, oncogenes such as c-met break up cellular aggregates and promote cell dispersion.4 At a
single cell level, these molecular perturbations induce an epithelial-mesenchymal transition (EMT). During EMT, epithelial cells lose apical-basolateral polarity and transform into a more migratory phenotype, resembling fibroblasts. This allows cells to dissociate from the epithelial layer and disperse.5
aggregates dissociate in response to extracellular stimuli. While advances are being made in cataloguing the signaling pathways that control scatter, an emerging challenge is to understand the quantitative contributions of these signals and any coupling between them. For example, which stimuli are the most potent effectors? Which signals work synergistically? Which signals work antagonistically?
A challenge to answering these questions is that current studies of cell scatter are largely qualitative. Prevalent in the limited quantitative literature are studies that score cellular aggregates as “scattered” based on an observed morphological change – for example the appearance of space between cells, the disappearance of membrane-localized desmoplakin or a reduction in the number of cell-cell adhesions.6-9 Such analyses permit comparison between experimental conditions but provide little insight into the cellular-level response.
automated techniques to identify cell nuclei and multicellular aggregates in fluorescence images. In summary, this work provides an experimental methodology and high throughput techniques that will prove useful for gleaning quantitative insights into EMT.
3. Results
3.1. EGF regulates MCF-10A scatter
Figure III-1. EGF is a key regulator of epithelial cell scatter.
(A) MCF-10A cells were maintained in SFM for 24 hours to induce the formation of multicellular aggregates. To induce scatter, aggregates were then treated for 24 hours with multiple soluble factors. GM (B), EGF + CT (E) and EGF + CT + insulin (F) induce cell scatter, while EGF (D) and GM containing all factors except for EGF (C) do not. EGF, CT and insulin were used at concentrations identical to those of GM: 20 ng/ml, 100 ng/ml, and 10 µg/ml respectively. Scale bars are 100 µm.
3.2. Quantitative metrics of cell scatter
increase as cells scatter. This metric of cell scatter would have a lower limit (the diameter of a single cell) and an upper limit that depends on the surface density of cells.
3.3. The distribution of cluster sizes is differentially altered by EGF-containing media
After serum-starvation, the distribution of cluster sizes is bimodal, with one peak centered at small sizes (2-5 cells per cluster) and a second peak centered at moderate sizes (20-30 cells per cluster) (Figure III-2A). Upon treatment with EGF for 24 hours, the fraction of isolated cells (i.e. 1 cell per cluster) remains unchanged. This confirms that EGF is not sufficient to disrupt multicellular aggregates (Figure III-1D). However, unexpectedly, treatment with EGF dramatically reduces the fraction of cells in small- and moderate-sized clusters (2-70 cells per cluster), leading to the emergence of a new population of large aggregates (100+ cells per cluster) (Figure III-2B).
serum-starved cells treated with EGF. These videos clearly show the amalgamation of small/moderate-sized aggregates into large aggregates (Figure III-2C). It therefore appears that although EGF is required for scatter, treatment with this factor alone promotes the formation of new cell-cell adhesions and the amalgamation of pre-existing aggregates.
Treatment with CT in conjunction with EGF increases the fraction of cells that are isolated or in small clusters after 24 hours compared to treatment with EGF alone. This result is consistent with the apparent cell scatter induced by co-treatment with EGF and CT (Figure III-1E). Furthermore, inclusion of CT reduces the formation of new large clusters. CT therefore synergizes with EGF in both disrupting cell-cell adhesions and reducing the formation of new adhesions.
The further addition of insulin results in nearly complete dissociation of moderate-sized aggregates (15-100 cells per cluster), and predominantly small clusters and isolated cells remain after 24 hours. Thus, insulin makes a striking contribution to the disruption of cell clusters that was not evident from our qualitative analysis (Figure III-1F). Our quantitative measurements reveal that insulin-mediated signals are essential for maximum scatter.
mediated effects and reduce scatter.
Figure III-2. Distribution of cluster sizes for scattering cells.
0.05 (Student’s t test) in comparing the fraction of cells that are isolated after treatment with EGF + CT to the fraction of cells that are isolated after culture in SFM and comparing the fraction of cells that are isolated after treatment with GM to the fraction of cells that are isolated after culture in SFM. (C) Aggregates were treated with EGF and imaged via time-lapse microscopy for 24 hours. Arrowheads indicate locations where new adhesions are formed. Scale bars are 100 µm.
3.4. The distribution of nearest-neighbor distances is differentially altered by EGF-containing media
MCF-10A cells were maintained in SFM for 24 hours to induce the formation of multicellular aggregates. Aggregates were then treated with the indicated factor(s) and imaged via time-lapse microscopy for 24 hours. Nearest-neighbor distances were determined for all cells within the first (SFM) and last frames. A cell diameter was taken to be the greatest nearest-neighbor distance measured for contacting serum-starved cells (42 µm), and all nearest-neighbor distances were expressed as multiples of this distance. Data are means ± standard error; n=2.
To determine if the measured nearest-neighbor distances approach those expected at maximal scatter, we calculated a theoretical maximum internuclear distance that corresponds to the case where all cells are equally spaced from one another. This distance was calculated as follows: the surface area contained within an image was divided by the number of cells within the image to determine an area per cell. Assuming each cell to be a circle of the resulting area with a nucleus at its center, the maximum internuclear distance was calculated to be 76.9 ± 4.8 μm or ~1.8 cell diameters. Therefore, the distances presented in Figure III-3 approach the values expected at the time of maximal scatter.
3.5. Automated image processing
Figure III-4. Automated image processing using MATLAB.
(A, A’) Nuclear- and membrane-localized fluorescent proteins, H2B-GFP and mCherry respectively, were co-expressed in MCF-10A cells. (B, B’) Epifluorescence images of scattering cells were segmented using thresholding and edge detection algorithms in MATLAB. (C) Masks were created such that each mask contained a single cluster. (C’) Masks were then applied to the corresponding H2B-GFP image and nuclei that co-localized with the mask were identified. These nuclei were counted to determine the cluster size.
bwareaopen. Objects smaller than the area of a single cell (~400 µm2) were eliminated from the image, resulting in a binary image containing distinct cell clusters (Figure III-4B’).
Cluster size and nearest-neighbor distance metrics were easily and quickly extracted from the processed images. To determine cluster sizes, clusters in membrane-mCherry frames were first indexed using the function bwlabel. Bwlabel creates a matrix in which pixels labeled 0 make up the background, pixels labeled 1 make up one object, pixels labeled 2 make up a second object, and so on. From each indexed image, a series of masks was created such that each mask contained a single cluster (Figure III-4C). Masks were then applied to the corresponding H2B-GFP image and the nuclei overlapping with each were indexed and counted using bwlabel (Figure III-4C’). To determine nearest-neighbor distances, nuclear centroids were determined from the segmented H2B-GFP frames using the function regionprops. Internuclear distances were calculated and the minimum distance measured for each cell was recorded.
Figure III-5. Comparison of manual and automated techniques.
We note that for each application (i.e. cell line and stimulation conditions), one must also test whether the H2B-GFP and membrane-mCherry constructs perturb cell behavior. This is best accomplished by comparing cluster sizes and nearest-neighbor distances determined manually for uninfected cells to those determined manually for cells expressing the fluorescent constructs.
4. Discussion
Epithelial organization is regulated by a complex signaling network. Many scatter-promoting factors have been identified, among them EGF, hepatocyte growth factor (HGF), fibroblast growth factor (FGF) and transforming growth factor β (TGF-β). These extracellular cues trigger various intracellular signals – Src, Rac, PI3K and Erk, for example – that drive scatter.3, 14, 15 A key limiting factor in our understanding of this phenomenon is that the phenotypic changes associated with scatter are characterized largely in qualitative terms. Such assessment is inadequate for several reasons. First, qualitative characterizations do not provide insight into how important a particular factor might be. Is the degree of scatter induced by EGF the same as that induced by HGF? Is there quantitative synergy when both signals are received? Second, cell scatter is a complex phenomenon involving several events. These events include de-compaction of the aggregate, cell-cell dissociation and cell migration. However, because cell scatter is currently evaluated in a lumped fashion, the precise facet(s) of cell scatter a given signal affects remain unclear.
epithelial cell scatter. We demonstrate that these metrics gauge the potencies with which specific signals induce scatter and the synergies among them. Our measurements show that although EGF alone is unable to induce cell scatter, it synergizes with CT to reduce aggregate sizes and increase nearest-neighbor distances. Furthermore, our quantitative metrics extracted information regarding the role of insulin that would be missed from a qualitative analysis. Inspecting images of cells treated with EGF, CT and insulin suggested that insulin provided no major enhancement to the scatter induced by EGF and CT. However, quantitative measurements of cluster sizes and nearest-neighbor distances revealed that insulin provides a striking improvement in cell scatter, essentially ablating all clusters. This type of quantitative analysis will prove useful for categorizing scatter-promoting factors according to their ability to alter epithelial structures and for grouping synergistic cues. Moreover, identifying potent scatter-inducing cues may provide more pivotal targets for anti-cancer therapeutics.
The metrics proposed in this study quantify distinct aspects of scatter, and therefore, may not always be correlated to each other. For example, GM treatment does not score as the most efficient at breaking clusters apart (Figure III-2), but still mediates the largest increase to nearest-neighbor distance (Figure III-3). This counterintuitive observation is due to a phenomenon called de-compaction, where cells in a cluster relax cell-cell adhesions and enhance cell spreading against the substratum. In this manner, GM-treated cells distance themselves from their neighbors without breaking cell-cell contacts. Thus, the proposed metrics gauge distinct aspects of multicellular organization and analyzing how both metrics respond to molecular perturbations can provide mechanistic insights.
Because the metrics capture distinct facets of cell scatter, they will prove useful in exploring synergisms between signals. Some cues, for instance, will have a profound effect on breaking cell-cell contacts but little effect on the nearest-neighbor distance. Other cues will have exactly the opposite effect. Combined exposure to such complementary cues may have a synergistic effect on cell scatter that is significantly greater than their individual contributions. Identifying such synergistic cues may reveal “multi-hit” pathways that contribute to cancer development and thereby guide therapeutic strategies.
5. Materials and Methods
5.1. Cell culture
MC10A cells were cultured in Dulbecco’s modified Eagle’s medium/Ham’s F-12 containing HEPES and L-glutamine (Invitrogen) supplemented with 5% (v/v) horse serum (Invitrogen), 20 ng/ml EGF (Peprotech), 0.5 µg/ml hydrocortisone (Sigma), 0.1 µg/ml cholera toxin (Sigma), 10 µg/ml insulin (Sigma), and 1% penicillin/streptomycin (Invitrogen). For serum starvation, cells were washed twice with PBS and then cultured in Dulbecco’s modified Eagle’s medium/Ham’s F-12 supplemented with 1% (v/v) penicillin/streptomycin and 0.1% bovine serum albumin (Sigma) for 24 h.
5.2. Plasmid Constructs
H2B-GFP and membrane-mCherry were gifts from S. Fraser (California Institute of Technology). The membrane-mCherry construct consists of monomeric mCherry fused to the first 20 amino acids of zebrafish Gap43.16 Palmitoylation at cysteine residues within the Gap43 sequence directs the mCherry protein to the membrane.17, 18 VSV-G and gag-pol vectors were gifts from D. Schaffer (University of California, Berkeley).
5.3. Retroviral Infection
VSV-G, gag-pol and the retroviral vector using LipofectAMINE (Invitrogen). For infection, cells were incubated with retrovirus-containing medium and 8 µg/ml polybrene for 24 h. Puromycin (2 µg/mL) and hygromycin (100 µg/mL) were used for selection.
5.4. Cell scatter assay
MCF-10A cells were seeded in GM at a density of 8 x 10⁴ per 35 mm culture dish
and, 18-24 hours later, serum starved for 24 hours to induce aggregate formation. Cell aggregates were then stimulated with the indicated factor(s) and imaged. MCF-10A cells co-expressing membrane-mCherry and H2B-GFP were seeded at 2 x 10⁴ per 35 mm dish.
5.5. Live cell microcopy
6. Supplemental Data
Figure III-6. Phase contrast images of MCF-10A cell aggregates treated with EGF + CT.
Figure III-7. Phase contrast images of MCF-10A cell aggregates treated with EGF + CT + insulin.
7. References
1. Wei C, Larsen M, Hoffman MP, Yamada KM. Self-organization and branching morphogenesis of primary salivary epithelial cells. Tissue engineering 2007; 13:721-35.
2. Schock F, Perrimon N. Molecular mechanisms of epithelial morphogenesis. Annual review of cell and developmental biology 2002; 18:463-93.
3. Thiery JP. Epithelial-mesenchymal transitions in tumour progression. Nature reviews 2002; 2:442-54.
4. Ma PC, Maulik G, Christensen J, Salgia R. c-Met: structure, functions and potential for therapeutic inhibition. Cancer metastasis reviews 2003; 22:309-25. 5. Vincent-Salomon A, Thiery JP. Host microenvironment in breast cancer
development: epithelial-mesenchymal transition in breast cancer development. Breast Cancer Res 2003; 5:101-6.
6. Jourquin J, Yang N, Kam Y, Guess C, Quaranta V. Dispersal of epithelial cancer cell colonies by lysophosphatidic acid (LPA). Journal of cellular physiology 2006; 206:337-46.
7. Boyer B, Roche S, Denoyelle M, Thiery JP. Src and Ras are involved in separate pathways in epithelial cell scattering. The EMBO journal 1997; 16:5904-13. 8. Edme N, Downward J, Thiery JP, Boyer B. Ras induces NBT-II epithelial cell
Integrin-dependent actomyosin contraction regulates epithelial cell scattering. The Journal of cell biology 2005; 171:153-64.
10. Lu Z, Ghosh S, Wang Z, Hunter T. Downregulation of caveolin-1 function by EGF leads to the loss of E-cadherin, increased transcriptional activity of beta-catenin, and enhanced tumor cell invasion. Cancer cell 2003; 4:499-515.
11. Matthay MA, Thiery JP, Lafont F, Stampfer F, Boyer B. Transient effect of epidermal growth factor on the motility of an immortalized mammary epithelial cell line. Journal of cell science 1993; 106 ( Pt 3):869-78.
12. Gonzales R, Woods R, Eddins S. Image Segmentation. In: O'Brian V, ed. Digital Image Processing using MATLAB. Upper Saddle River, NJ: Pearson Prentice Hall, 2004.
13. McAndrew A. Image Segmentation. In: Mendelsohn M, ed. Introduction to Digital Image Processing with MATLAB. Boston, MA: Thomson Course Technology, 2004.
14. Christofori G. New signals from the invasive front. Nature 2006; 441:444-50. 15. Thiery JP, Sleeman JP. Complex networks orchestrate epithelial-mesenchymal
transitions. Nat Rev Mol Cell Biol 2006; 7:131-42.
17. Skene JH, Virag I. Posttranslational membrane attachment and dynamic fatty acylation of a neuronal growth cone protein, GAP-43. The Journal of cell biology 1989; 108:613-24.
PROTEIN
-
PROTEIN INTERACTIONS ASSOCIATED WITH CELL-CELL ADHESION
1. Abstract
Cell-cell adhesions are an integral aspect of epithelial tissues. These adhesions provide a physical barrier between two compartments, permitting the epithelial cell layer to serve as a selective transporter. Moreover, the attenuation of cell-cell adhesion plays a critical role in both early and late stages of oncogenesis.1 At early steps, reduced intercellular adhesion may attenuate contact-inhibition of proliferation, permitting unchecked cell division and tumor formation; at later stages, reduced cell-cell adhesion is often associated with invasion, metastasis, and poor patient prognosis.2
In epithelial tissues, adherens junctions play a central role in the establishment and maintenance of cell-cell adhesions.3 These junctions are composed of the cadherin and catenin families of proteins, which link sites of cell-cell contact to the actin cytoskeleton. Cadherins are transmembrane proteins that bind homotypically to cadherins on neighboring cells; meanwhile, the intracellular tail of cadherins binds β-catenin, which then recruits α-catenin and links to the actin cytoskeleton. In epithelial tissues, E- (epithelial) cadherin is the predominant member of the cadherin family expressed, and the loss of E-cadherin via genetic and epigenetic mechanisms is common in tumor progression.4
these methods are low-throughput and offer only qualitative information. Other more quantitative approaches have been developed to examine the molecular mechanisms governing E-cadherin:β-catenin association, including bead-based co-immunoprecipitation techniques (co-IP),7-9 semi-quantitative immunofluorescence,10
recombinant protein pull-down assays,11, 12 and chip-based biosensors.13 Co-IP assays, in particular, have been widely used to measure the association of endogenous E-cadherin and β-catenin; however, this technique involves cumbersome and repetitive centrifugation and wash steps, as well as low-throughput handling of multiple test tubes. Furthermore, the proteins isolated by co-IP are typically analyzed by Western blotting, which offers a limited linear range of detection. In contrast, other techniques using recombinant proteins provide quantitative measures of E-cadherin:β-catenin interactions over a wide linear range;12, 13 however, these in vitro binding assays may not reflect in vivo biology.
3.1. Development and validation of a quantitative microtiter ELISA for
E-cadherin:β-catenin protein complexes
of change in optical density at 405 nm provides a quantitative measure of detection antibody present.
The protein complex ELISA hinges on the possibility that capturing an antigen from crude cell lysates will co-precipitate associated proteins. This co-precipitation is exploited in IP-based detection of protein-protein complexes, a technique that involves the low-throughput, cumbersome use of test tubes in repeated centrifugation and wash steps. To verify that co-precipitation would occur in a microtiter format, we used a monoclonal anti-E-cadherin antibody to capture E-cadherin from whole cell lysate and subsequently treated the wells with SDS sample buffer to extract all proteins. For this initial test, we used lysates from an immortalized mammary epithelial cell line (MCF-10A) that forms adherens junctions rich in E-cadherin:β-catenin complexes.
Figure IV-1. Antigen capture and protein:protein co-capture.
Mouse monoclonal antibodies against either (A) E-cadherin or (B) β-catenin were adsorbed to a microtiter plate, and varying amounts of whole cell lysates from MCF-10A cells were incubated in the wells. Protein fractions isolated by the capture antibodies were collected and analyzed by Western blot for the presence of E-cadherin or β-catenin.
protein complex ELISA’s robustness, the statistical parameter used for evaluation of high-throughput screens (Z’) for this E-cadherin:β-catenin ELISA was 0.74.
Figure IV-2. Detection of E-cadherin:β-catenin protein complexes by protein complex ELISA.
Whole cell lysate from MCF-10A cells was analyzed by protein complex ELISA for E-cadherin:β-catenin complexes by either (A) E-cadherin capture or (B) β-catenin capture. The rate of change in the optical density over time was plotted versus total cell lysate, and a linear regression was performed. Error bars represent the sample standard error (n = 3).
consistent with the full profile of in vivo protein:protein interactions in which β-catenin and E-cadherin participate. Whereas the β-catenin-binding domain of E-cadherin also recruits plakoglobin, a close homolog of β-catenin,3 the Armadillo repeat domains of
β-catenin bind numerous proteins including α-β-catenin, Tcf/Lef and components of the Axin-APC degradation machinery.17 Thus, in principle, for a fixed E-cadherin:β-catenin
binding affinity in a particular cell lysate, captured E-cadherin should generate more co-captured β-catenin signal than the co-capture of E-cadherin by β-catenin. However, while this physiological explanation could explain the better performance of the E-cadherin:β-catenin ELISA, we cannot rule out assay-related issues, such as relatively poorer efficacy of the monoclonal capture antibody for β-catenin versus E-cadherin.
Table IV-1. Quantitative performance of protein complex and sandwich ELISAs
neutravidin, followed by incubation with a biotinylated secondary antibody that would bind the Fc domain of the capture antibody. Although this approach has been reported to increase antigen capture elsewhere,18 the neutravidin/biotin approach reduced the signal/background ratio of our protein complex ELISA by approximately 5-fold compared to direct adsorption of the capture antibody (data not shown).
The reduced sensitivity resulted from a non-specific interaction between neutravidin and the alkaline phosphatase-conjugated secondary antibody used in the detection phase of the assay. In other stages of assay development, we observed that the monoclonal antibody outperformed the polyclonal antibody in the capture step. For example, in the case of the E-cadherin:β-catenin ELISA, using the mouse monoclonal antibody for antigen capture step yielded a ~6-fold higher signal/background ratio than when the rabbit polyclonal antibody was used for capture (data not shown). Additionally, we explored the effect of the incubation temperature on assay sensitivity, but protein complex ELISAs carried out at 4 ºC and 37 ºC showed no difference in assay sensitivity (data not shown). All results reported here are from assays conducted at 37 ºC.
these antibodies specifically recognize only one protein in Western blots (data not shown), combined with the fact that these antibodies can mediate capture of protein complexes in a microtiter well (Figure IV-1), this demonstrates that the protein complex ELISA is specifically measuring the interaction of E-cadherin and β-catenin.
Figure IV-3. Specificity test for E-cadherin:β-catenin ELISA.
The E-cadherin:β-catenin ELISA was performed on 100 μg of MCF-10A whole cell lysate. At the appropriate step, either the whole cell lysate, the anti-E-cadherin capture antibody (Ab), or the anti-β-catenin detection antibody was omitted from the assay. Values are presented as the percentage of the rate of change in optical density over time relative to the control ELISA, where no reagents were omitted (Full ELISA). Error bars represent the sample standard error (n = 3).
level of protein:protein complexes may be to due to a change in either protein:protein affinity or protein expression level. To discriminate between these possibilities, it is essential to measure the total amount of each protein in whole cell lysates. To address this issue, we exploited the flexibility of the protein complex ELISA to accommodate the traditional sandwich ELISA.
protein complex ELISA is readily compatible with the sandwich ELISA for detecting total protein levels. This compatibility suggests that these assays may be operated on the same microtiter platform in parallel, reducing interplate variabilities and enhancing measurement throughput.
Figure IV-4. Detection of E-cadherin and β-catenin total protein levels by sandwich ELISA.
Whole cell lysate from MCF-10A cells was analyzed by sandwich ELISA for (A) total E-cadherin expression or (B) total β-catenin expression. The rate of change in optical density over time was plotted versus total cell lysate, and a linear regression was performed. Error bars represent the sample standard error (n = 3).
3.3. Quantitative comparison of E-cadherin:β-catenin interactions in transformed
versus non-transformed cells
phenotype, including E-cadherin-mediated intercellular adhesion;19 meanwhile, SW480 is a colon carcinoma cell line with a dysfunctional β-catenin degradation machinery that permits β-catenin to build up to high levels in the cytoplasm.20
To confirm that SW480 cells express greater amounts of β-catenin than MCF-10A cells, we used the β-catenin sandwich ELISA. The β-catenin sandwich ELISA yielded a linear response with respect to the amount of whole cell lysate load in the assay for both cell types (Supplementary Figure IV-1). We quantified the slope of the ELISA signal versus the amount of whole cell lysate as a metric of the amount of β-catenin. As shown in Figure IV-5A, the amount of β-catenin per μg of cell lysate was nearly 10-fold higher in SW480 cells than in MCF-10A cells, consistent with the known dysfunction of β-catenin degradation in SW480 cells.
Figure IV-5. Quantitative comparison of the levels of E-cadherin:β-catenin complexes, E-cadherin and β-catenin expression in normal and tumorigenic cell lines.
Whole cell lysates were prepared from MCF-10A and SW480 cells, and were analyzed either by (A) sandwich ELISA for total β-catenin levels, (B) protein complex ELISA for E-cadherin:β-catenin complexes, or (C) sandwich ELISA for total E-cadherin levels. For both the sandwich ELISAs and the protein complex ELISA, the rate of change in optical density over time was plotted versus total cell lysate, as shown in Figure IV-7 (Supplemental Data). The slopes of these curves were normalized to the value of the MCF-10A sample and then reported in relative units (R.U.). Error bars represent 95% confidence intervals on the slope; the asterisk denotes P < 0.001, as calculated by ANCOVA. (D) The level of E-cadherin:β-catenin complexes from the protein complex ELISA in MCF-10A and SW480 were normalized to total cellular levels of E-cadherin or β-catenin, as measured by the sandwich ELISA.