An Analytical Voltage Stability Model for Wind
Power Plant Sizing and Siting in Distribution
Networks
Seyed Morteza Alizadeh
B.Sc. and M.Sc. in Electrical and Electronics Engineering
College of Engineering and Science Victoria University, Melbourne, Australia
Submitted in fulfillment of the requirements of the degree of
Doctor of Philosophy
Abstract
Electrical energy is the most widely used form of energy worldwide. The world is currently experiencing severe energy shortages as the fossil-fuel deposits are decreasing
at an alarming rate. The increased awareness about environmental hazards, caused by the burning of fuels, is also forcing governments towards exploiting renewable-energy
resources. Wind is one the important renewable resources, abundantly available, and offers the lowest cost per MWh as compared to most other renewable-energy resources. Harvesting energy from the wind as an alternative to fossil fuels has many advantages
in terms of protecting the environment and promoting sustainability. However, voltage profile of distribution networks with interconnected Wind Power Plant (WPP) can be
significantly affected ascribable to the limited capability of Wind Turbine Generators (WTGs) in regulating terminal voltage through reactive power control.
The interconnection of the WPPs to distribution networks must ensure that the
Point of Common Coupling (PCC) bus voltage is maintained within the allowable steady-state voltage range defined in the grid codes. Furthermore, the overall X/R ratio
in distribution networks is small when compared to transmission networks. This makes the voltage regulation more challenging in distribution networks. Given all these, voltage stability at the PCC of a WPP is a key concern in the interconnection of WPPs
to distribution networks. The Short Circuit Capacity (SCC), line parameters, and the corresponding system X/R ratio are the most important parameters which can be
calculated at a given point looking back to the distribution substation. These parameters are very critical in dictating the voltage stability of a distribution network connected
This thesis addresses issues concerned with the interconnection of WPPs to distribution networks through detailed voltage stability analysis studies. As the main
contribution of this thesis, a voltage stability analytical model has been developed for modelling the relations between the PCC bus voltage (VPCC), wind power generation
(Pwind), SCC, and the X/R ratio.
A sensitivity analysis was first carried out to gather datasets, which were used to identify a numerical relation between the voltage and X/R ratio at the PCC of various
IEEE test systems with different SCR values. Analysis was carried out based on two types of WTGs commonly used in the WPPs: Induction Generator (IG) and Double Fed Induction Generator (DFIG). For each generator type, the obtained V-X/R data points
were then used to develop general forms of equations capable of modelling the relations between the voltage, Pwind, and the PCC parameters. A Genetic Algorithm (GA) based
approach was then used to identify the coefficients of the developed equations. The accuracy of the proposed equations was then evaluated using different scenarios involving a wide range of operating conditions.
The work is novel and the proposed analytical model makes significant contributions to knowledge by demonstrating the effects of key network PCC characteristics on the PCC bus voltage stability. The proposed analytical model would
enable the network and grid interconnection engineers with a methodology that can be used for the initial predictive assessment of viable interconnection sites from a
steady-state voltage stability view. The novel SCC and X/R based voltage-stability model has high accuracy and enables a predictive analytical assessment on siting and sizing of WPPs in distribution networks. It enables to promptly conduct three important voltage
DFIG-Based WPPs. These criteria are: VPCC profile, the step-VPCC variation in response
to the change of Pwind, and the maximum permissible wind power capacities that would
satisfy grid code requirements in regards to steady-state voltage stability. The proposed model simplifies the challenges concerned with finding optimal allocation and sizing of WPPs in distribution networks using the existing approaches and removes the need to
carry out time consuming calculations.
A follow-on benefit of this work is the fact that it would enable a predictive
Student Declaration
I, Seyed Morteza Alizadeh, declare that the PhD thesis entitled “An Analytical Voltage Stability Model for Wind Power Plant Sizing and Allocating in Distribution Networks” is no more than 100,000 words in length including quotes and exclusive of
tables, figures, appendices, bibliography, references and footnotes. This thesis contains
no material that has been submitted previously, in whole or in part, for the award of any other academic degree or diploma. Except where otherwise indicated, this thesis is my own work.
Signature:
Acknowledgements
I would like to express my sincere gratitude to the College of Engineering and Science, Victoria University, for letting me fulfil my dream of being a PhD student here.
My deep gratitude goes to my supervisor, Dr. Cagil Ozansoy, for fully supporting me throughout the course of doctoral program, for patiently guiding and encouraging me on
conducting high level research, and for pushing me further than I thought I could go.
To Prof. Stephen Collins, Prof. Vincent Rouillard, Dr. Valli Navaratnam, and Dr,
Rudi Van Staden for giving me this opportunity to work as a tutor and lab instructor and gain an excellent experience in teaching in an international environment.
To my parents, Seyed Mohammad Alizadeh and Maryam Ghadaksaz Zadeh, for their endless support during my period of working on the thesis. Your love and constant
patience have taught me so much about sacrifice, discipline, and compromise.
To my sisters, Sara and Samaneh, brothers in law, and nieces for their love and always positive vibes which felt near even from a long distance.
Finally, to my friends, especially Simon Northey, Gareth Northey, and Anne Sophie Westerdahl, who were just like a family and helped me to keep my moral on the
Publications
[1] Seyed Morteza Alizadeh, Cagil Ozansoy, Tansu Alpcan, “The impact of X/R ratio on voltage stability in a distribution network penetrated by wind farms”, in 2016 Australasian Universities Power Engineering Conference (AUPEC), 2016, pp. 1-6
Under review:
[2] Seyed Morteza Alizadeh, Cagil Ozansoy, “The Effect of Short Circuit Capacity and X/R ratio on Voltage Stability in a Distribution Network Connected Wind Power Plant”, International Review on Modelling and Simulations.
[3] Seyed Morteza Alizadeh, Cagil Ozansoy, “An Analytical Voltage Stability Model in Site and Size Analysis for IG Wind Power Plants”, IEEE Power Engineering Letters
[4] Seyed Morteza Alizadeh, Cagil Ozansoy, “An Analytical Voltage Stability Model in Site and Size Analysis for DFIG Wind Power Plants”, IEEE Power Engineering Letters
Table of Contents
Abstract……….i
Student Declaration………....iv
Acknowledgements………...…...v
Publications………...………..vi
Table of Contents………...……vii
List of Figures ………...…..xii
List of Tables………..xv
Glossary and List of Acronyms……….………….xvii
Chapter 1 Introduction………...1
1.1 Background………..1
1.2 Problem statement ……….……2
1.3 Research objectives………...4
1.4 Research methodologies and techniques……….5
1.5 Research contribution and significance………...8
1.6 Thesis structure………9
Chapter 2 Literature Review on Site and Voltage Stability Analysis in WPPs.…..11
2.1 Introduction………...11
2.2 Wind energy systems and interconnection into distribution systems………14
2.2.1 Power quality standards – Voltage……….14
2.2.2 Voltage stability challenges in WPPs…....……….16
2.3 Voltage regulation in WPPs……….……….18
2.3.1 Effect of generator type on voltage ………...19
2.3.1.1 Types 1 and 2………...20
2.4 Interconnection site selection….………...24
2.4.1 Analytical approaches……….24
2.4.2 Artificial intelligence approaches………...25
2.4.3 Mathematical formulation for selecting PCC location…..……….27
2.5 Significance of the Short Circuit Ratio ……….29
2.5.1 Effect of SCR on voltage control ………..29
2.5.2 Worldwide projects………...31
2.6 Significance of the X/R ratio in distribution systems………34
2.6.1 X/R value………35
2.6.2 Impact of X/R effect on voltage variations………38
2.6.3 X/R-Based voltage control schemes………...43
2.7 Conclusion………45
Chapter 3 Voltage Stability Analysis at the Point of Common Coupling…………48
3.1 Introduction………...48
3.2 Basic theory………...50
3.3 Test distribution systems………...53
3.3.1 Source and distribution transformer………...55
3.3.2 Wind power plant………...55
3.3.3 Reactive power compensator………..56
3.3.4 Load………56
3.3.5 Distribution lines………57
3.4 PV and QV analysis………...……58
3.4.1 PV analysis……….59
3.4.1.1 IG-Based WPP……….60
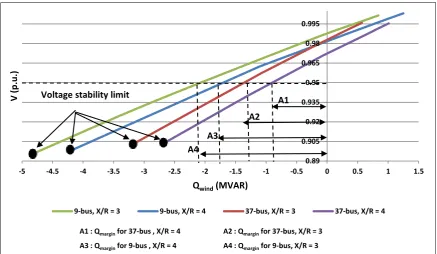
3.4.2 QV analysis………69
3.4.2.1 IG-Based WPP………70
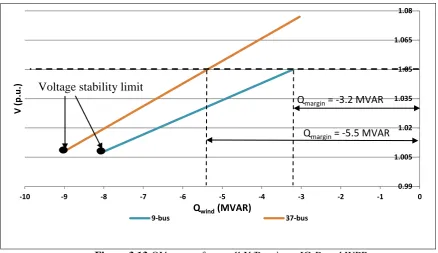
3.4.2.2 DFIG-Based WPP………74
3.5 PQ analysis………77
3.6 Effect of SCR and X/R ratios on voltage profile………...80
3.7 Conclusion………...82
Chapter 4 Genetic Algorithm-Based Analytical Model for the PCC Voltage Stability Analysis ………..86
4.1 Introduction………...86
4.2 Voltage versus X/R ratio characteristic……….87
4.2.1 IG-Based WPP………90
4.2.2 DFIG-Based WPP………...91
4.3 Developing mathematical relations………...93
4.3.1 General form of alternative functions for IG-Based WPPs………93
4.3.2 General form of alternative functions for DFIG-Based WPP………97
4.3.3 Genetic Algorithm………..98
4.3.4 Fitness function……….101
4.3.5 GA parameters………..104
4.3.5.1 Selection………104
4.3.5.2 Crossover ………...105
4.3.5.3 Elite count………..106
4.3.5.4 Mutation……….106
4.3.6 GA outcomes………107
4.4 Evaluation of the accuracy of the proposed alternative equations..………109
4.4.2 Graphical representations………..………..111
4.5 Voltage stability analytical mode………..………..117
4.6 Conclusion………...121
Chapter 5 Validation of the Proposed Analytical Model……….124
5.1 Introduction……….124
5.2 Validation process………...125
5.3 Validation studies for IG-Based WPP……….126
5.3.1 Voltage profile prediction in IG-Based WPPs……….129
5.3.2 Step-voltage variation prediction in IG-Based WPPs………..130
5.3.3 IG-Based WPP maximum allowable sizing prediction………132
5.4 Validation studies for DFIG-Based WPPs………..135
5.4.1 Voltage profile prediction in DFIG-Based WPPs………137
5.4.2 Step-voltage variation prediction in DFIG-Based WPPs……….137
5.4.3 DFIG-Based WPP maximum allowable sizing prediction………...139
5.5 Conclusion………...141
Chapter 6 Development of the Proposed Analytical Model for Different Operational Scenarios……….143
6.1 Introduction……….143
6.2 Development of the analytical model for different VPCC_initial………..…...144
6.3 Validating proposed equations for different VPCC_initial values………153
6.3.1 Voltage profile prediction……….153
6.3.2 Step-voltage variation prediction………..154
6.3.3 WPP maximum allowable sizing prediction………....156
6.4 Further validation studies………157
6.4.2 Voltage profile prediction for the new test systems……….161
6.4.3 Step-voltage variation prediction for the new test systems………..162
6.4.4 WPP maximum allowable sizing prediction for the new test systems………….165
6.5 Conclusion………...166
Chapter 7 Conclusions and Future Work.………168
7.1 Introduction……….168
7.2 Key contributions of the research………170
7.3 Future work………..173
References……….177
Appendix A MATLAB/Simulink Models of Test Systems..……….191
Appendix B Test Systems Specifications………...………193
List of Figures
Figure 2.1 Single line diagram of a distribution system connected WPP [54]……..16
Figure 2.2 Thévenin equivalent circuit of distribution system [11]………..17
Figure 2.3 A three phase distribution line [104]..………..……36
Figure 2.4 Step-voltage variations versus SCR for different X/R ratios [57]………40
Figure 2.5 Limit of ρ and X/R for 0.95 p.u.<VPCC<1.05 p.u. in a SQIG-Based WPP [56]..41
Figure 2.6 Limit of ρ and X/R for 0.95 p.u.<VPCC<1.05 p.u. in a DFIG-Based WPP [56]..41
Figure 3.1 Phasor diagram of the PCC voltage variation [131]………...51
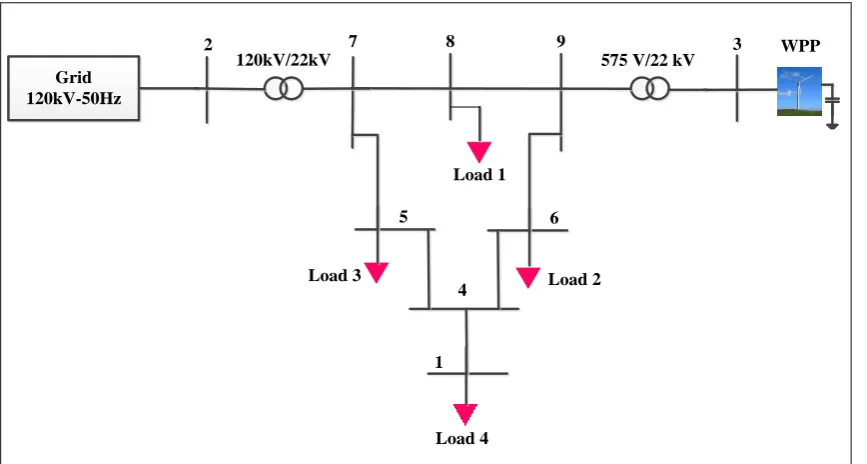
Figure 3.2 Single-line diagram of the modelled 9-bus test distribution system……54
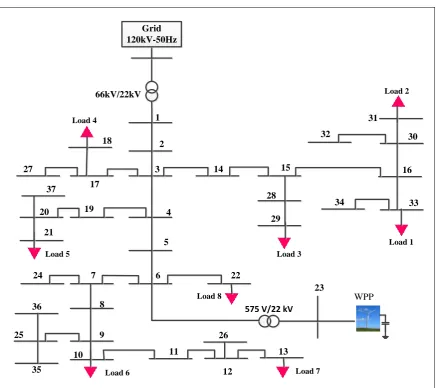
Figure 3.3 Single-line diagram of the modelled 37-bus test distribution system…..55
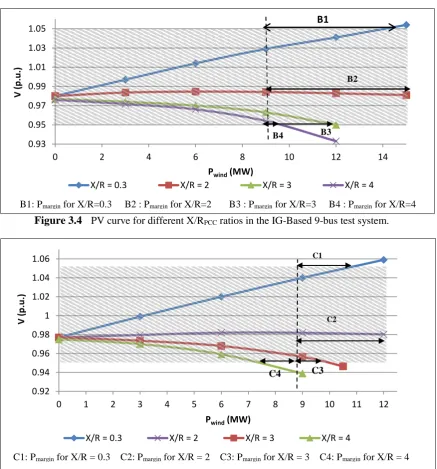
Figure 3.4 PV curve for different X/RPCC ratios in the IG-Based 9-bus test system…...60
Figure 3.5 PV curve for different X/RPCC ratios in the IG-Based 37-bus test system….60 Figure 3.6 Voltage variation versus active power injection for different X/R ratios at the PCC of the IG-Based 9-bus test system………..61
Figure 3.7 Voltage variation versus active power injection for different X/R ratios at the PCC of the IG-Based 37-bus test system………61
Figure 3.8 PV curve for different X/R ratios at the PCC of the DFIG-Based 9-bus test system………65
Figure 3.9 PV curve for different X/R ratios at the PCC of the DFIG-Based 37-bus test system……….65
Figure 3.10 Voltage variation versus active power injection for different X/R ratios at the PCC of the DFIG-Based 9-bus test system……….66
Figure 3.11 Voltage variation versus active power injection for different X/R ratios at the PCC of the DFIG-Based WPP 37-bus test system………….……....66
Figure 3.12 QV curves for large X/R ratios – IG-Based WPP………70
Figure 3.13 QV curves for small X/R ratios – IG-Based WPP………...…73
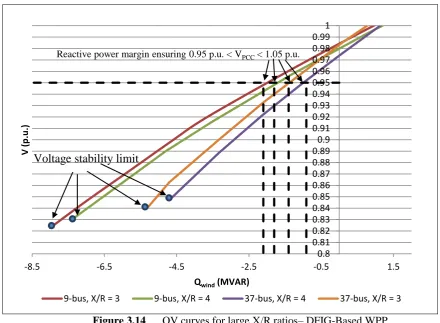
Figure 3.14 QV curves for large X/R ratios– DFIG-Based WPP………...75
Figure 3.16 PQ curves for different X/R ratios when VPCC = 0.95 p.u…..……...…...78
Figure 3.17 VPCC-SCR characteristic in the IG-Based 9-bustest system………80
Figure 3.18 VPCC-SCR characteristic in the IG-Based 37-bus test system….……...80
Figure 3.19 VPCC-SCR characteristic in the DFIG-Based 9-bus test system..……….81
Figure 3.20 VPCC-SCR characteristic in the DFIG-Based 37 bus test system...…..81
Figure 4.1 VPCC-X/RPCC characteristic for each test system – IG-Based WPP……..90
Figure 4.2 VPCC-X/RPCC characteristic for each test system – DFIG-Based WPP….91 Figure 4.3 Characteristic of the alternative Eqs. (4.1) and (4.2)………95
Figure 4.4 Flowchart of the GA concept [146, 147]………...99
Figure 4.5 V-X/R graphs obtained by Eqs (4.20) and (4.21) for Test System 1….112 Figure 4.6 V-X/R graphs obtained by Eqs (4.20) and (4.21) for Test System 2….112 Figure 4.7 V-X/R graphs obtained by Eqs (4.20) and (4.21) for Test System 3….113 Figure 4.8 V-X/R graphs obtained by Eqs (4.20) and (4.21) for Test System 4….113 Figure 4.9 V-X/R graphs obtained by Eqs (4.22) and (4.23) for Test System 1….114 Figure 4.10 V-X/R graphs obtained by Eqs (4.22) and (4.23) for Test System 2….114 Figure 4.11 V-X/R graphs obtained by Eqs (4.22) and (4.23) for Test System 3….114 Figure 4.12 V-X/R graphs obtained by Eqs (4.22) and (4.23) for Test System 4….115 Figure 4.13 V-X/R graphs obtained by Eqs (4.24) and (4.25) for Test System 1….116 Figure 4.14 V-X/R graphs obtained by Eqs (4.24) and (4.25) for Test System 2….116 Figure 4.15 V-X/R graphs obtained by Eqs (4.24) and (4.25) for Test System 3….116 Figure 4.16 V-X/R graphs obtained by Eqs (4.24) and (4.25) for Test System 4….117 Figure 5.1 PV characteristic for Scenarios 1 and 2………..127
Figure 5.2 PV characteristic for Scenarios 3 and 4………..127
Figure 5.3 PV characteristic for Scenarios 5 and 6………..127
Figure 5.4 PΔV characteristic for Scenarios 1 and 2………...128
Figure 5.6 PΔV characteristic for Scenarios 5 and 6………...128
Figure 5.7 Predicted and simulated Pmax-wind for Scenarios 1 to 6…………..……..134
Figure 5.8 PV characteristic for Scenario 7……….135
Figure 5.9 PV characteristic for Scenario 8……….135
Figure 5.10 PV characteristic for Scenario 9……….136
Figure 5.11 PV characteristic for Scenario 10………...136
Figure 5.12 PΔV characteristic for Scenario 9………...138
Figure 5.13 Predicted and simulated Pmax-wind for Scenarios 7 to 10……….…141
Figure 6.1 PV characteristic for Scenario A………145
Figure 6.2 PV characteristic for Scenario B………146
Figure 6.3 PV characteristic for Scenario C………146
Figure 6.4 PV characteristic for Scenario D………146
Figure 6.5 PV characteristic for Scenario E……….147
Figure 6.6 PV characteristic for Scenario F……….147
Figure 6.7 PV characteristic for Scenario G………147
Figure 6.8 PV characteristic for Scenario H………148
Figure 6.9 PΔV characteristic for Scenarios B and E………..155
Figure 6.10 Predicted and simulated Pmax-wind for Scenarios A to H………..157
Figure 6.11 PV characteristic for Tests 5 and 6. ………...159
Figure 6.12 PV characteristic for Tests 7 and 8……….159
Figure 6.13 PV characteristic for Tests 9 and 10………...159
Figure 6.14 PV characteristic for Tests 11 and 12…..………...160
Figure 6.15 PΔV characteristic for Tests 6 and 10………163
List of Tables
Table 2.1 Indicative planning levels for step-VPCC changes as a function of the
number of such changes per hour [50, 51]………...15 Table 2.2 Summary of NEM installations based on Type 1 and Type2 WTGs [60]….21 Table 2.3 Voltage control requirement and X/R values in distribution networks [10]…...37 Table 3.1 SCC value in 9-bus and 37-bus test feeders……….59 Table 3.2 Active power margin ensuring 0.95 p.u.< VPCC <1.05 p.u. in the IG-Based
9-bus system………...………..62 Table 3.3 Active power margin ensuring 0.95 p.u.<VPCC <1.05 p.u in the IG - Based
37-bus system………...……62 Table 3.4 Step-voltage variation in the IG-Based 9-bus test system………63 Table 3.5 Step-voltage variation in the IG-Based 37-bus test system………..63 Table 3.6 Step-voltage variation in the DFIG-Based 9-bus test system…………...67 Table 3.7 Step-voltage variation in the DFIG-Based 37-bus test system………….68 Table 3.8 Reactive power margin ensuring 0.95 p.u.< VPCC <1.05 p.u…………....71 Table 3.9 Maximum active and reactive power generated or absorbed by the WPP
for VPCC = 0.95 p.u………..….79
Table 4.1 Topology and SCR value for each for test distribution system…………88 Table 4.2 Characteristics considered for developing mathematical relations for
Table 5.3 Error between simulated and predicted ΔVPCC for Scenarios 1 to 6…..131 Table 5.4 Error between simulated and predicted VPCC profile for Scenarios 7 to 10…..137
Table 5.5 Error between simulated and predicted ΔVPCC for Scenarios 7 to 10……..139
Table 6.1 PCC parameters for Scenarios with new VPCC_initial values…...145 Table 6.2 Final proposed voltage stability analytical model………..153 Table 6.3 Error between simulated and predicted VPCC profile for Scenarios A to H…...153
Table 6.4 Error between simulated and predicted ΔVPCC for Scenarios A to H...156 Table 6.5 New test systems topologies, PCC parameters, and VPCC_initial values...158 Table 6.6 Error between simulated and predicted VPCC profile for Tests 5 to 10…....161
Glossary and List of Acronyms
AEMO Australian Energy Market Operator DFIG Double Fed Induction Generator
GA Genetic Algorithm
Isc Short Circuit Current
IG Induction Generator
MAE Mean of Absolute Error
MRE Mean of Relative Error
NEM National Electricity Market
Pmargin Active power margin
Pwind Wind Active Power
Pmax-wind WPP maximum permissible size ensuring the grid
code requirements
PQ Power Quality
PV Power-Voltage
Qmargin Reactive Power Margin
Qwind Wind Reactive Power
QV Reactive Power-Voltage
R&D Research and Development
RL Resistor-Inductor
SCC Short Circuit Capacity
SCR Short Circuit Ratio
VPCC PCC Bus Voltage
VPCC_initial Initial steady-state voltage level at the point of
power plant connection
WPP Wind Power Plants
WTG Wind Turbine Generator
X/RPCC Short circuit impedance angle ratio seen at the point of common coupling
Zsc Grid Short-Circuit impedance
ΔVPCC Step-voltage variation at the point of common
coupling due to the change of wind power generation
∆Q Reactive power variation
ρ Integration level
Chapter 1
Introduction
1.1 Background
Currently, many countries are faced with increasing demands of electricity, but yet limited petroleum resources. Environmental concerns due to the release of
greenhouse gas emissions in fossil fuel combustion have become a major issue all over the world [1]. These concerns have resulted in a trend towards higher penetration of
renewable energy generation systems in power networks and more investment in these types of energy resources [2-5]. Wind power is one of the fastest growing and abundant renewable energy resources. In relation to the advantages of wind power, it could
constitute an easily available, cost effective, sustainable, and environmentally-mild energy source [6]. The global wind capacity in 2014 was around 370 GW, 16 percent
higher than the capacity in 2013. It increased by 17 percent to around 433 GW in 2015 and leaped to a new peak at around 487 GW in 2016. Considering the advancement of the wind industry and the increased size of Wind Power Plants (WPPs) all over the
world, more research and investigations are needed and are being carried out into the design, control, and interconnection of WPPs to power systems [7].
A significant portion of wind power is being installed in distribution networks as small WPPs. In a distribution network, the network short circuit impedance angle ratio, called the X/R ratio, is one of the most important characteristics that can be calculated at
any point looking back to the distribution substation. Short Circuit Capacity (SCC) is another important characteristic of a distribution network. SCC determines the amount
the overall system X/R depends on the location of the PCC point. Moreover, research in the literature has demonstrated that there is a close relation between the distribution
network characteristics (X/R seen at the PCC and SCC) and the voltage stability at the PCC connection point [9-12]. Considering the close relation between PCC location, PCC parameters, and PCC bus voltage stability, the WPP size and interconnection site
selection must ensure the voltage stability requirements.
This thesis focuses on the issues concerned with the interconnection of WPP to
distribution network and develops a novel analytical model to simplify WPP site allocation and voltage stability analysis in distribution systems.
1.2 Problem statement
As discussed in the previous section, X/R and SCC are the most important
parameters seen from a given point of a distribution network. A thorough literature review about the significance of SCC and X/R seen from a given PCC point in PCC bus voltage stability has been performed in Chapter 2. The majority of the works in the
literature dealt with the impact of the PCC parameters on voltage in general terms and using simple scenarios.
The X/R ratio in distribution lines is considerably smaller than that in transmission lines as the value of line resistance is high and near to line reactance [12, 13]. On the other hand, conventional approaches applied for voltage regulation through
reactive power compensation are mainly based on the reactance of the distribution impedances and the resistance is ignored. Hence, these approaches are not appropriate
distribution networks, especially in terms of voltage stability under the existing reactive power control schemes.
The value of SCC at a given point depends on nominal voltage and the inverse of the equivalent impedance value seen from that point [8]. In a distribution network connected WPP, the ratio between SCC of the system and rated wind active power
(Pwind) is called Short Circuit Ratio (SCR). SCR signifies the amount of Pwind that can be
injected to the distribution network without an adverse impact on voltage stability and
Power Quality (PQ) at the PCC [14]. Larger values for the SCR parameter indicate lower PQ concerns. However, the SCR value in distribution networks connected WPP is generally small. The reason is the fact that, from planning and operation perspectives,
one of the motivations for allocating WPPs is to have suitable condition for collecting efficient wind power. However, sites with a suitable wind condition are generally
located far from the distribution substation. This makes Zeq seen at the PCC large [15].
Furthermore, the voltage value in distribution networks is smaller than that in generation and transmission networks. Hence, at the PCC point of a distribution
network connected WPP, high Zeq and small voltage value make SCC small.
Consequently, a small SCC results in small SCR values and imposes serious problems in terms of voltage stability and PQ requirements at the PCC point, especially in large
wind power penetration [11].
In each country, the electricity markets specify particular technical rules, namely
grid codes, in regards to voltage regulation according to their regional network characteristics. A comparison of several grid codes legislated in Australia, Canada, and European countries can be found in [16]. For removing the voltage stability issues
voltage (VPCC) stays within the acceptable steady-state voltage range defined by the grid
codes.
In Chapter 2, a detailed literature review has been performed to envisage the recent approaches proposed for finding optimal allocation and sizing of WPPs in distribution networks. The majority of these approaches are based on modelling and
simulation of the whole system and/or calculating the bus impedance matrix (Z-bus), inverse of the bus admittance matrix (Y-bus-1), and the Jacobean matrix [17-22]. The
assumptions used for the simplifications of the calculation of these matrices are not valid in distribution systems [23]. Moreover, the simulation of distribution networks is a demanding process due to the size and complexity of these networks. Therefore,
proposing a novel method which simplifies the WPP optimal size allocation process is a noticeable gap in the literature.
1.3 Research objectives
The research presented in this thesis aimed to investigate the issues related to the
interconnection of WPP to distribution networks through detailed voltage stability analysis. To eliminate the various weaknesses of optimal WPP siting and sizing
methods proposed in the literature, an analytical voltage stability model was proposed during the course of this research. The proposed model relies on the mathematical relation between PCC bus voltage and the PCC characteristics of a distribution network
penetrated by WPP.
The specific aims of this research were to:
Model different test distribution networks based on IEEE standard distribution
Investigate the effect of the PCC characteristics of a distribution system connected
WPP on the PCC bus voltage stability through Power-Voltage (PV), Reactive
Power-Voltage (QV), Power–Reactive Power (PQ), Voltage–SCR (V–SCR), and Voltage–X/R ratio (V–X/R) analysis studies comparing and contrasting results
among the test systems.
Propose a novel voltage stability analytical model demonstrating the mathematical
relations between VPCC, Pwind, SCC, and X/R ratio seen at the PCC using a Genetic
Algorithm (GA)–Based approach.
Validate the accuracy of the proposed analytical model in predicting three
important voltage stability criteria at a given connection point of a distribution
network penetrated by wind power, including: VPCC profile, step variation of VPCC
due to the change of Pwind (ΔVPCC), and the WPP maximum permissible size
ensuring the grid code requirements (Pmax-wind).
1.4 Research methodologies and techniques
In this research, a step by step approach was followed to achieve the research
objectives mentioned above. These steps are summarised in the following. Step 1 - Literature review on voltage stability analysis in WPPs
A broad literature review on the voltage stability issues due to the interconnection of the WPPs to the distribution systems has been completed. Preparing this literature review resulted in achieving a holistic view of the existing knowledge as well as the
problems and challenges. The effect of distribution system characteristics seen from a given PCC site on VPCC stability was overviewed in details. The recent Research and
Moreover, the review of the literature focused on knowledge gaps yet to be addressed and possible future work in this field of Power/Electrical Engineering.
Step 2 – MATLAB simulation modelling for voltage stability analysis
studies
Following the wide-scoped literature review explained above, research work has been dedicated to investigate the effects of SCC, X/RPCC, and wind power injection on
VPCC stability. For this purpose, different distribution test systems were considered,
modelled and simulated using MATLAB/Simulink. The test systems are based on IEEE standard distribution models: the IEEE 9-bus and IEEE 37-bus systems. The
distribution network topologies and the PCC bus location, as well as the PCC parameters (X/RPCC and SCC) values are different amongst the test models. The
designed simulation models are then used to carry out voltage stability analysis studies
regarding different PCC parameters. Analysis studies were carried out for two common two types of WTGs: Induction Generator (IG) and Double Fed Induction Generator
(DFIG). This step was particularly important to analyse the behavior and effects of such parameters on the VPCC stability since the proposed analytical model has to account for
them. The development of the proposed voltage stability analytical model was heavily
based on these findings.
Step 3 - Design of a novel voltage stability analytical model
Once the necessary investigations concerned with the effect of PCC location and the value of the PCC parameters on the VPCC stability was completed, a novel voltage
stability analysing method has been designed. This new method is based on an analytical model considers a series of mathematical relations between PCC bus voltage,
numerical relation between VPCC and X/RPCC in different test systems with different
SCR values. In each test system, the X/RPCC ratio was changed to monitor the VPCC
profile for each X/RPCC value in a fixed SCR network. The obtained numerical results
were used to plot the VPCC-X/RPCC characteristics for each test system. Taking the
advantage of the VPCC-X/RPCC characteristics, a series of equations were developed to
show the general forms of the mathematical relations between VPCC, X/RPCC, and SCR.
This was the first step before further detailed studies on the proposed numerical models
could be conducted. At this step, the values of the coefficients of the equations were not determined.
Later on, a GA based approach was used to determine the values of the
coefficients of the developed equations for the lowest deviation with respect to the reference V-X/R characteristics obtained in the first step. Considering that the SCR ratio
is the ratio between the grid SCC and the power injected by the WPP, the proposed equations were rewritten in terms of VPCC as a function of X/RPCC, SCC, and wind
active power. These equations enabled to estimate the VPCC value for different wind
power penetrations at a given PCC site with specific SCC and X/RPCC values.
Furthermore, the equations were developed in terms of wind active power as a function of VPCC and PCC parameters, which enabled to calculate the maximum power that could
be injected by the WPP to a given connection point ensuring that the PCC voltage stays within the acceptable steady–state range defined by the grid codes.
Step 4 - Validation and development of the proposed analytical model
penetration, ΔVPCC, and Pmax-wind. In this regards, the proposed equations were initially
verified using different scenarios based on the test systems designed and simulated in Step 3. Later on, it was shown how the proposed equations could be developed for predicting voltage stability criteria in new test distribution systems with different PCC
characteristics and parameters. The presented validation results confirmed the high capability of the proposed equations in predicting the voltage stability criteria at a given
connection site of a distribution network penetrated by WPP.
1.5 Research contribution and significance
As the main contribution of this research, very informative mathematical equations have been proposed to simplify the initial WPP site and size analysis
challenge and enable engineers compute an initial predictive assessment on the voltage stability at a given connection point without the need to carry out complex and time
consuming computational tasks or modelling of test systems. In summary, the major contributions of this thesis are:
Investigation into the impact of the WPP interconnection on PCC bus
voltage stability
This research addresses issues concerned with the interconnection of WPPs to
distribution networks through detailed voltage stability, PQ, QV, PQ, V-SCR, V-X/R analysis studies. The analysis provided a holistic view about the impact of PCC
parameters on PCC voltage stability in grid connected WPPs.
Development of mathematical equations for projecting VPCC and ΔVPCC
The detailed development of the mathematical relations between VPCC, SCC,
important contribution for achieving an analytical model that enable to conduct an initial predictive assessment on voltage stability and predict the value of voltage and
step–voltage variation in response to the change of wind power at a potential PCC bus in a distribution network connected to WPP.
Development of mathematical equations for projecting WPP maximum
allowable size
A series of mathematical equations were developed to estimate the maximum
power which can be injected to the distribution system while the PCC bus voltage stays within the acceptable steady–state range. PCC parameters, which can be easily
calculated at any point looking back to the distribution substation, are the only unknown of the proposed equations. PCC parameters can be easily computed using power flow analysis software. Hence, the proposed equations enable to promptly compute the size
of a WPP without the need to solve complex and time consuming computational tasks.
1.6 Thesis structure
Chapter1 gives an overview of the thesis, its objectives and contribution to the knowledge. It also sheds some light on the methodologies used in the research.Chapter
2 provides a comprehensive literature review with regard to the interconnection of the WPPs to the distribution systems and introduces the concepts of X/R ratio at a given
PCC point (X/RPCC), SCC, and SCR. Furthermore, it envisages the recent techniques
and approaches used for optimal placement and sizing of WPP in distribution systems.
Correspondingly, the knowledge gaps and potential research directions for future development in this field have been identified.
Following this review and the detection of the research field, Chapter 3
point of a distribution system connected WPP. For this purpose, PV, QV, PQ, and V-SCR analysis studies have been carried out using test systems simulated in
MATLAB/Simulink. The test systems are based on IEEE distribution models connected IG and DFIG-Based WPPs.
As the main contribution of this research, in Chapter 4, a novel voltage stability
analytical model was developed to show the mathematical relations between VPCC,
X/RPCC, SCC, and Pwind. The proposed model consists of six equations developed for
predicting the most important voltage stability criteria regarding the WTG type and the range of X/RPCC. Three equations were proposed to calculate the voltage profile and the
step variation of voltage due to the change of wind power injection at a given
connection point. Furthermore, three equations were proposed to estimate the maximum wind power could be injected to the grid while the VPCC is maintained within the
acceptable steady–state range.
Chapter 5 gives the details of the simulation works and numerical analysis studies undertaken to validate and confirm the intellectual contributions made in the preceding
Chapters. Validation studies have been carried out using different scenarios based on test systems designed in Chapter 4 to evaluate the capability of the proposed model in estimating and calculating the considered voltage stability criteria.
Upon validating the proposed voltage stability analytical model for the test systems designed in Chapter 4, the model is further developed in Chapter 6, such that it
satisfies new test distribution systems with different PCC parameters. Also, the developed model will be validated using different scenarios involving a wide range of operating conditions. Finally, Chapter 7 summarises the whole research work,
Chapter 2
-
Literature Review on Site and Voltage
---
Stability Analysis in WPPs
2.1 Introduction
Distribution networks are one of the most important parts of the electrical
networks as they are the interface between transmission system and individual consumers. Distribution systems must supply the consumer demand with an appropriate
quality and continuity [24]. This signifies that a distribution network service provider must provide the requirements and limitations concerned with supply voltage range, voltage fluctuations, voltage dips, and step voltages [25].
The ability of a power system in providing proper supply of electrical energy, expressed as the reliability of that system, is an important factor in the designing and
planning process [26]. Power shortage due to an unexpected mismatch between generation and demand is the most important concern in systems with low reliability. Apart from low reliability, power shortage happens as a result of voltage instability [27,
28]. The system enters into a state of voltage instability when the increase in load or changes in the system condition results in a continuous decrease in voltage. A
distribution feeder has to ensure a high quality power supply to customers connected on that feeder with an appropriated voltage profile. Furthermore, a distribution network service provider has to ensure minimum loss in transferring power from source to the
customers. Hence, three main criteria in the planning and design of distribution networks are increasing the reliability of the distribution system, reduction of power
losses, and making improvements in the voltage profile over that network. In achieving these aims, Distributed Generation (DG) could play a key role. DG can reduce power
[29, 30]. DG technology was principally used as a backup power source to supply electricity for individual customers during grid power outages. Nowadays, the recent
advances in DG technologies enabled this power solution not only to feed small personal customers but also support the entire network in parallel with the grid.
Wind power is one of the fastest growing and abundant renewable energy
resources. It constitutes an easily available, cost effective, sustainable, and clean energy source [6, 31, 32]. Large installations of Wind Power Plants (WPPs) are often
connected to transmission networks. However, a significant portion of wind power is being installed in distribution systems as small WPPs. The impact of WPPs on reducing power losses, voltage stability improvement, and increasing the reliability of the system
are very critical in designing WPPs. However, the effect of WPPs on the voltage stability is more important than the two other criteria [33]. This effect is ignorable in
low wind power penetration. However, high wind power penetration influences the voltage stability of utility distribution networks, which is a key concern from a planning and operation perspective [34, 35] .
Works in the literature have shown that there is a relation between size and location of WPPs, voltageprofile and voltage variation due to the change wind power generation [10, 36-39]. Allocating WPPs in traditional distribution systems may inflict
unwanted challenges in terms of voltage stability and PQ concerns. In traditional distribution networks, voltage profile at the buses is generally close to the boundaries of
the allowable steady-state voltage range [14]. This adversely impacts on the system security [15]. Under these circumstances, the size and location of WPPs connected to distribution systems must ensure the voltage stability limitations [10, 36, 40, 41].
stability requirements and save extra costs concerned with voltage regulation. Therefore, correct WPP size allocation is of great importance in designing and planning process.
Many researchers have proposed different approaches to find optimal siting and sizing of WPPs in distribution networks. Most are based on Artificial Intelligence (IA) approaches. Few other solutions are based on analytical approaches or Optimal Power
flow (OPF) [17, 42-45]. However, the main drawback of these studies is the need to compute large dimensional matrices or simulate and model test distribution systems,
which is computationally demanding and takes a long time [17]. As discussed, the location of a WPP has a significant impact on voltage at the connection point. As a result, many Research and Development (R&D) needs have evolved as a necessity to
allocate WPP in distribution systems. However, the problems mentioned above adversely impact the useability and simplicity of the existing WPP allocation
approaches. These problems can be eliminated through developing mathematical formula that would allow a predictive assessment of a candidate Point of Common Coupling (PCC) by studying the relations between PCC voltage (VPCC) and the key
characteristics of distribution networks. This is highly recommended in [46]. Development of such mathematical formulations would ideally remove the need to simulate the test systems and collect data pertaining to different components of the
system, and serve as a preliminary assessment tool.
A distribution system is characterised by different parameters. Short Circuit
Capacity (SCC) is one of the most important parameters of a system, which measures the amount of power flowing at a specific point in case of a short circuit [8]. The ratio between SSC of the system and rated power of the WPP is called Short Circuit Ratio
without affecting PQ at the PCC [14]. Another important factor to characterise the distribution system is the system short circuit impedance angle ratio, called the X/R
ratio. The X/R ratio, a means of expressing the Power Factor (PF) of the source system, is simply the ratio of the system reactance to the system resistance, and can be calculated at any point looking back to the power source [11]. It is important because it
affects the operation of a power system network [41].
This chapter presents a detailed review of the literature with regard to the
interconnection of the WPPs to the distribution systems by outlining the existing knowledge as well as the problems and challenges being encountered. It also provides an overview of mathematical formulations between VPCC and most important parameters
of distribution networks, i.e. SCR and X/R ratios. Finally, it focuses on knowledge gaps yet to be addressed and possible future work in this field of Power/Electrical
Engineering.
2.2 Wind energy systems and interconnection into distribution systems
The increase in wind power penetration in power systems necessitates methods and schemes to control WPPs similar to the way that conventional power plants are
controlled [47]. This signifies that the interconnection of WPPs to power grids have to satisfy grid code requirements. This section investigates challenges concerned with voltage stability in WPPs according to the acceptable voltage ranges defined by
Australian grid code.
2.2.1Power quality standards - Voltage:
Interconnection of the WPPs to distribution networks must ensure that VPCC is
such as UK, Australia, and Canada [48, 49], the acceptable steady-state voltage range at the PCC of a power system connected to rotating electrical machines, specifically
WTGs, is between 95% and 105% of network rated voltage (0.95 p.u. ≤ VPCC ≤ 1.05
p.u).
Apart from VPCC profile, the magnitude of VPCC fluctuation is another important
criterion has to be considered in the interconnection of WPPs to distribution systems. This signifies that the step voltage variation as response to the change, either increase or
decrease, of wind power injection must be maintained within acceptable levels defined by the grid code. Table 2.1 includes a list of recommended limits for step voltage changes at a given PCC point regarding the grid voltage level [50, 51]. In Table 2.1,
medium voltage refers to V < 44 kV and high voltage refers to V > 44 kV.
Table 2.1 Indicative planning levels for step-VPCC changes as a function of the number of
such changes per hour [50, 51].
Number of Changes per hour (n) Step voltage variations (%)
High Voltage (HV) Medium Voltage
n < 1 4 3
1 < n ≤ 10 3 2.5
10 < n ≤ 100 2` 1.5
100 < n < 1000 1.25 1
Distribution networks are classified as MV networks. As shown in Table 2.1, the
step-VPCC variation in MV networks should normally be maintained around 3%.
According to the grid code requirements in regards to voltage control, it is concluded that at the point of common coupling, and under normal operating conditions, voltage
2.2.2 Voltage stability challenges in WPPs
The continuous increase in wind power penetration is likely to influence the operation of distribution networks, especially in terms of voltage stability [52, 53].
Figure 2.1 shows a simple single line diagram of a WPP connected to a distribution network [54]. According to Figure 2.1, each Wind Turbine Generator (WTG) has a transformer to increase the WPP voltage to the level of the distribution system voltage.
WTGs are connected to the distribution system through one of the network buses, called PCC bus. Reactive power compensators are often used at the PCC to regulate the
voltage and maintain it within the normal operation range. From Figure 2.1, the distribution line is modelled using its reactance (X) and resistance (R) values, and the line capacitance is usually ignored.
Wind turbine transformer
Wind turbine
generator Point of Common Coupling (PCC)
Other feeders
Higher voltage grid
Reactive power compensator
Distribution transformer Distribution lines
Wind turbine generator
Wind turbine transformer
X R
Figure 2.1 Single line diagram of a distribution system connected WPP [54].
connected in series with a Thévenin equivalent impedance. Figure 2.2 shows the Thévenin equivalent circuit of the distribution system as seen from PCC [11].
R
sc+ j X
scWTG
Wind farm transformer
Z
scV
thV
PCCV
WTGFigure 2.2 Thévenin equivalent circuit of distribution system [11].
In Figure 2.2, Thévenin voltage source (Vth) equals the open circuit voltage seen
from the PCC. Furthermore, all the components between PCC and the distribution
substation can be modelled using an equivalent Thevenin impedance, so called the grid short circuit impedance (Zsc). Thévenin theorem signifies that the system short circuit
impedance is the ratio between the Thévenin voltage source (Vth) and three phase short
circuit current (Isc) at the given point.
As discussed, the system short circuit impedance angle ratio, namely the X/R ratio,
is one of the most important characteristics of the system [55]. Existing technologies used for voltage regulation through reactive power control are mainly based on the reactance of the distribution impedances and the resistance is ignored. Hence, these
approaches are most appropriate for transmission systems where the value of the line reactance is greater than the line resistance resulting in a high system X/R value [32].
However, in distribution systems, the line reactance is low resulting in a low X/R ratio. This often hinders the feasibility of common reactive power compensation schemes and other, unconventional, ways of voltage control may need to be used [26].
sc rated sc
rated
Z V I
V SSC
2
) ( 2 3 2
3
(2.1)
Where Vratedis the rated voltage of the system, which is normally 1 p.u.
The SCR is the ratio of the grid short circuit power level to the WPP MVA rating
as shown in Eq. (2.2):
rated
P SSC MVA
Farm Wind Rated
Level Power Circuit
Short Grid
SCR (2.2)
Generally, systems with an SCR greater than 20 are rated as stiff systems where grid code requirements are met [11].
Referring to Eq. (2.2), the value of SCC at a given point mainly depends on the
rated voltage and the inverse of the absolute value of the equivalent impedance seen at this point [8]. Considering that sites with good wind conditions are generally located far
from the substation, WPPs are usually connected to grids through long lines making Zsc
seen at the PCC large [54], which results in a small SCC at the PCC. Referring to Eq. (2.2), a low SCR value is therefore common in WPPs due to the high grid impedance
and low SCC. This leads to PQ concerns such as poor voltage regulation, voltage dips and voltage swells depending on the network strength, connected generation capacity,
type of the generator, and etc [52].
2.3 Voltage regulation in the WPPs
Existing technologies used for voltage control are based on reactive power compensation. The cost of voltage control through reactive power compensation is one
or dynamic) [58]. This problem is more critical in the small WPPs connected to the distribution system, where investors try to save costs as much as possible.
Another disadvantage of voltage regulation through reactive power compensation is that it decreases system reliability [53]. Generally, a system controller coupled with the generators controls real and reactive power generated by individual generators based
on the thermal capability and/or voltage limits of the individual generators. WTGs interpret received commands and excite their generators to produce the reference
reactive power. Real and reactive power commands are received by the system controller from a utility grid operator [59]. Considering that the WPP is usually at the terminal of grid, communication between the grid operator and control system for
exchanging the commands is a big challenge and adversely impacts on the voltage stability margin [53].
As discussed above, voltage regulation approaches through reactive power control suffer from economic and technical problems. Therefore, investigation of the factors that impact on the voltage stability is critical in the interconnection of WPPs to
distribution networks. One of the important factors that affect the VPCC of the WPPs is
the type of the generator connected to the wind turbine. The following sub-sections review the effect of WTG type on voltage stability.
2.3.1Effect of generator type on voltage
There are various WTG designs, classified by machine type and control speed capabilities, which can be used in WPPs. Modern WPPs utilize machines that are
designed to harvest the highest energy from wind. However, older types of WTGs have widely been installed and are expected to continue to operate for the remainder of their
the WPPs. The advantages and disadvantages of each type are discussed in terms of the capability of the generator in voltage regulation, cost, and etc.
2.3.1.1 Types 1 and 2
The use of Induction Generators (IGs) connected directly to the distribution network is one of the simplest approaches of running a WPP. In this case, WTGs are categorised into two types. Type 1 is fixed-speed wind turbine based on Squirrel Cage
Induction Generator (SCIG). This type of WTGs can run within a speed range which is very close to the synchronous speed. Hence, it is required that the turbine blades rotate
at a nearly constant speed.
The second type of IG-Based wind turbines are semi variable-speed wind turbine based on wound rotor IG. In this construction, a thyristor-controlled variable resistance
is connected to the rotor windings. Taking the advantage of thyristor-controlled variable resistance, the generator operating point can be adjusted up to 10% greater than the
synchronous speed. Type 2 wind turbine generators are generally preferred to Type 1. However, in both constructions, the generators cannot control reactive power and require reactive power support for magnetization [61].
Despite the incapability of IGs in reactive power control and voltage regulation, there are numerous installations of WPPs based on IGs throughout the world. The main
advantages of IG are: simple construction, low cost, maintenance and operational simplicity, self-protection against overload and faults, etc. [62]. There are many SCIG based fixed speed WPPs operating across USA, India, and Canada with significantly
installations in Australia are based on Types 1 or 2 [60]. Most of these installations are located in New South Wales (NSW), South Australia (SA), Tasmania (TAS), and
Victoria (VIC). Few of these installations have been listed in Table 2.2 including the name of the WPP installation, region, overall size, manufacturer name, generator type and model [60].
Table 2.2 Summary of NEM installations based on Type 1 and Type2 WTGs [60].
Name Region
Capacity
(MW) Factory Model Type
Blayney Wind Farm NSW 9.9 Vestas V47 2
Lake Bonney Stage 1 wind farm SA 80.5 Vestas V66 2
Woolnorth Wind Farm Stages 1 and 2 TAS 54 Vestas V66 2
Toora Wind Farm VIC 21 Vestas V66 2
Starfish Hill Wind Farm SA 34.5 NEG Micon NM64 1
Challicum Hills VIC 52.5 NEG Micon NM64 1
As mentioned, IGs cannot supply reactive power. Therefore, the required reactive power is drawn from an external source such as grid. The absorption of reactive power from the grid reduces the voltage at the system buses. If the reactive power absorption
reduces the voltage below the supply range, then another reactive power source would be required to compensate for the lack of reactive power and regulate the voltage. In this
the use of case, fixed capacitor banks is the simplest method for reactive power control in IGs. However, the use of IGs with fixed capacitor banks increases the risk of self-excitation during off grid operation [63].
Apart from capacitor banks, Flexible Alternating Current Transmission System (FACTS) devices are also used to improve the voltage regulation process. Static Var Compensator (SVC) and Static Synchronous Compensators (STATCOMs) are the most
common types of FACTS devices used in the power system. However, the main disadvantage of the former is that SVC provides reactive current proportional to the
poor operation of SVCs and fixed capacitor banks is more critical when the Wind Energy Converters (WECs) do not have the Under-voltage Ride Through capability.
To overcome the problems caused by SVC, Static Synchronous Compensators (STATCOMs) have been applied in most of the WPPs. The works discussed in [65-67] proposed a reactive power control scheme based on STATCOM and Battery Energy
Storage System (BESS) in a grid connected wind power system. The BESS is used as an energy storage source to control voltage. The shunt connected STATCOM with
battery energy storage is connected with the interface of IG and load at the PCC in the grid system. The BESS naturally maintains DC capacitor voltage constant and sustains the real power source under fluctuating wind power. However, high costs for electrical
infrastructure and additional energy storage system and the costs for STATCOM maintenance are the disadvantages of these approaches [58]. These costs could be saved
using WEC with "STATCOM inside" capability [68, 69]. With this technology, the grid operator has the opportunity to constantly dispatch the reactive power of wind power plants. This type of STATCOMs also provides dynamic reactive power supply in the
event of faults with transient over- and under-voltages, as well as voltage vector jumps at the WEC terminals. However, additional costs for control unit and communication link are still required [58].
2.3.1.2 Types 3 and 4
Apart from IGs, Double-Fed Induction Generator (DFIG) is another common type (Type 3) of generator used in wind power systems. The main advantage of DFIG is that
by variations in the prime mover, which results in a reduction in flicker levels. These turbines however require higher maintenance when compared to SQIG machines. This
is due to the connection arrangements between the rotor and converter which consists of brushes and slip rings. Grid performance capability is not affected with these turbines. Due to the current trend of turbine installations across the NEM, which shows an
increasing popularity for the use of Type 3 machines, it is expected that by 2020 these machines will constitute a high percentage of new installations across the NEM [60].
Generators based on Full Converter (FC) are the new generation of WTGs (Type4), in which all power extracted from the wind is managed and transferred to utility grid by a power electronics converter. Enercon and Siemens introduced the
concept of FSC for Wind Turbine Systems. In this case, ABB has delivered nearly 10,000 SQIGs for FC application to leading wind turbine manufacturers since 2003.
This structure is a suitable alternative to high speed Permanent Magnetic (PM) generators as SQIGs offer robust conventional technology with good efficiency and small size [71]. However, the costs for employing a full scale power electronics
converter make Type 4 more expensive than Types 1 and 2 [72]. Currently, Type 4 WTGs are mainly used in large-scale WPPs and off-shore wind turbines [72].
Therefore, the cost for the voltage control through reactive power compensation is
a big challenge in penetrating WPPs [10, 58, 73]. This is more problematic in the weak feeders where the high impedance seen from causes many PQ concerns [52, 54].
2.4Interconnection Site Selection
It is clear that wind resources assessment, i.e. determining the annual energy production and thus the revenue, is the preliminary step of the WPP planning process. Consequently, safe and economical grid interconnection is another issue that is being
discussed upon planning the initial development of the WPP. In this respect, site selection for connecting the WPPs to the distribution network is an important phase in
the design and planning process.
Effect of DG placement on the voltage variation and power losses has been widely investigated in the literature [40, 41, 43, 45, 74, 75]. DG allocation techniques
proposed in the literature can be divided into two groups: analytical approaches and AI approaches. However, few other solutions such as mathematical approach have been
proposed in the literature. These approaches are discussed in the following sub-sections.
2.4.1Analytical approaches
In analytical approaches, an objective function is formulated in order to find the best site for the connection of a DG to the grid. Then, the objective function is
optimised in order to ensure lowest active power losses and/or maintain VPCC variation
[38].
Gozel and Hocaoglu proposed an analytical methodology for the optimal allocation of DGs in distribution systems [43]. The main idea was to minimise active power losses. The authors carried out sensitivity analysis based on the equivalent
current injection. Most analytical approaches are based on the exact power loss formula [17]. An exact formula-based solution for real power loss allocation was proposed in
these approaches are based on the inverse of bus admittance matrix (Y-bus-1), or Jacobean matrix. The calculation of the inverse of the Jacobean and Y-bus matrices is
not a serious concern thanks to various algorithm proposed for computing matrix inversion [79, 80]. The proposed algorithms avoid the need for large storage space in the digital computer and save computational time in off-line analysis. However, the
efficiency of the proposed algorithms is adversely impacted in real-time applications and/or systems with a large number of buses [17]. More importantly, the assumptions
used for the simplifications of the calculation of these matrices are often not valid in distribution systems [23]. This makes it difficult and time consuming to form the Y-bus and Jacobean matrices for distribution networks. In particular, the inverse of Y-bus
method is not applicable to distribution systems consisting of overhead lines as the shunt admittance of these kinds of lines is ignorable resulting in singular Y-bus matrix
[38, 81]. The analytical approaches reviewed in this section explored technical network related optimal placement. Few papers addressed the application of DG placement approaches considering practical issues, such as the wind resource, distance to
transmission and distribution lines, and etc [82, 83].
2.4.2Artificial intelligence approaches
Artificial Intelligence (AI) approaches are heuristic techniques exhibited by
computers. These techniques are used in complex optimization problems in order to optimise an objective function. The AI methods enable computers to mimic cognitive functions peculiar to human mind such as learning and problem solving [84].
DG optimal siting using IA based approaches has widely been investigated in the literature. For example, researchers from University Politehnica of Bucharest-Romania
IEEE 69-bus distribution test system. The aim of DG siting was to improve voltage profile after the connection of DG to the distribution system. It was demonstrated that
GA can provide better results compared with analytical approaches such as nonlinear optimization method when the number of DGs is high. However, for small number of DG units, the results acquired by both methods had similar accuracy. In fact, the
nonlinear optimization method cannot cope with the complexity of the system as the number of DG increases, whereas in GA-Based method, there is no need for
computational derivatives. However, the accuracy of GA depends on properly coding a fitness function and determining specific parameters to use [85]. The improper tuning of the parameters may increase the computational effort and adversely impact the accuracy
of results [38].
Apart from GA, other IA-Based solutions such as Artificial Bee Colony (ABC)
[20], Particle Swarm Optimisation (PSO) [21], evolution programming [22], GA and Tabu Search (GA-TS) [86] have been used in the literature in order to select the optimal place for the DG connection ensuring the lowest PQ concerns. However, a
mathematical or simulation model of the test distribution systems is required before using these methods. Considering the size and complexity of distribution networks, modelling and simulation of these systems takes a long time [17].
Apart from time consuming computational tasks, analytical and AI-Based methods consider the DG types which can inject only active power to the system while
the value of the injected or absorbed reactive power is assumed to be zero [17]. However, this assumption is not applicable to WTGs. As discussed, Types 1 and 2 draw reactive power from the grid, and only Types 3 and 4 can supply reactive power to the
![Figure 2.1 Single line diagram of a distribution system connected WPP [54].](https://thumb-us.123doks.com/thumbv2/123dok_us/7934084.1317355/35.595.88.513.404.680/figure-single-line-diagram-distribution-connected-wpp.webp)
![Figure 2.5 Limit of ρ and X/R for 0.95p.u. < VPCC < 1.05p.u. in a SQIG-Based WPP [56]](https://thumb-us.123doks.com/thumbv2/123dok_us/7934084.1317355/60.595.90.509.77.577/figure-limit-r-x-vpcc-sqig-based-wpp.webp)
![Figure 3.1 Phasor diagram of the PCC voltage variation [133].](https://thumb-us.123doks.com/thumbv2/123dok_us/7934084.1317355/70.595.82.515.480.736/figure-phasor-diagram-pcc-voltage-variation.webp)