Article
Investigation of karst spring flow cessation using
grey system model
Yaru Guo1,2, Tian-Chyi Jim Yeh2,3 and Yonghong Hao2
1 College of Geographic and Environmental Science, Tianjin Normal University, No. 393 Binshuixi Road,
Xiqing District, Tianjin 300387, China; [email protected]
2 Tianjin Key Laboratory of Water Resources and Environment, Tianjin Normal University, No. 393 Binshuixi
Road, Xiqing District, Tianjin 300387, China; [email protected].
3 Department of Hydrology and Water Resources, The University of Arizona, John Harshbarger Building,
1133 E. North Campus Drive, Tucson, AZ 85721-0011, USA; [email protected]. *Correspondence: [email protected]; Tel.: +86-139-2025-5628
Abstract: Globally, karst aquifers store large amount of precious water and create beautiful karst springs in many places. However, most of the karst springs flow declined, and some of the karst springs dried up with the effects of extensive groundwater development and climate variation. In order to obtain better understanding of factors contributing to the drying-up of karst springs, this study introduced grey system models to quantify spring flow taking Jinci Springs (China) as an example, which dried up in May 1994. Based on the characteristics of Jinci Springs flow, the spring flow was divided into two stages: the first stage (1954-1960), when the spring flow was affected only by climate variation; and the second stage (1961-1994), when the flow was impacted by both climate variation and anthropogenic activities. Results showed that the Jinci Springs flow had strong relations with precipitation occurring one year and three years earlier in the first stage. Subsequently, a grey system GM (1, 3) model with one-year and three-yearlags was set up for the first stage. By using the GM (1, 3) model, we simulated the spring flow in the second stage under effects of climate variation only. Subtracting the observed spring flow from the simulated flow, we obtained the contribution of anthropogenic activities to Jinci Springs cessation. The contribution of anthropogenic activities and climate variation to Jinci Springs cessation was 1.46 m3/s and 0.62 m3/s, respectively. Finally, each human activity causing spring flow decline was estimated. The methods are useful to describe the karst hydrological processes under the effects of anthropogenic activities and climate variation.
Keywords: Jinci Springs; drying-up; anthropogenic activities
1. Introduction
Globally, karst aquifers store abundant groundwater and form a large number of karst springs, such as Silver Spring (USA), Dragonera Spring (Italy),Durzon Spring (France), Arjan Spring (Iran) and Niangziguan Spring (China) [1-4]. Generally, karst springs form the source of rivers and supply water for downstream areas, which are vital to regional ecological environment and economic development. However, extensive groundwater development and climate variation have caused karst groundwater level declining, spring flow to decreasing and even drying up in many parts of the world, such as the Ras El Ain spring in Syria [5], the dolomitic springs in the Republic of South Africa (i.e. the Venterspost Eye and the Oberholzer Eye) [6,7] and some karst springs in Greece and Australia [8-10]. In northern China, the situations are more serious. Jinci Springs, Lancun Springs, Gudui Springs, Heilongdong Springs, and Zhougong Springs have dried up [11].
For groundwater sustainable development, more and more scientists focused on the protection of karst groundwater. Ozdemir [12] used stable isotope to understand the physical process of influencing water flow in karst area, and determined the location and residence time of groundwater recharge area in the Namazgah Dam Basin in Turkey, which is conducive to the identification of karst
aquifer protection areas and the sustainable management of water resources. Sappa et al. [13] proposed a simple linear model based on the relationship between rainfall and discharge to simulate the effects of rainfall change on the minimum discharge of Capodacqua di Spigno spring. The model was used for water resources management and planning in Italy. Using the normalization method, Abou Zakhem and Kattaa [5] analyzed the annual discharge and precipitation of Ras El Ain spring. The results showed that the drying up of the spring may be the consequence of human activities. Therefore, sustainable water resources management schemes were developed to minimize the impact of over-exploitation on spring flow.
Jinci Springs has been one of the representative karst springs in northern China. The cessation of Jinci Springs discharge in May 1994 attracted public attention and promoted scientific researches. Previous studies mainly focused on the exhaustion of spring and the reoccurring conditions. Guo et al. [14] analyzed the reasons for the attenuation of large karst spring flow in Shanxi from three aspects: atmospheric precipitation, coal mining and groundwater overexploitation. In order to study the relationship between spring flow and precipitation, Hao et al. [15] proposed a correlation analysis method with time lag to distinguish the effects of precipitation variation and human factors on the drying up of Jinci Springs. Li et al. [16] analyzed the sensitivity of groundwater level in Jinci Springs basin to anthropogenic activity, using an artificial neural network model. Their results showed that coal mining drainage was the most significant human factor, which had a great influence on the groundwater level in Jinci Springs basin.
Sun et al. [17] used the fuzzy linear regression to predict the reoccurring time of Jinci Springs flow under different scenarios. To predict the karst groundwater level of Jinci Springs catchment from 2014 to 2020, Shi et al. [18]established a multiple linear regression model. The results indicated that the Jinci Springs discharge likely to reoccur before 2017 under the strategy of reducing groundwater exploitation.For investigating groundwater recovery in Jinci Springs catchment, Lv et al. [19] divided the groundwater level data over 1961-2012 into decline and recovery phases. The results suggested that the water resumption project could achieve remarkable groundwater recovery in Jinci Springs catchment.
Different from previous research, this study investigates the causes of Jinci Springs cessation using grey system theory. We intend to modify the traditional grey relational analysis to determine the time lags between spring flow and precipitation. Subsequently, we try to quantify the effects of human activities on Jinci Springs cessation by grey system GM (1, N) model with time lag. Finally, each human activity causing spring flow decline would be estimated.
2. Study area and data acquisition
2.1. Geographical location and background of Jinci Springs
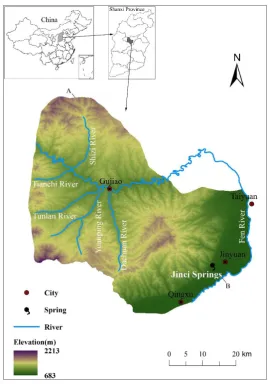
Jinci Springs is located in the northwest of Taiyuan Basin of central Shanxi Province, China (Figure 1). The total area of the spring catchment is 2030 km2, including the exposed karst area of 391 km2 in the north and the buried karst area of 1639 km2 in the south. The high terrain is located in the northwest part of the catchment, and the low in the southeast. The topography is dominated by hills (Figure 1). The main administrative regions include Gujiao City, Qingxu County, and parts of Taiyuan City.
and groundwater exploited intensively. Consequently, regional karst groundwater levels declined leading to the drying-up of Jinci Springs [15,19].
Figure 1. Location and digital elevation model (DEM) of Jinci Springs catchment.
2.2. Climate conditions of Jinci Springs
Jinci Springs area is a typical temperate semiarid continental monsoon climate. The annual average precipitation in this area is 472 mm (1955-2015), and the distribution of precipitation is extremely uneven. The precipitation in pluvial year is about three times in drought year. During a year, 60% of the precipitation was concentrated in June to September of the flood season. The precipitation in mountainous areas is greater than that in basins.
The annual average temperature is 8.1 C. The annual average evaporation in the area is 1871.8 mm. The annual average relative humidity is 60%. The maximum thickness of frozen soil layer is 1.1 m, and the frost-free period is about 160 days. The dominant wind direction is northwest wind in winter and spring and southeast wind in summer and autumn.
2.3. Hydrogeological conditions of Jinci Springs
Precipitation infiltrates into the exposed carbonate rocks in north Fenhe River, the groundwater flows to the southeast, and it discharges at Jinci Springs where the groundwater encounters the impermeable formation. In addition, the leakage of Fenhe River also recharges the groundwater in the catchment [20].
Figure 2. Geologicalcross-section of Jinci Springs catchment corresponding to A-B in Figure 1.
1.Cambrian dolomite rock; 2.Marl mingled with breccia; 3.Ordovician carbonate rock; 4.Bauxite; 5.Carboniferous and Permian coal seam; 6.Sand shale and Coal-bearing strata; 7.Quaternary deposit; 8.Sandy conglomerate; 9.Clay; 10.Springs.
2.4. Data acquisition
Jinci Springs flow was observed at Jinci Hydrological Gauge Station from 1954 to May 1994 (i.e. the time of Jinci Springs cessation), and the spring flow was quantified by flow measuring weir. The precipitation data from 1950 to 1995 were collected at Jinci Meteorological Gauge Station. The annual average spring flow and annual precipitation data are shown in Figure 3.
Figure 3. Spring flow and precipitation of Jinci Springs.
Grey system refers to a system where some information is known and some information is unknown or uncertain (i.e. a system with incomplete information) [21,22]. The karst groundwater system is affected by multi-factors, which are not completely known. Therefore, it can be considered as a grey system [23-25] and this is one of the reasons that the grey system method is used in this study.
3.1. Grey relational analysis with time lag
Grey relational analysis is one of grey system method, which has been widely applied in various fields, such as economics [26], sociology [27] and environics [28]. Its basic idea is to determine the relational degree between two data sequences, depending on the similarity of their geometric shapes [29]. The closer the geometric shapes between data sequences are, the larger the relational degree is.
In karst hydrological processes, time lag exists between spring flow and precipitation. Because of the filtering effects of aquifer, the infiltrated precipitation spends time to reach spring outlet, which causes the delayed response of spring flow. The time lag is regarded as hydraulic response time. Therefore, we introduce the concept of time lag into the traditional grey relational analysis. In the model, the spring flow is the characteristic sequence of the system, and precipitation is the related factor sequence. Subsequently, the relational degrees between spring flow and precipitation with different time lags are calculated. When the relational degree is the maximum, the corresponding time lag is the hydraulic response time of the aquifer.
Let the time sequence of system behavior characteristics be
Q
(
t
)
(t
=
1
,
2
,
,
n
) (e.g. spring flow), and the relational sequence with time lag i beR
(
it
−
i
)
(i
=
0
,
1
,
,
m
) (e.g. precipitation). In order to nondimensionalize for behavior and relational sequences, we implement an initialization operation forQ
(
t
)
andR
(
it
−
i
)
.,
)
1
(
)
(
)
(
~
Q
t
Q
t
Q
=
t
=
1
,
2
,
,
n
(1)
where
Q
~
(
t
)
is theinitialized system behavior characteristic sequence.)
1
(
)
(
)
(
~
i
R
i
t
R
i
t
R
i i i−
−
=
−
,
t
=
1
,
2
,
,
n
;
i
=
0
,
1
,
,
m
(2)
where
R
~
(
it
−
i
)
is theinitializedrelational sequence.The absolute value sequence of the difference between the corresponding components of
Q
~
(
t
)
and
R
~
(
it
−
i
)
is:,
)
(
~
)
(
~
)
(
t
Q
t
R
it
i
i
=
−
−
t
=
1
,
2
,
,
n
;
i
=
0
,
1
,
,
m
(3)
Then, we calculate the grey relational coefficient of
Q
(
t
)
with respect toR
(
it
−
i
)
.M
t
M
m
t
i QRi
+
+
=
)
(
)
(
,
(
0
,
1
)
;
t
=
1
,
2
,
,
n
;
i
=
0
,
1
,
,
m
(4)
where
M
max
max
i(
t
)
ti
=
,m
min
min
i(
t
)
t i
=
and
is defined as a distinguishing coefficient,generally
=
0
.
5
.The degree of grey relational of
Q
(
t
)
with respect toR
(
it
−
i
)
is defined as:)
(
1
1t
n
n t QR QRi
i=
=
The degrees of grey relational
QRiwith time lagsi
=
0
,
1
,
,
m
can be acquired. Generally, theinfluencing factors of
>
0.70
i QR
are defined as strong influencing factors.0
.
60
0
.
70
i QR
aregeneral, and
<
0.60
i QR
are weak. We set the time lag i corresponding to the>
0.70
i QR
between)
(
t
Q
andR
(
it
−
i
)
as
j(j
=
1
,
2
,
,
N
).3.2. Grey system GM (1, N) model with time lag
The grey system prediction model is called GM model for short. The GM (1, N) model represents a differential equation model with 1 order and N variables [26]. In order to simulate spring flow, we establish GM (1, N) model with time lag
j(j
=
1
,
2
,
,
N
). In the model, it is assumed thatQ
(0)(
t
)
(
t
=
1
,
2
,
,
n
) is the sequence of system characteristics (e.g. spring flow),R
j(0)(
t
−
j)
(j
=
1
,
2
,
,
N
)is the relational sequence (e.g. precipitation),
jis time lag between two sequences (e.g. time lagbetween precipitation and spring flow).
Let
==
t kk
Q
t
Q
1 ) 0 ( ) 1 ()
(
)
(
,
t
=
1
,
2
,
,
n
(6)
=−
=
−
t k j jj
t
R
k
R
1 ) 0 ( ) 1 ()
(
)
(
,
t
=
1
,
2
,
,
n
;
j
=
1
,
2
,
,
N
(7)
be the first-order accumulated generating operation (1-AGO) sequences of
Q
(0)(
t
)
and)
(
) 0 ( j jt
R
−
.Then, the differential equation is established as follows:
=−
=
+
N j j jj
R
t
b
t
aQ
dt
t
dQ
1 ) 1 ( ) 1 ( ) 1 ()
(
)
(
)
(
(8)
Let use the least squares estimation to solve the parameter vector
aˆ
, which is expressed as:Y
B
B
B
b
b
b
a
a
ˆ
=
[
,
1,
2,
N]
T=
(
T)
−1 T(9)
Where
−
−
−
+
−
−
−
+
−
−
−
+
−
=
)
(
)
(
)]
1
(
)
(
[
2
1
)
3
(
)
3
(
)]
2
(
)
3
(
[
2
1
)
2
(
)
2
(
)]
1
(
)
2
(
[
2
1
) 1 ( 1 ) 1 ( 1 ) 1 ( ) 1 ( ) 1 ( 1 ) 1 ( 1 ) 1 ( ) 1 ( ) 1 ( 1 ) 1 ( 1 ) 1 ( ) 1 ( N N N N N Nn
R
n
R
n
Q
n
Q
R
R
Q
Q
R
R
Q
Q
B
(10) Tn
Q
Q
Q
Y
=
[
(0)(
2
),
(0)(
3
)
,
(0)(
)]
(11)
Then we input the parameters of
a
ˆ
to Equation (8) to solve the differential equation. The approximate time response solution is obtained:
+
−
+
+
−
−
=
+
= − = N j j j j at N j j jj
b
R
t
a
e
t
R
b
a
Q
t
Q
1 ) 1 ( 1 ) 1 ( ) 0 ( ) 1 ()
1
(
1
)
1
(
1
)
1
(
)
1
(
ˆ
Subsequently, through inverse accumulation restoration, we can obtain the simulated values of characteristic variable.
)
(
ˆ
)
1
(
ˆ
)
1
(
ˆ
(0) (1) (1)t
Q
t
Q
t
Q
+
=
+
−
,
t
=
1
,
2
,
,
n
(13)
4. Results
4.1. Piecewise analysis of the Jinci Springs flow
From the spring flow curve of Jinci Springs (Figure 3), it can be seen that the Jinci Springs flow experienced two stages: 1954-1960 and 1961-1994. In the first stage (1954-1960), the spring flow varied steadily, which was only affected by climate variation, and in the second stage (1961-1994), the spring flow declined rapidly, which was impacted by climate variation and anthropogenic activities.
Based on the data of the first stage, we calculated the delay between spring flow and precipitation using the grey relational analysis with time lag, and then we established GM (1, N) model with time lag, which describes Jinci Springs flow under the effects of climate variation. Subsequently, we used the GM (1, N) model with time lag to simulate the spring flow in the second stage.
It is worth noting that the simulated values represent the spring flow under the influence of climate variation only, and the observed values were the spring flow under the influence of both climate variation and anthropogenic activities. Therefore, if one subtracts the observed values from the simulated values, one can determine the contribution of anthropogenic activities to Jinci Springs cessation.
4.2. Grey relational degrees with time lag
We selected the observed spring flow from 1956 to 1960 as system characteristic sequence
Q
(
t
)
(
t
=
1
,
2
,
,
5
) and precipitation in advance of spring flow 0 to 5 year as relational sequenceR
(
it
−
i
)
(
t
=
1
,
2
,
,
5
;
i
=
0
,
1
,
,
5
) to calculate the grey relational degrees with time lags of 0 to 5 year (Table 1). Karst aquifers are considered as large groundwater reservoir. After precipitation infiltrates into saturated aquifer through epikarst, groundwater merges in karst aquifer and then discharges to ground surface as spring. In the hydrological process of transforming precipitation signals into spring flow, the karst aquifer alters the signals by buffering and merging. For reflecting the mechanism of karst aquifer adjusting groundwater flow, we carried out the three-year moving average procedure for precipitation time series.Table 1. Observed data of Jinci springs flow and precipitation
Time (year) 1951 1952 1953 1954 1955 1956 1957 1958 1959 1960
Spring flow (m³/s) 2.02 2.09 2.04 2.05 2.08
Precipitation in advance of 0 to 5
years (mm)
441.08 542.18 503.95 523.86 507.24 485.26 441.08 542.18 503.95 523.86
409.67 485.26 441.08 542.18 503.95 452.27 409.67 485.26 441.08 542.18
602.92 452.27 409.67 485.26 441.08 685.92 602.92 452.27 409.67 485.26
Based on the data listed in Table 1, we used Equations (4) and (5) to calculate the grey relational degrees between the spring flow and precipitation under different time lags of 0 to 5 year. The results are shown in Table 2.
Table 2. Grey relational degrees between the spring flow and precipitation under different time lags
Time lag(year) 0 1 2 3 4 5
Table 2 shows that when time lags between precipitation and spring flow equal to one year and three years, the grey relational degrees were larger than 0.70, which means the Jinci spring flow strongly correlated with precipitation in advance of one and three years. In other words, the Jinci Springs flow was mainly recharged by precipitation ahead of one year and three years. The results are consistent with the regional geological structure. It reflects the heterogeneity of the stratums in Jinci Springs catchment. In the catchment, the Ordovician karst aquifer is covered by Carboniferous and Permian coal seam, Triassic sand shale, and Quaternary loess sediment from the bottom up. There are hydraulic connections between shallow groundwater and karst groundwater through fissures, faults, and conduits. The precipitation infiltration transports and reaches spring outlet through fissures, faults, and conduits with short time (i.e. one year). The others would reach spring outlets with long time (i.e. three years).
4.3. The grey system GM (1, N) model with time lag
4.3.1. Establishment of the GM (1, N) model with time lag
Because the Jinci Springs flow was mainly recharged by precipitation ahead of one year and three years, the GM (1, 3) model with the time lags of one year and three years was established. Let
the spring flow data from 1956 to 1960 as the original data series
Q
(0)(
t
)
(t
=
1
,
2
,
,
5
) the precipitation data ahead of the spring flow with one year and three years as the relevant factor(0) 1
(
1)
R
t
−
(i.e. precipitation from 1955 to 1959), andR
2(0)(
t
−
3)
(i.e. precipitation from 1953 to 1957). Taking precipitation as input and the spring flow as output, we set up the GM (1, 3) model with one-year and three-year lags.The results of the parameter identification for vector
aˆ
in Equation (9) were as follows:
=
=
0.0015
0.0118
3.3222
]
,
,
[
ˆ
a
b
1b
2a
(14)Then we can ensure the model.
)
3
(
0.0015
)
1
(
0.0118
)
(
3.3222
)
(
(1)2 ) 1 ( 1 ) 1 ( ) 1 (
−
+
−
=
+
Q
t
R
t
R
t
dt
t
dQ
(15)
The approximate time response sequence was:
)
2
(
00045
.
0
)
(
00355
.
0
)]
2
(
00045
.
0
)
(
00355
.
0
02
.
2
[
)
1
(
ˆ
) 1 ( 2 ) 1 ( 1 3222 . 3 ) 1 ( 2 ) 1 ( 1 ) 1 (−
+
+
−
−
−
=
+
−t
R
t
R
e
t
R
t
R
t
Q
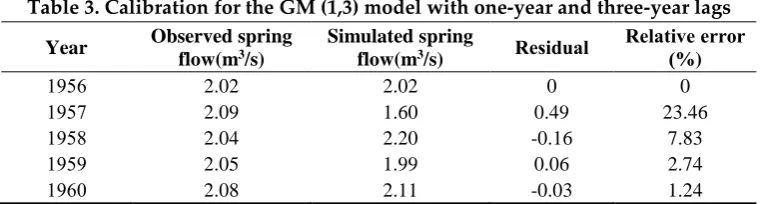
t (16) Through inverse accumulation restoration, i.e. Equation (13), we obtained the simulated Jinci Springs flow (Table 3).Table 3. Calibration for the GM (1,3) model with one-year and three-year lags
Year Observed spring
flow(m3/s)
Simulated spring
flow(m3/s) Residual
Relative error (%)
1956 2.02 2.02 0 0
1957 2.09 1.60 0.49 23.46
1958 2.04 2.20 -0.16 7.83
1959 2.05 1.99 0.06 2.74
1960 2.08 2.11 -0.03 1.24
4.3.2. Model calibration
The relative error was between 1.24% and 23.46%, and the average relative error was 8.82%. The model sufficiently passed the calibration.
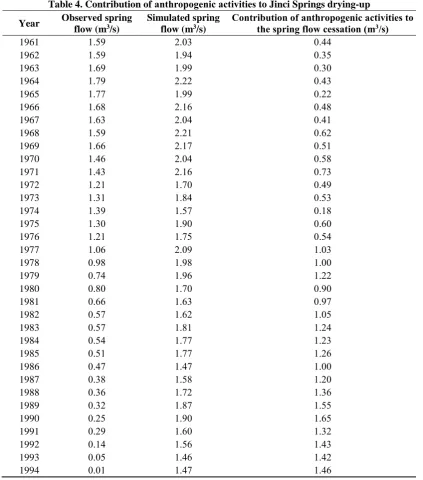
The GM (1, 3) model withone-year and three-year lags described the Jinci springs flow under the influence of climate variation in the first stage. By substituting precipitation from 1958 to 1993 into the model, one can obtain the simulated spring flow from 1961 to 1994 under the effects of climate variation. Subtracting the observed spring flow from the simulated one, we can approximate the contribution of anthropogenic activities to the cessation of spring flow. Results were shown in Table 4 and Figure 4.
Table 4. Contribution of anthropogenic activities to Jinci Springs drying-up
Year Observed spring
flow (m3/s)
Simulated spring flow (m3/s)
Contribution ofanthropogenic activities to
the spring flow cessation (m3/s)
1961 1.59 2.03 0.44
1962 1.59 1.94 0.35
1963 1.69 1.99 0.30
1964 1.79 2.22 0.43
1965 1.77 1.99 0.22
1966 1.68 2.16 0.48
1967 1.63 2.04 0.41
1968 1.59 2.21 0.62
1969 1.66 2.17 0.51
1970 1.46 2.04 0.58
1971 1.43 2.16 0.73
1972 1.21 1.70 0.49
1973 1.31 1.84 0.53
1974 1.39 1.57 0.18
1975 1.30 1.90 0.60
1976 1.21 1.75 0.54
1977 1.06 2.09 1.03
1978 0.98 1.98 1.00
1979 0.74 1.96 1.22
1980 0.80 1.70 0.90
1981 0.66 1.63 0.97
1982 0.57 1.62 1.05
1983 0.57 1.81 1.24
1984 0.54 1.77 1.23
1985 0.51 1.77 1.26
1986 0.47 1.47 1.00
1987 0.38 1.58 1.20
1988 0.36 1.72 1.36
1989 0.32 1.87 1.55
1990 0.25 1.90 1.65
1991 0.29 1.60 1.32
1992 0.14 1.56 1.43
1993 0.05 1.46 1.42
Figure 4. Contribution of anthropogenic activities to the spring flow attenuation in Jinci Springs.
5. Discussion
The Figure 4 illustrates that the observed spring flow from 1961 to 1994 exists an obvious downward trend. Similarly, the simulated spring flow also showed a decline, but the declining rate was much smaller than that of observed spring flow. Simultaneously, the contribution of anthropogenic activities to the spring flow attenuation occurred in uptrend.
The observed spring flow was 2.08 m3/s in 1960 (Table 1), and the Jinci Springs dried up in May 1994. Therefore, the total contribution of climate variation and anthropogenic activities to the Jinci Springs drying-up were 2.08 m3/s. Moreover, the contribution of anthropogenic activities was 1.46 m3/s in 1994, accounting for 70% of the total contribution of 2.08 m3/s (Table 4). The contribution of climate variation was 0.62 m3/s, accounting for 30%. The contribution of anthropogenic activities had surpassed that of climate variation from 1960 to 1994, and anthropogenic activities became the dominated factors governing the spring flow. Because the Ordovician karst aquifer is covered by the Carboniferous and Permian coal seams, Triassic shales, and Quaternary sediments from the bottom up, dewatering from coal mining decreases groundwater recharge of karst aquifers causing the decline of Jinci Springs flow. In addition, chemical plants and power plants directly pumped large groundwater from karst aquifers, which further aggravated the attenuation of Jinci Springs flow.
In order to acquire better understanding of the influence of anthropogenic activities on the spring flow, we investigated the main human activities, and discussed the reasons leading to the cessation of Jinci Springs, respectively.
5.1. Karst groundwater exploitation
Figure 5. Spring flow, karst groundwater exploitation and number of wells in Jinci Springs catchment.
5.2. Dewatering from coal mining
Dewatering from coal mining directly reduced the recharge to the karst aquifers, causing the decline of spring flow. The dewatering from coal mining was 0.05 m3/s in1960, and was 0.65 m3/s in 1994 (Figure 6). The increment of dewatering from coal mining was 0.60 m3/s [30].
Figure 6. Spring flow and dewatering from coal mining in Jinci Springs catchment.
5.3. Construction of the Fenhe Reservoir
Figure 7. Leakage of Fenhe River.
In summary, there were three kind of human activities, which caused the drying-up of the Jinci Springs. The groundwater exploitation increment was found to be 0.97 m3/s, the dewatering from coal mining increment was 0.60 m3/s, and the leakage reduction of Fenhe River was 0.19 m3/s. The contribution of the three kind of human activities to Jinci Springs decline was 1.76 m3/s. One may find that the actual contribution of human activities (i.e. 1.76 m3/s) was larger than simulated one (i.e. 1.46 m3/s). In fact, the difference between the actual and simulated contribution (i.e. 0.30 m3/s) was the results of further human exploitation of groundwater after the Jinci Springs drying-up in May 1994.
6. Conclusion
The Jinci Springs flow had strong relations with the precipitation one year and three years earlier. That is to say, the Jinci Springs flow was mainly recharged by precipitation occurring one year and three years ahead.
Under the effects of climate variation and anthropogenic activities, Jinci Springs dried up in 1994. The contribution of anthropogenic activities and climate variation to Jinci Springs cessation was found to be 1.46 m3/s and 0.62 m3/s, accounting for 70% and 30%, respectively. The influence of anthropogenic activities on the spring flow cessation surpassed climate variation and was the major factor.
Three major human activities caused the Jinci Springs cessation. The contribution of the groundwater exploitation increment was 0.97 m3/s, the dewatering from coal mining increment was 0.60 m3/s, and the leakage reduction of Fenhe River was 0.19 m3/s. The total amount was 1.76 m3/s, which was larger than the critical value of human activities (i.e. 1.46 m3/s). In other words, after the Jinci Springs dried up, human further overexploited groundwater about 0.30 m3/s, which was the difference between the actual contribution of human activities (i.e. 1.76 m3/s) and simulated contribution (i.e. 1.46 m3/s), then, this means that there is groundwater mining.
Spring flow declining is one of the global environmental problems accompanied by social and economic development. The methods are useful to describe the karst hydrological processes under the effects of anthropogenic activities and climate variation, and could help us understand and solve the problems.
Funding: This work is partially supported by the Natural Science Foundation of Tianjin, China (grant number: 18JCZDJC39500), Program for Innovative Research Team in Universities of Tianjin, China (grant number: TD13-5078), and the National Natural Science Foundation of China (grant numbers: 41272245, 40972165, and 40572150).
References
1. Civita, M.V. An improved method for delineating source protection zones for karst springs based on analysis of recession curve data. Hydrogeol. J. 2008, 16, 855-869.
2. Plagnes, V.; Bakalowicz, M. The protection of karst water resources: the example of the Larzac karst plateau (south of France). Environ. Geol. 2001, 40, 349-358.
3. Mohammadi, Z.; Mahdavikia, H.; Raeisi, E.; Ford, D.C. Hydrogeological characterization of Dasht‑e‑Arjan Lake (Zagros Mountains, Iran): clarifying a long‑time question. Environ. Earth Sci. 2019, 78.
4. Hao, Y.H.; Liu, G.L.; Li, H.M.; Li, Z.T.; Zhao, J.J.; Yeh, T.J. Investigation of Karstic Hydrological Processes of Niangziguan Springs (North China) Using Wavelet Analysis. Hydrol. Process. 2012, 26, 3062-3069.
5. Abou Zakhem, B.; Kattaa, B. Overexploitation and cumulative drought trend effect on Ras El Ain karstic spring discharge (Khabour Sub-basin, Syria). J. Earth Syst. Sci. 2017, 126.
6. Swart, C.J.U.; James, A.R.; Kleywegt, R.J.; Stoch, E.J. The future of the dolomitic springs after mine closure on the Far West Rand, Gauteng, RSA. Environ. Geol. 2003, 44, 751-770.
7. Schrader, A.; Winde, F.; Erasmus, E. Using impacts of deep-level mining to research karst hydrology—a Darcy-based approach to predict the future of dried-up dolomitic springs in the Far West Rand goldfield (South Africa). Part 1: a conceptual model of recharge and inter-compartmental flow. Environ. Earth Sci. 2014, 72, 3549-3565. 8. Panilas, S.; Petalas, C.P.; Gemitzi, A. The possible hydrologic effects of the proposed lignite open-cast mining in Drama lignite field, Greece. Hydrol. Process. 2008, 22, 1604-1617.
9. Deb, P.; Kiem, A.S.; Willgoose, G. A linked surface water-groundwater modelling approach to more realistically simulate rainfall-runoff non-stationarity in semi-arid regions. J. Hydrol. 2019a, 575, 273-291. 10. Deb, P.; Kiem, A.S.; Willgoose, G. Mechanisms influencing non-stationarity in rainfall-runoff relationships in southeast Australia. J. Hydrol. 2019b, 571, 749-764.
11. Liang, Y.P.; Han, X.R.; Xue, F.H.; Li, L.X.; Zhang, W.Z.; et al. Water resources conservation for karst spring basin of Shanxi province; China Water and Power Press: Beijing, China, 2008.
12. Ozdemir, A. Defining groundwater resource protection zones in aquifers using stable isotope analysis: a case study from the Namazgah Dam Basin in Turkey. Environ. Earth Sci. 2019, 78.
13. Sappa, G.; De Filippi, F.M.; Iacurto, S.; Grelle, G. Evaluation of Minimum Karst Spring Discharge Using a Simple Rainfall-Input Model: The Case Study of Capodacqua di Spigno Spring (Central Italy). Water, 2019, 11. 14. Guo, Z.Z.; Zhang, H.D.; Yu, K.N. Multi-factor attenuation of karst springs in Shanxi province. Geo. Invest. & Surv. 2004, 2, 22-25. (In Chinese).
15. Hao, Y.H.; Zhu, Y.; Zhao, Y.; Wang, W.; Du, X.; Yeh, T.J. The role of climate and human influences in the dry-up of the Jinci Springs, China. J. Am. Water Resour. As. 2009, 45, 1228-1237.
16. Li, X.; Shu, L.C.; Liu, L.H.; Yin, D.; Wen, J.M. Sensitivity analysis of groundwater level in Jinci Spring Basin (China) based on artificial neural network modeling. Hydrogeol. J. 2012, 20, 727-738.
17. Sun, C.Z.; Wang, J.S; Lin, X.Y. Research on the Jinci Spring’s recovery after the use of water from the yellow river as municipal water supply. Carsologica Sin. 2001, 20, 11-16. (In Chinese).
18. Shi, H.J.; Qi, X.; Jin, H. Prediction of karst groundwater level based on R-language—taking Jinci Spring Basin as an example. Appl. Mech. Mate. 2015, 730, 230-234.
19. Lv, C.M.; Ling, M.H.; Wu, Z.N.; Gu, P.; Guo, X.; Di, D.Y. Analysis of groundwater variation in the Jinci Spring area, Shanxi Province (China), under the influence of human activity. Environ. Geochem. Health 2019, 41, 921-928.
20. Zhao, Y.G.; Cai, Z.H. Research on the Karst-water System: Case Study of Taiyuan Area; Science Press: Beijing, China, 1990.
21. Liu, S.F.; Lin, Y. An Introduction to Grey Systems: Foundations, Methodology and Applications; IIGSS Academic Publisher: Slippery Rock, PA, USA, 1998.
22. Liu, S.F.; Lin, Y. Grey Information: Theory and Practical Applications, Springer-Verlag: London, 2006. 23. Hao, Y.H.; Yeh. T.J.; Gao, Z.Q.; Wang, Y.R.; Zhao, Y. A grey system model for studying the response to climatic change: the Liulin karst spring, China. J. Hydrol. 2006, 328, 668-76.
24. Hao, Y.H.; Yeh. T.J.; Wang, Y.R.; Zhao, Y. Analysis of karst aquifer spring flows with a grey system decomposition model. Ground Water 2007, 45, 45-56.
25. Hao, Y.H.; Wang, Y.J.; Zhu, Y.; Lin, Y.; Wen, J.C.; Yeh, T.J. Response of karst springs to climate change and anthropogenic activities: the Niangziguan Springs, China. Prog. Phys. Geog. 2009, 33, 634-649.
27. Chen, J.J.; Zhang, R.; Liu, B. The empirical study of executive compensation in China port and shipping listed companies based on the grey relational analysis. Grey Syst. Theor. Appl. 2016, 6, 259-269.
28. Xie, C.Y.; Feng, J.C.; Zhang, K.; Zhou, H.W.; Xue, S. Water use efficiency and influencing factors in the Mekong River Basin Region based on grey relational analysis. J. Grey Syst. 2018, 2, 28-41.
29. Liu, S.F.; et al. The grey system theory and its application (8th edition); Science press: Beijing, China, 2017. 30. Zhao, J.J. Analysis of the influence of human activities on the spring discharge in Jinci Springs. Tianjin: Tianjin normal university, 2012 (In Chinese).
31. Zhong, Y.Y. Numerical simulation research on influence of channel leakage in Fenhe River Upstream on karst groundwater in Jinci Spring Catchment. Taiyuan: Taiyuan University of Technology, 2017 (In Chinese). 32. Jin, H.; Yang, S.L.; Zheng, X.Q.; Li, C.J. Analysis of the reduction in flow from Jinci Springs. J. Taiyuan U. T. 2005, 36, 488-490 (In Chinese).