1
Modeling solid-phase microextraction of volatile organic compounds by porous coatings
using finite element analysis
Bulat Kenessov 1,*, Miras Derbissalin 1, Jacek A. Koziel 2, Dmitry S. Kosyakov3
1Center of Physical Chemical Methods of Research and Analysis, Faculty of Chemistry and
Chemical Technology, Al-Farabi Kazakh National University, 050012 Almaty, Kazakhstan, [email protected] (ORCID: 0001-8541-0903), [email protected] (ORCID: 0000-0001-6928-971X).
2 Department of Agricultural and Biosystems Engineering, Iowa State University, Ames, IA, USA,
[email protected] (ORCID: 0000-0002-2387-0354)
3Core Facility Center “Arktika”, Northern (Arctic) Federal University, Arkhangelsk, Russia,
[email protected] (ORCID: 0000-0001-5223-6857)
* – Corresponding author, 050012 Almaty, 96a Tole bi Street, room 403, Kazakhstan, tel: +7 727 2390624; fax: +7 727 2923731; e-mail: [email protected].
Abstract
Experimental optimization of analytical methods based on solid-phase microextraction (SPME) is a complex and labor-intensive process associated with uncertainties. Using the theoretical basics of SPME and finite element analysis software for the optimization proved to be an efficient alternative. In this study, an improved finite element analysis-based model for SPME of volatile organic compounds (VOCs) by porous coatings was developed mainly focussing on the mass transport in coatings. Benzene and the Carboxen/polydimethylsiloxane (Car/PDMS) coating were used as the model VOC and a porous SPME coating, respectively. It has been established that
2 in the coating, volumetric fractions of Carboxen, PDMS, and air are 33, 42 and 24%, respectively. Knudsen diffusion in micropores can slow down a mass transport of analytes in the coating. When PDMS was considered as the solid part of the coating, lower root-mean-square deviation of the modeling results from experimental data was observed. It has been shown that the developed model can be used to model the extraction of VOCs from air and water samples encountered in a typical SPME development method procedure. It was possible to determine system equilibration times and use them to optimize sample volume and Henry’s law constant. The developed model is relatively
simple, fast, and can be recommended for optimization of extraction parameters for other analytes and SPME coatings. The diffusivity of analytes in a coating is an important property needed for improved characterization of existing and new SPME polymers and analytical method optimization.
Keywords: SPME; Carboxen; volatile organic compounds; benzene; transport in porous media; COMSOL Multiphysics.
1. Introduction
Solid-phase microextraction (SPME) is one of the simplest and most prospective sample preparation approaches for the quantification of organic compounds in various samples [1]. This technology is based on the transfer of analytes from a sample into a micro (thin polymeric layer) coating followed by their complete thermal desorption to an analytical instrument. SPME combines sampling and several sample preparation steps – extraction, concentration, and cleanup. In most cases, SPME can be fully automated using commercial autosamplers, for which SPME became the standard option in addition to liquid and headspace injection.
3 many parameters need to be optimized [4]. Optimization of SPME parameters is one of the main steps required in method development and often uses a common-sense, ‘trial-and-error’ experimental design. The commonly optimized parameters are fiber coating type, coating dimensions, extraction temperature, extraction time, pH, amount of salt added to a sample, sample/headspace ratio, agitation/stirring rate, pressure in a vial, desorption temperature and time. Because the selection of parameters tested and the lack of proper control and training, SPME-based methods often result in lower accuracy compared to methods involving conventional sample preparation techniques, which hinders their implementation in routine laboratories and adoption as standard methods. Thus clearly, it is challenging to recognize many potentially important sources of uncertainties during typical experimental optimization of SPME, and there is a need to develop a more focused, improved approach to the optimization process itself.
One of the most important resources for optimization of SPME-based methods is the theory of the method, which is well established [5–10] yet underutilized. The theory is often used by method developers only as a tool to explain the results of the experimental optimization. The rare use of the theory for direct method optimization can be caused by its complexity and insufficient mathematical background, or computing resources available to many developers. This problem can be solved by using a simplified software for mathematical modeling, which does not require advanced skills.
4 The software uses the finite element analysis (FEA) method for solving differential equations governing mass and energy balance, which can be used to describe various physical and chemical processes. For the modeling, a user must create a process ‘geometry’ (physical shape and dimensions), choose a suitable physics, provide all required parameters and settings from a user menu. As the result of the modeling, it is possible to predict and visualize an analyte concentration in each point of geometry in different time moments, obtain extraction profiles at different extraction parameters and model unusual sampling conditions (worst cases).
Despite the major initial progress with modeling, currently available models based on COMSOL Multiphysics still use several simplifications for mass transport of analytes in adsorptive (porous) coatings. During their modeling, Kenessov et al. [16] considered Carboxen/polydimethylsiloxane (Car/PDMS) and polydimethylsiloxane/divinylbenzene (PDMS/DVB) coatings as a single porous structure. However, these coatings have a much more complex structure. They consist of solid (Carboxen 1006 or DVB) particles attached to each other and to the silica rod using cross-linked PDMS. The diameter of Carboxen particles in the coating is 1~5 µm, with an average of ~2 µm [17]. Mean diameter of micropores of Carboxen particles is 1.2 nm [5] meaning that the diffusion of small-sized molecules in the micropores can be driven by Knudsen diffusion, which is much slower than a molecular diffusion [18].
Many important specifications of the commercial fibers are not reported in the scientific literature as that information could be either proprietary or difficult to obtain without sophisticated equipment. For example, there is no information on the ratio between PDMS, Carboxen, and air in the coating, which makes it impossible to build the accurate model because the ratio can affect the mass transport rate of analytes in the coating. Still, in some cases, an estimate of specific parameters can be obtained experimentally.
5 experimental results. Benzene (a ubiquitous and toxic pollutant in the air, water, and soil) was selected as a model VOC. Carboxen/PDMS was selected as a model porous (adsorptive) SPME coating because it is recommended for extractions of a wide range of VOCs and is often used for exploratory work for method development.
2. Experimental
2.1. General modeling parameters
Modeling was conducted using COMSOL Multiphysics 5.4 (Burlington, MA, USA) software with Chemical Engineering module installed on a personal computer equipped with a six-core Core i7-8700 central processing unit (Intel, Santa Clara, CA, USA), 16 Gb of DDR4 random access memory (Apacer, Taiwan) and 250 Gb 860 Evo solid-state drive (Samsung, Seoul, Rep. of Korea). Modeling was conducted using ‘Transport of Diluted Species’ and ‘Transport of Diluted Species in Porous Media’ physics in a ‘time-dependent’ mode using previously used parameters [16]. Convection was deactivated in transport mechanisms as there was no air movement in the modeled systems. Default equations of COMSOL Multiphysics were used for the modeling. For modeling mass transport in homogeneous media (air, water, and homogeneous coating), Fick's second law of diffusion was used:
∂𝑐
∂𝑡= 𝐷 ∇
2c (1)
where: c is the analyte concentration, mol m-3; D is the diffusion coefficient, m2 s-1; t is time.
Mass transport in porous media (coating or particles) was modeled using:
(𝜀 + 𝜌 𝐾𝑝) 𝜕𝑐
𝜕𝑡 = 𝐷 ∇
2c (2)
where: ε is a porosity of a porous material; ρ is a density of a porous material, kg m-3; Kp is a
6 The distribution constant for benzene between coating and air was set to 150,000 [19]. Simulations were conducted for 23-ga 85-µm Car/PDMS Stableflex® fiber (Supelco, Bellefonte, PA, USA) with a core diameter of 130 µm and length of 80 mm; the coating thickness and length
were 80 µm and 10 mm, respectively [5]. The ‘extra fine free triangular mesh’ was used for the modeling. To provide better meshing at the coating-air interface, the resolution of narrow regions was increased to ‘5’. Parameters of all models used in this research ready for import to COMSOL Multiphysics are provided in Supplementary Material.
For two-dimensional (2D) geometry, the analyte amount extracted by the coating was calculated by multiplying surface average concentration in the coating by the coating volume, or surface averaged concentration adsorbed to the solid by the coating mass. For three-dimensional (3D) geometry, volume averaged concentrations were used for similar calculations. The randomly chosen results of the modeling in 2D were validated in 3D. There was no difference between results obtained in 2D and 3D.
2.2. Effect of the diffusion coefficient in the SPME coating on the extraction process
When modeling using a single apparent diffusion coefficient for the whole coating, ‘Transport of Diluted Species’ physics and equation (1) were used separately for air and the coating.
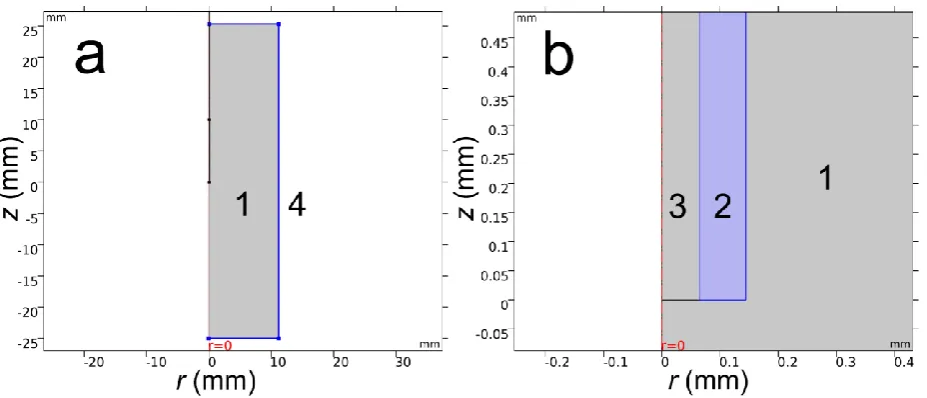
Two-dimensional axisymmetric geometry was used for the modeling (Fig. 1), which included a
20-mL headspace vial (ID = 20.0 mm, height = 63.7 mm), fiber core (L = 60 mm) and a 80-μm
7
Fig. 1 Geometry used to study the effect of apparent diffusion coefficient on extraction profile of benzene from air by exposed Car/PDMS fiber. Note: a – full-scale geometry; b – magnified fiber tip; 1 – air inside 20-mL vial; 2 – coating; 3 – fiber core; 4 – wall of the 20-mL vial.
Fluxes from (or backward to) air (Flux1 and Flux2, respectively) at the coating-air boundaries
were simulated similarly as previously shown for absorptive coatings by Kenessov et al. [16]:
𝐹𝑙𝑢𝑥1 = 𝑘 (𝑐𝑎− 𝑐𝑓
𝐾𝑓𝑎) ; 𝐹𝑙𝑢𝑥2 = 𝑘 ( 𝑐𝑓
𝐾𝑓𝑎− 𝑐𝑎) (3)
where: k is the flux coefficient m s−1; ca and cf are concentrations of the analyte in air and coating
at the interface, respectively, mol m−3; Kfa is the dimensionless distribution constant for benzene
between SPME coating and air. Flux coefficient was set to the value of 1000 m s-1, which is sufficiently high in order not to influence the extraction process (Fig. A.1 in Supplementary Material) as was proposed by Alam et al. [11]. The vial was filled with air at the initial analyte concentration 0.641 µmol m−3. To simulate extraction from the open air with a constant
8
2.3. Experimental study of the structure and composition of Car/PDMS fiber coating
Thermogravimetric analysis was conducted using synchronous thermal analyzer STA 449 F3 Jupiter (NETZSCH, Germany) to estimate the ratio of Carboxen and PDMS in a commercial SPME coating. The analyzed coating (L = 10 mm) was separated from the base and divided into 1-2 mm pieces. Sample weight was obtained using two pairs of microbalances: XP56 (Mettler Toledo, Switzerland) and CPA2P (Sartorius, Germany). Sample weight on both instruments was identical and resulted in 0.462 mg. Full sample was placed in Al2O3 crucible, evacuated in a sample chamber
at 10–2 mbar, followed by argon (99.998%, NIIKM, Moscow, Russia) flow. The experiment was performed in dynamic mode with constant purging with argon at 20 mL min-1. An empty crucible was used as a reference sample. Temperature rise was performed from 20 °C to 1000 °C at the rate of 10 °C min-1. System management, data collection, and processing were performed using
NETZSCH-Proteus software. Microphotographs of the 85-µm Car/PDMS coating were obtained using a scanning electron microscope SIGMA VP (Zeiss, Germany). Vacuum deposition of a conductive layer of gold on the surface of samples was carried out using the Q150T ES system (Quorum Technologies, United Kingdom).
2.4 Modeling of the effect of benzene diffusion coefficient in Carboxen particles on the mass
transport of the analyte in the coating
9 (air and space between particles) was modeled using equation (1). At the end of the side with blocks filled with air, benzene concentration 0.641 µmol m−3 was set. For the model without particles, coating porosity (εc) was calculated using:
𝜀𝑐 = 𝜀𝑖 + 𝜀𝑝 𝜑𝑝 (4)
where: εi is the inter-particle porosity; εp is the porosity of particles; φp – a volumetric fraction of
particles. Coating density (ρc) was calculated using:
𝜌𝑐 = 𝜌𝑝 (1 − 𝜀𝑖) (5)
where: ρp is the density of Carboxen particles. Tortuosity model was chosen in the software to
calculate the effective diffusivity. Tortuosity factor (σ) was calculated from the corresponding porosity [7]:
𝜎 = 𝜀 + 1.5 (1 − 𝜀) (6)
Knudsen diffusion coefficient in pores of particles (DK = 1.14∙10-7 m2 s-1) was calculated
using [20]:
𝐷𝐾 = 4 𝑟
6 √ 8 𝑅 𝑇
𝜋 𝑀 = 3.068 𝑟√
𝑇
𝑀 (7)
where: r is the average pore radius (0.6 nm); R is gas constant (8.31 m2 kg mol-1 K-1 s-2); T is the
temperature (298 K); M is the molecular mass (78∙10-3 kg mol-1).
Net diffusion coefficient in pores (DP= 1.14∙10-7 m2 s-1) was calculated using [7,21]:
𝐷𝑃 = (𝐷𝐺−1+ 𝐷𝐾−1)−1= 1.12 ∙ 10−7m2s−1 (8)
where DG is benzene diffusion coefficient in the air (8.8∙10-6 m2 s-1).
2.5. Experimental study of benzene mass transport in Car/PDMS fiber
2.5.1 Description of the experiment
10 experiment was 24±2 °C. To estimate the equilibrium response of the analyte, four prepared
samples were extracted for 8 h with two exposed 85-µm Car/PDMS fibers in duplicates. That procedure was followed by a 30-min extraction by exposed fiber in two replicates to monitor MSD sensitivity changes for quality assurance and control. Eighteen samples were extracted by two retracted (Z = 0 mm) 85-µm Car/PDMS fibers for 2, 5, 10, 20, 60, 120, 240, 480 and 960 min using Combi-PAL (CTC Analytics, Switzerland) autosampler installed on a 6890N/5973N GC-MS (Agilent, USA) equipped with split/splitless inlet and SPME liner (i.d. = 0.75 mm, Supelco, Bellefonte, PA, USA). The position of the retracted fiber was controlled using CTC Cycle Editor available in MSD ChemStation (E.02.02) software. After extraction, the fiber was introduced into the GC inlet working in splitless mode for 5 min at 250 ℃. Separation was conducted using 30 m × 0.25 mm DB-35ms (Agilent, USA) column (0.25 µm film) under the constant helium (>99.995%,
Orenburg-Tehgas, Russia) flow equal to 1.0 mL min-1. Oven temperature was programmed from 70 ℃ (held for 1 min) to 190 ℃ (held for 1 min) at the rate of 20 ℃ min-1. MS detection was
conducted in selected ion monitoring (SIM) mode of the ion with m z-1 78, dwell time was 100 ms. To monitor GC-MS instrument sensitivity changes, every fiber change was followed by a 30-min extraction by the exposed fiber in two replicates. Amount of the extracted benzene relative to the equilibrium value (%) was calculated by the following formula
𝑛 = 𝑆𝑟 𝑆𝑐
𝑆𝑓 𝑆𝑒 100% (9)
where: n is a relative amount of benzene collected on fiber, %; Sr is the peak area after extraction
by the retracted fiber at variable extraction time, a.u.; Sf is a peak area of 8-h extraction by exposed
fiber, a.u.; Sc is a peak area after 30-min extraction by the exposed fiber following the extraction
by a retracted fiber at variable extraction time, a.u., Se is a peak area after 30-min extraction by the
11
2.5.2 Modeling parameters
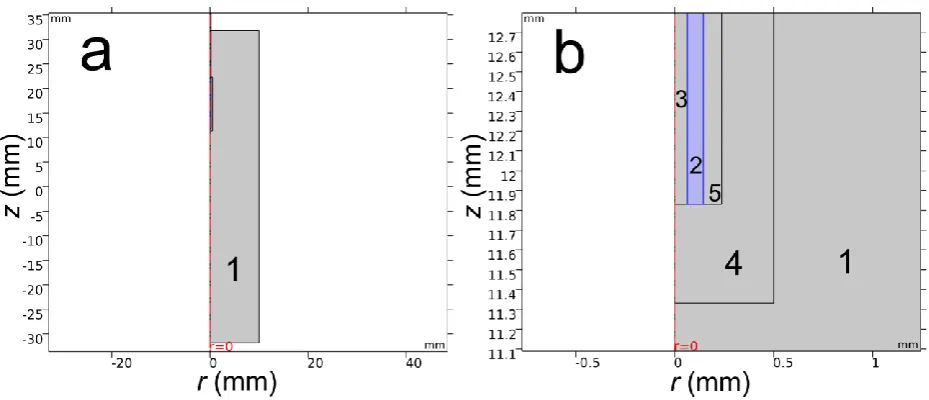
Two-dimensional axisymmetric geometry included the 20-mL vial (i.d. = 20 mm, height = 63.7 mm), 23-ga protecting needle, Stableflex® Car/PDMS fiber core and coating (Fig. 2). Because mass transport should take place only via the tip of the protecting needle, a thin impermeable barrier was set at its wall. The internal diameter of the protecting needle was established using a digital USB microscope (China) capable of 1000× optical zoom. SPME assembly with retracted fiber and caliper photos were taken from an equal distance. Internal diameter (ID, mm) was calculated using:
𝐼𝐷 = 𝐿𝑝1
𝑝2 (10)
where: L is the distance between marks on the caliper (1 mm); p1 is the internal diameter of
protecting needle, pixels; p2 is the distance between marks on caliper, pixels. Distance in pixels
was calculated using Paint.NET 4.1.5 (dotPDN LLC, USA) software.
12 Equation (2) was used to model the analyte mass transport in the coating. The diffusion coefficient of benzene in laboratory air was set to 9.55∙10-6 m2 s-1. This value was obtained by multiplying the diffusion coefficient at standard conditions (8.8∙10-6 m2 s-1) by a standard atmospheric pressure (760 mmHg) and dividing by the atmospheric pressure in the laboratory (700 mmHg). The computation was completed in the range between 0 and 57,600 s at the step of 100 s. The initial value for benzene concentration in the laboratory air inside the vial during the experiment (0.435 µmol m-3) was determined using standard addition calibration using the method developed by Baimatova et al. [22]. Initial benzene concentration in the coating was set to zero.
2.6 Application of the model to SPME of analytes from air
Extraction of benzene was modeled from sample containers having volumes of 20, 125, 250 and 1000 mL filled with air at C0 = 0.641 µmol m-3. Internal diameters of containers were 20, 40,
60 and 100 mm. Extraction from infinite volume was also tested. For this purpose constant analyte concentration was set at the walls of the 20-mL vial. Fiber was located in the center of a sample container. Equation (2) was used to model the analyte mass transport in the coating while equation (1) was used to model the mass transport in air. The computation was completed in the range between 0 and 10,000 s with the 10-s interval.
2.7 Application of the model to headspace SPME of analytes from water
13 sufficiently high value of 1000 m s-1 in order not to affect the simulated extraction (Fig. A.4 in
Supplementary Material) as was earlier proposed by Alam et al. [11]. For the same purpose (ideal stirring simulation), the analyte diffusion coefficient in water was set equal to the that in the air (8.8·10-6 m2 s-1). The computation was completed in the range between 0 and 10,000 s with the
10-s interval.
3. Results and Discussion
3.1 Effect of the diffusion coefficient in the SPME coating on the extraction process
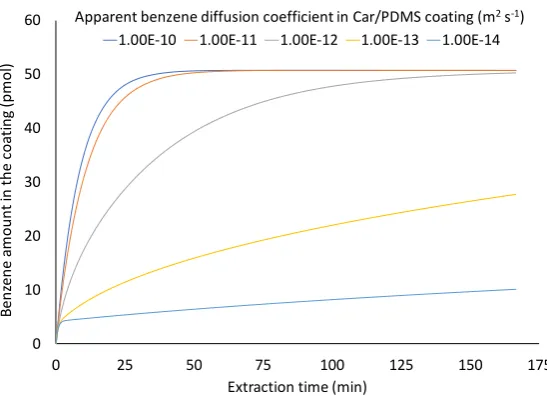
The apparent diffusion coefficient is often used as a single parameter characterizing the rate of mass transport of a chemical in a complex medium. It allows predicting how quickly the compound will be distributed in the studied material, e.g., porous adsorbent or soil. According to the results of the modeling (Fig. 3), the decrease of the apparent diffusion coefficient of benzene in (inside) the coating slows down benzene extraction process from the air. The effect is less pronounced when decreasing Da from 10-10 down to 10-11 m2 s-1 because, in this range, diffusion of
the analyte in the air is a limiting stage of the extraction process. Further decrease of Da makes the
14
Fig. 3 Effect of the apparent diffusion coefficient of benzene inside the 85-µm Carboxen/PDMS coating on benzene extraction profile from the air (C = 0.641 µmol m-3)
During this stage of the study, it has been established that the apparent diffusion coefficient in the coating can be determined by the following formula [16] without any loss of accuracy:
𝐷𝑎 = 𝐷 𝜖
𝜎 𝐾𝑐𝑎 (11)
where: D is the diffusion coefficient of the analyte in the air; ε is the total porosity of the coating;
σ is the tortuosity factor of the coating; Kca is the distribution constant between coating and air. In
this case, the results of the modeling were the same as the results obtained using ‘Transport of Diluted Species in Porous Media physics’, which was recently used by Kenessov et al. [16]. Equation (2) was used for modeling the analyte mass transport in the coating. Equation (1) with Da
instead of D can be obtained from the equation (2) if 𝜀 ≪ 𝜌 𝐾𝑝 and 𝜌 𝐾𝑝 = 𝐾𝑐𝑎, and the equation
for calculating the effective diffusivity in porous medium [21]:
𝐷𝑒 = 𝐷 𝜖
𝜎 (12)
The use of this approach for modeling the extraction by an exposed fiber required adding a small additional rectangle (1 x 11 mm) around the coating where initial concentration was set to zero. In the remaining part of the vial, the concentration was set to 0.641 µmol m-3. Without this
0 10 20 30 40 50 60
0 25 50 75 100 125 150 175
B en ze n e am o u n t in t h e co at in g (p m o l)
Extraction time (min)
1.00E-10 1.00E-11 1.00E-12 1.00E-13 1.00E-14
15 important modification, incorrect results of the modeling were obtained, and the mass conservation law was violated. In further modeling, both approaches were used to validate the obtained results.
3.2. Structure and composition of Car/PDMS fiber coating
In the previous section, a simplified homogeneous model of analyte mass transport in SPME coating was used. In reality, it is much more complicated because commercial adsorptive fibers have a quite complex structure and chemical composition. Car/PDMS fiber consists of Carboxen 1006 particles, cross-linked PDMS binder, air and a Stableflex core [5]. There is a very limited amount of publicly available information about this type of coating in the literature because it is considered proprietary [16]. Without this information, the development of a more accurate model is impossible. In a personal communication with the manufacturer (Sigma-Aldrich Chemie) representatives [24], it has been disclosed that the density of Carboxen particles is ~1 g mL-1. The volume of air between particles was not known by the manufacturer, and the ratio between PDMS and Carboxen was proprietary. This stage of the study was aimed at estimating the ratio between volumes and masses of Carboxen, PDMS, and air in the coating experimentally.
During the thermogravimetric analysis (Fig. 4) of SPME where elevated temperature causes breakdown and release of volatile fractions, the coating mass dropped by 62% (286 µg), which can be related to the PDMS ‘glue’ (acting as a binder) and polymeric part of the StableFlex core of the SPME assembly. Considering the dimensions of the StableFlex core, which consists of an 80-µm silica core and a 20-µm ‘plastic-like’ polymer [5], the mass of the latter is 63 µg. Thus, the resulting mass of PDMS ‘glue’ is 286 - 63 = 223 µg. The remaining portion (38%; 176 µg) corresponds to solid Carboxen particles, which have much higher thermal stability. Because the densities of PDMS glue and polymeric part of the StableFlex® core are not known, they were assumed to be 1 g mL -1. Taking into account that the density of Carboxen particles is also 1 g mL-1, they occupy 176 µL
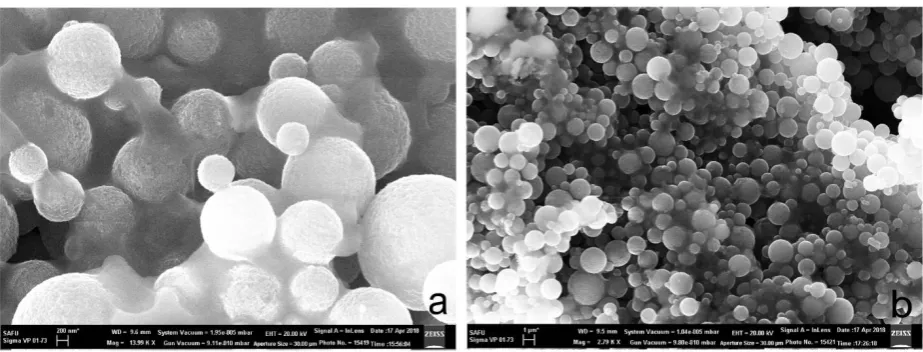
16 particles occupy 42 and 24 % of the coating volume, respectively. These results are supported by SEM microphotographs of the Car/PDMS coating (Fig. 5) where spherical Carboxen particles (d ~ 0.5-3 µm) covered with PDMS are clearly visible. There is a significant amount of PDMS between particles, which allow retaining them together.
Fig. 4 Thermogravimetric curve of 85-µm Car/PDMS coating in the range of 150~900 ℃
Fig. 5 Scanning electron microscope image of Car/PDMS fiber. Carboxen phase is represented by ~0.5 to ~3 µm porous spheres. Each particle is covered with a layer of PDMS, which is also
represented by darker shaded ‘bonds’ between spheres with occasional larger ‘blobs.’
0 20 40 60 80 100
100 200 300 400 500 600 700 800 900
Rel
at
iv
e
co
at
in
g
m
as
s
(%
)
17
3.3 Effect of benzene diffusion coefficient inside Carboxen particles on the mass transport of
the analyte in the coating
The experimentally determined coating structure was used to build the 3D model of a small section of the coating. Building the whole coating with separate particles was not feasible at this time because it would take a very long time and/or significant computational resources. The use of 2D geometry would not have been appropriate because each ‘slice’ of the coating is different, and it is impossible to model a single slice properly describing the coating. PDMS phase was not included into the model for its simplification; all space between particles was assumed to be filled with air. It was done mainly because the analyte distribution constant between PDMS and Carboxen was not known (but it generally accepted that Car/PDMS provides much higher fiber-air benzene distribution constant than PDMS - 150,000 [19] versus 301 [5], respectively). Carboxen particle size was set to 2 µm, the distance between the surfaces of the particles was 0.32 µm so that the particles take 33% of the total volume of the coating section. According to equations (4-6) and the results presented in Section 3.2, coating porosity, density and tortuosity factor were set to 0.792, 330 kg m-3 and 1.104, respectively.
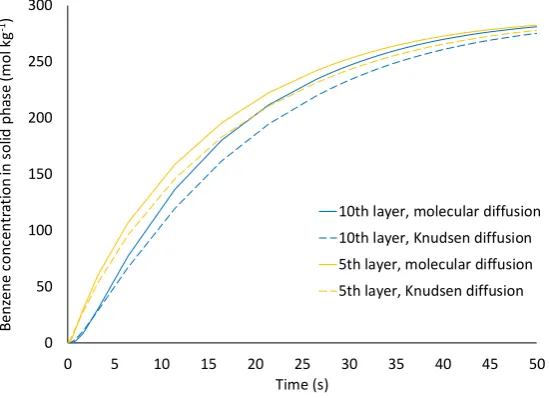
Results of the modeling proved that the analyte diffusion coefficient inside Carboxen particles affects its mass transport in the coating (Fig. 6). When the mass transport of the analyte in particles is driven by Knudsen diffusion (Dp = 1.12·10-7 m2 s-1), the overall mass transport in the
coating is slower compared to the molecular diffusion-driven process (Dp = 8.8·10-6 m2 s-1). This
is likely because of the faster equilibration of particles’ surface with surrounding air under slower Knudsen diffusion.
18 the distribution constant between coating and air. However, when the diffusion coefficient inside particles was not equal to the diffusion coefficient in voids, it was impossible to find the homogeneous model, which would provide the same results of the modeling.
Fig. 6 Effect of a primary benzene diffusion mechanism in particles on its concentration profiles in 10th and 5th rows of particles
3.4. Experimental study of benzene mass transport in Car/PDMS fiber
As it was previously shown by Kenessov et al. [16], SPME of VOCs strongly depends on the mass transport rate in the coating when it is retracted inside a protecting needle (in the case of time-weighted average sampling, TWA-SPME). In this case, the tip of the fiber can be equilibrated (saturated) with analytes extracted from the surrounding air because of the slow mass transport of analyte to the remainder of the coating. As was proven, this process is more pronounced at lower diffusion path lengths (i.e., shorter retraction depths). In the present study, the lowest possible Z (0 mm) was chosen to maintain the highest possible flux of the analyte to the fiber tip.
According to the Sigma-Aldrich needle gauge chart [25], 23-ga needles have a nominal I.D. of 340 µm, which was previously used for modeling purposes [16]. Due to the reproducible
differences observed between experimental and theoretical results of TWA SPME sampling, it was hypothesized that such discrepancies can be caused by the higher internal diameter of the protecting
0 50 100 150 200 250 300
0 5 10 15 20 25 30 35 40 45 50
B en zen e co n cen tr at io n in s o lid p h as e (m o l k g -1) Time (s)
19 needle of a SPME assembly. Four photos for caliper scale and five microphotographs for protecting needle were used to accurately determine the internal diameter. The measured value was 476±11 µm, which is ~40% higher than the reported value and 7% higher than the value (444 µm) recently
obtained by Tursumbayeva [26]. Such differences result in ~2× higher cross-sectional area of the protecting needle and TWA sampling rates by retracted fiber which were obtained during the modeling [16].
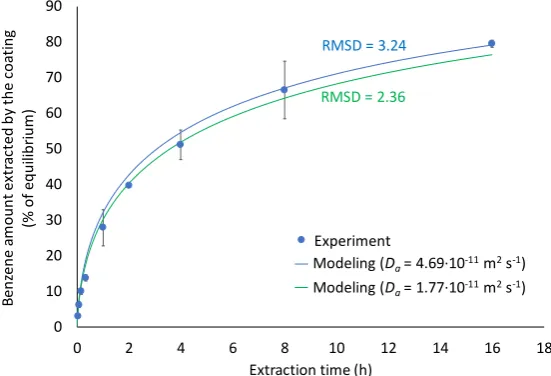
The modeling was conducted using two different scenarios when PDMS was considered as air and solid phase. For the first scenario, the coating porosity, density and tortuosity factor were set to 0.792, 330 kg m-3 and 1.104, respectively, which corresponded to apparent diffusion coefficient 4.69∙10-11 m2 s-1. For the second scenario, the coating porosity, density and tortuosity
factor were set to 0.366, 760 kg m-3 and 1.317, respectively, which corresponded to apparent diffusion coefficient 1.77∙10-11 m2 s-1. Along with these scenarios, apparent diffusion coefficients
ranging from 10-12 to 10-10 were tested. The results of the modeling were compared with
experimental data using root-mean-square (RMS) deviations.
The experimental extraction profile of benzene was closer to the second scenario (RMSD = 2.36) than to the first one (RMSD = 3.24) (Fig. 7). Other tested values of Da provide higher RMSDs
20
Fig. 7 Experimental and theoretical benzene extraction profiles from the air by retracted (Z = 0 mm) 85-µm Car/PDMS fiber at T = 24±2 °C and p = 700±10 mmHg.
3.5 Application of the model to air sampling using SPME
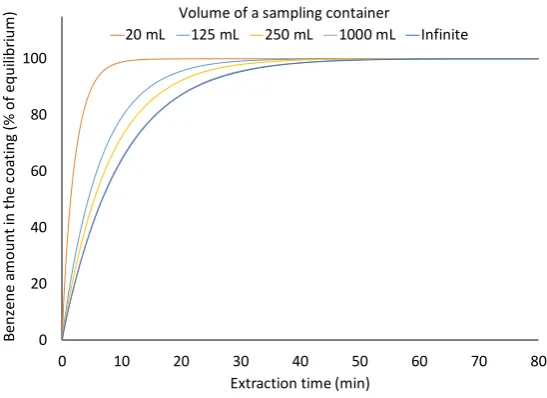
The developed model allowed obtaining benzene sampling profiles from sampling containers of a different volume – from 20 mL to the infinite value. From the obtained plots (Fig. 8), it could be seen that the increase of a sample container volume from 20 to 1000 mL results in the increase of a complete (100.0%) equilibration time from 18.7 to 58.0 min. At these volumes, 95% of the equilibrium amounts were extracted after 6.7 and 28.5 min, respectively. Such an increase is caused by a greater amount of the analyte present in the larger extraction vessel, which allows extracting greater analyte amount. During the extraction, according to the mass conservation law, the mass of the analyte in the sample slowly decreases, and this decrease is less pronounced for larger extraction containers. The increase of the volume over 1000 mL did not result in an increased equilibration time despite an ‘infinite’ volume allowed extracting 8% greater amount of the analyte.
0 10 20 30 40 50 60 70 80 90
0 2 4 6 8 10 12 14 16 18
B en zen e am o u n t ex tr ac ted b y th e co at in g (% o f eq u ili b ri u m )
Extraction time (h) Experiment
Modeling (Da = 4.7E-11) Modeling (Da = 2.0E-11)
RMSD = 3.24
RMSD = 2.36
Experiment
Modeling (Da= 4.69∙10-11m2s-1)
21
Fig. 8 Effect of the volume of air sampling container on extraction profiles of benzene by Car/PDMS fiber at T = 298 K, p = 1 atm.
3.6 Application of the model to benzene extraction from water samples
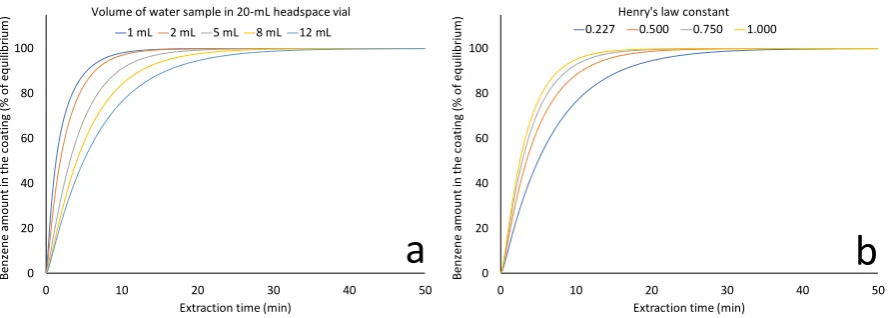
The developed model can also be used for obtaining extraction profiles of volatile and semi-volatile compounds from water and other liquid samples. To simplify the modeling, the analyte mass transport in the liquid phase was assumed not to be the limiting stage of the extraction process, which can be achieved with the ideal stirring. According to the obtained plot (Fig. 9a), the increase of the sample volume and, thus, the amount of analyte available for extraction requires longer equilibration time. At the volume of 1 mL, 95% of the equilibrium amount was extracted after 7.3 min. The increase of the sample volume to 2 mL increased the 95% equilibration time to 8.5 min. The use of the 12-mL sample required 20.5 min for equilibration.
Along with the increase of extraction effectiveness by 41%, the increase of Henry’s law constant from 0.227 to 1.000 (V = 12 mL) resulted in the decrease of the equilibration time (Fig. 9b) to 10.0 min. Faster extraction is caused by a greater amount of an analyte with a higher HLC present in the gas phase and available for extraction. An increase of HLC can be achieved by, e.g., adding salt to the sample before the extraction as it is a common practice in SPME method
0 20 40 60 80 100
0 10 20 30 40 50 60 70 80
Extraction time (min)
20 mL 125 mL 250 mL 1000 mL Infinite
Volume of a sampling container
22 optimization. Addition of the salt increases an ionic strength and decreases the solubility of analytes, thus, resulting in an increase of HLC [5].
Fig. 9 Effects of the water sample volume (a) and Henry’s law constant (b) on extraction profiles of benzene by Car/PDMS fiber from 20-mL headspace vial at T = 25 °C and p = 760 mmHg under the ideal stirring.
4. Conclusion
In this research, the need to improve SPME-based method development process was addressed. An improved, finite element analysis-based model for VOC transport into a porous SPME coating was developed. The rationale for developing the model was to identify potentially important sources of uncertainties during typical experimental optimization of SPME, and thus to the optimization process itself. Benzene and the Car/PDMS coating were used as a model VOC and a porous SPME coating, respectively. The effects of several parameters used to develop SPME-based method were studied. These included the diffusion coefficient in the SPME coating (assumed to be filled by air) and the diffusion coefficient inside the Carboxen particles. Combination of modeling and experimental methods (i.e., thermogravimetric analysis) allowed to determine the internal structure of the Car/PDMS coating. It has been established that volumetric fractions of Carboxen, PDMS and air in the coating are 33, 42 and 24%, respectively. In addition, the measured
0 20 40 60 80 100
0 10 20 30 40 50
Extraction time (min) 1 mL 2 mL 5 mL 8 mL 12 mL Volume of water sample in 20-mL headspace vial
B en zen e am o u n t in t h e co at in g (% o f eq u ili b ri u m )
a
0 20 40 60 80 1000 10 20 30 40 50
Extraction time (min) 0.227 0.500 0.750 1.000
Henry's law constant
23 internal diameter of 23-ga protecting needle was equal to 476±11 µm, ~40% greater than nominal, suggesting that physical dimensions of SPME need to be verified for some applications. The obtained experimental data allowed improving the recently developed numerical model of SPME using Car/PDMS fiber and compared reasonably well with experimental data, particularly when PDMS is considered as a solid phase (coating porosity 0.366, density 760 kg m-3 and tortuosity factor 1.317) providing lowest RMS deviation. It has been proven that Knudsen diffusion in micropores, which is slower than molecular diffusion characteristic for larger pores) can slow down a mass transport of analytes inside the coating. For Car/PDMS coating, mass transport of benzene is mostly characterized by a molecular diffusion, which can be explained by a large fraction of macro- and mesopores. For a more microporous coating, the effect of Knudsen diffusion can be more pronounced, which will require either building of a more complex model or using the simplified model proposed in this study at lower accuracy.
It has been shown that the developed model can be used to model the extraction of VOCs from air and water samples encountered in a typical SPME development method procedure. It was possible to determine system equilibration times and use them to optimize sample volume and Henry’s law constant (e.g., by salting out effect). The developed model is relatively simple, fast
24
Conflicts of interest
The authors declare no conflicts of interest in relation to this research.
Acknowledgments
This work was supported by the Ministry of Education and Science of the Republic of Kazakhstan [grant number AP05133158 and the Ph.D. scholarship of Miras Derbissalin]. This project was partially supported by the Iowa Agriculture and Home Economics Experiment Station, Ames, Iowa, and Hatch Act and State of Iowa funds [project number IOW05556]. The instrumentation of Core Facility Center “Arktika” of the Northern (Arctic) Federal University was
used for thermal analysis and SEM study under partial support of the Ministry of Science and Higher Education of Russia [project no. 4.2518.2017/4.6].
References
[1] N. Reyes-Garcés, E. Gionfriddo, G.A. Gómez-Ríos, N. Alam, E. Boyaci, B. Bojko, et al., Advances in solid phase microextraction and perspective on future directions, Anal. Chem. 90 (2018) 302–360. doi:10.1021/acs.analchem.7b04502.
[2] Scopus. Elsevier (2019). https://scopus.com (accessed April 12, 2019).
[3] Web of Science. Clarivate Analytics (2019). https://apps.webofknowledge.com (accessed April 12, 2019).
[4] S. Risticevic, H. Lord, T. Górecki, C.L. Arthur, J. Pawliszyn, Protocol for solid-phase microextraction method development, Nat. Protoc. 5 (2010) 122–139.
doi:10.1038/nprot.2009.179.
25 London, UK, 2012. doi:10.1039/9781847550149.
[6] P. Mocho, J. Nicolle, V. Desauziers, Modelling of adsorption kinetics and calibration curves of gaseous volatile organic compounds with adsorptive solid-phase microextraction fibre: Toluene and acetone for indoor air applications, Anal. Bioanal. Chem. 392 (2008) 97–104. doi:10.1007/s00216-008-2249-8.
[7] P. Mocho, V. Desauziers, Static SPME sampling of VOCs emitted from indoor building materials: Prediction of calibration curves of single compounds for two different emission cells, Anal. Bioanal. Chem. 400 (2011) 859–870. doi:10.1007/s00216-011-4820-y.
[8] E. Psillakis, Vacuum-assisted headspace solid-phase microextraction: A tutorial review, Anal. Chim. Acta. 986 (2017) 12–24. doi:10.1016/j.aca.2017.06.033.
[9] E. Psillakis, A. Mousouraki, E. Yiantzi, N. Kalogerakis, Effect of Henry’s law constant and operating parameters on vacuum-assisted headspace solid phase microextraction., J. Chromatogr. A. 1244 (2012) 55–60. doi:10.1016/j.chroma.2012.05.006.
[10] S.N. Semenov, J.A. Koziel, J. Pawliszyn, Kinetics of phase extraction and solid-phase microextraction in thin adsorbent layer with saturation sorption isotherm, J. Chromatogr. A. 873 (2000) 39–51. doi:10.1016/S0021-9673(99)01338-2.
[11] M.N. Alam, L. Ricardez-Sandoval, J. Pawliszyn, Numerical modeling of solid-phase microextraction: binding matrix effect on equilibrium time, Anal. Chem. 87 (2015) 9846– 9854. doi:10.1021/acs.analchem.5b02239.
[12] N. Alam, Insight into Quantitation of Solid-phase Microextraction. Ph.D. Thesis, University of Waterloo, Waterloo, ON, Canada, 2016.
[13] M.N. Alam, J. Pawliszyn, Numerical simulation and experimental validation of calibrant-loaded extraction phase standardization approach, Anal. Chem. 88 (2016) 8632–8639. doi:10.1021/acs.analchem.6b01802.
26 in solid phase microextraction: opportunities, limitations, and future perspectives, Anal. Chim. Acta. 984 (2017) 42–65. doi:10.1016/j.aca.2017.05.035.
[15] M.N. Alam, E. Nazdrajić, V. Singh, M. Tascon, J. Pawliszyn, Effect of Transport Parameters and Device Geometry on Extraction Kinetics and Efficiency in Direct Immersion Solid-phase Microextraction, Anal. Chem. 90 (2018) 11548–11555. doi:10.1021/acs.analchem.8b02855.
[16] B. Kenessov, J.A. Koziel, N. Baimatova, O.P. Demyanenko, M. Derbissalin, Optimization of time-weighted average air sampling by solid-phase microextraction fibers using finite element analysis software, Molecules. 23 (2018) 2736. doi:10.3390/molecules23112736. [17] J. Pawliszyn, Applications of Solid Phase Microextraction, Royal Society of Chemistry,
Cambridge, UK, 2007. doi:10.1039/9781847550149.
[18] J. Rouquerol, F. Rouquerol, P. Llewelyn, G. Maurin, K.S.. Sing, Adsorption by Powders and Porous Solids, Elsevier, 2014. doi:10.1016/C2010-0-66232-8.
[19] P. Prikryl, J.G.K. Sevcik, Characterization of sorption mechanisms of solid-phase microextraction with volatile organic compounds in air samples using a linear solvation energy relationship approach, J. Chromatogr. A. 1179 (2008) 24–32.
doi:10.1016/j.chroma.2007.10.016.
[20] D.D. Do, Adsorption Analysis: Equilibria and Kinetics, Imperial College Press, London, UK, 1998. doi:10.1142/p111.
[21] W.J. Thomas, B. Crittenden, Rates of adsorption of gases and vapours by porous media, in: Adsorpt. Technol. Des., Elsevier, 1998: pp. 66–95. doi:10.1016/B978-075061959-2/50005-7.
27 [23] D. Mackay, W.Y. Shiu, R.P. Sutherland, Determination of air-water Henry’s law constants
for hydrophobic pollutants, Environ. Sci. Technol. 13 (1979) 333–337. doi:10.1021/es60151a012.
[24] K. Buckendahl, R. Shirey, Personal Communication on 17 June, 2017 (2017). [25] Sigma-Aldrich, Syringe Needle Gauge Chart (2019).
https://www.sigmaaldrich.com/chemistry/stockroom-reagents/learning-center/technical-library/needle-gauge-chart.html (accessed January 27, 2019).
[26] M. Tursumbayeva, Simple and accurate quantification of odorous volatile organic compounds in air with solid phase microextraction and gas chromatography - mass spectrometry. M.S. thesis, Iowa State University, Ames, Iowa, USA, 2017.