a
Corresponding author: [email protected]
Bubble dynamics in drinks
Zuzana Brouþková1,2,a, ZdenČk Trávníþek1 and Pavel ŠafaĜík2
1
Institute of Thermomechanics AS CR, 182 00 Prague, Czech Republic 2
CTU, Faculty of Mechanical Engineering, 166 07 Prague, Czech Republic
Abstract. This study introduces two physical effects known from beverages: the effect of sinking bubbles and the hot chocolate sound effect. The paper presents two simple „kitchen” experiments. The first and second effects are indicated by means of a flow visualization and microphone measurement, respectively. To quantify the second (acoustic) effect, sound records are analyzed using time-frequency signal processing, and the obtained power spectra and spectrograms are discussed.
1 Introduction
The effect of sinking bubbles and the hot chocolate sound effect are well known from our everyday life.
The first, counter-intuitive, effect is visible: sometimes, bubbles in coffee (or beer) fall down along the wall of glass, contrary to the buoyancy force. The reason is that the large amount of bubbles causes circulation of the liquid in the glass. An upwards motion occurs in the glass centre and a visible bubble fall demonstrates a downwards motion along the wall (see e.g. [1]).
The second effect is hearable: the submerged teaspoon is used to tap the bottom of the glass with just poured coffee (or chocolate). One can hear a tone that slowly rises in pitch. The tone is generated by a standing wave in the liquid (namely a quarter-wave resonator), similarly as tones in musical instruments (flute, organ) are generated in air. While the tone in air is constant at a given temperature, the tone of coffee slowly rises in pitch. The reason is that the speed of sound in a gas/liquid mixture decreases with volume fraction of the bubbles. The tone rises in pitch, because the speed of sound increases as the bubbles disappear because of buoyancy forces. Another „kitchen” experiment demonstrates an inverse sound effect, when hot tap water is poured into a glass and the tapping starts. At first, the tone lowers in pitch – the reason is generation of bubbles from supersaturated liquid (sparkling wine effect). Sequentially, an increase of the tone is hearable as the bubbles disappear (see [2], [3], [4]).
The effects in bubbly liquids are known from our daily life, however, they are important in inanimate/animate nature of large scales (magma-gas mixtures, trapping “bubble nets” of whales) as well as in various applications in laboratories and industry, e.g.
aeration mass transfer systems and contactless measurement of composition in two-phase mixtures.
2 Experimental setup
2.1 Effect of sinking bubbles
To demonstrate the effect of sinking bubbles a high drinking glass was used (the height of the glass is 162 mm, the inner bottom diameter is 32 mm, the volume is 0.275 l). The diameter of the glass is slightly widened upwards – see figure 1a, the inner diameter at the glass top is 69 mm. The cold dark beer was poured into the glass and consequently the process of sinking bubbles was filmed with digital camera.
2.2 Hot chocolate sound effect
Another high drinking glass was used for the experiment with sound effect (the height, inner bottom diameter and volume are 156 mm, 42 mm, 0.345 l, respectively). Again, the diameter of the glass is slightly widened upwards – the inner diameter at the glass top is 68 mm. The instant coffee powder was put into the glass and it was poured with hot water. The height of the coffee column was from 121 mm to 125 mm. The coffee was stirred with a teaspoon. Subsequently, the submerged teaspoon was used to tap the bottom of the glass. The teaspoon was held vertically. The produced sound was recorded by means of a microphone connected to the sound card of a PC. The microphone was placed approximately 15 cm from the glass. The sound record was consequently analysed using a short-time Fourier transform (STFT) and fast Fourier transform (FFT) by the
C
Owned by the authors, published by EDP Sciences, 2014
MATLAB software. The library functions “spectrogram” and “periodogram” were used (see [5] for details).
For comparison purposes, the similar experimental procedure was also performed with empty glass and glass with cold and hot water without coffee powder, and with hot tap water. The liquids used for sound experiments can be assumed as homogeneous mixture of hot water and air bubbles. Although the propagation of sound waves is very complex problem under these conditions, the speed of sound c can be expressed as the isentropic derivative, as was shown in [4]:
s p c ¨¨©§ ¸¸¹·
∂ ∂ =
ρ , (1)
where p is a pressure and ρ is the density of the mixture. The speed of sound in pure liquids can be expressed using the compressibility K (as e.g. in [2], [6]):
ρ K
c= 1 . (2)
However, the speed of sound in liquid basically decreases by occurrence of gas bubbles as is shown in figure 2, which is adapted from Wilson and Roy [6], who applied a classical Wood’s equation from 1930.
The liquid column in the glass behaves as one-quarter wavelength resonator [2] and [4], thus the sound effect is caused by longitudinal vibration of the liquid column. The frequency of the sound is simply:
h c c f 4 = =
λ , (3)
where λ is the wavelength and h is the height of the liquid column.
The dependence of frequency on time was shown for the hot chocolate effect in [4] in the following form:
( )
( )
( )
21 2 2 1 4 1 − °¿ ° ¾ ½ °¯ ° ® » » ¼ º « « ¬ ª + − = w w a a c t c t h t f ρ ϕ ρ ϕ
ρ , (4)
where ρa and ca are density and speed of sound in air, respectively, ρw and cw are density and speed of sound in water, respectively, t is the time and ϕ is the volume fraction of air bubbles. The volume fraction was assumed [4] in the form of
( )
» ¼ º « ¬ ª ¸ ¹ · ¨ © § − = τ ϕϕt 0 1 tanh t , (5)
where ϕ0 and τ are constants evaluated from the experiment.
It is worth noting here that the rate of two frequencies f2 and f1 can be expressed by means of number of octaves, as is well-known to musicians:
¸¸¹ · ¨¨© § = 1 2 2 log f f
no . (6)
3 Results
3.1 Effect of sinking bubbles
Figure 1a shows the effect of sinking bubbles in dark beer. Although the gas bubbles in liquid should rise up, the counter-intuitive process is visible: the bubbles are sinking down. An explanation of this process consists in the fact that a huge amount of bubbles makes the entire liquid into an upward movement. It means that the rising bubbles cause fluid flow upwards, similarly as is known from aeration processes. Obviously, mass conservation results in a counter-flow along the glass wall – the layer of liquid is falling down as is visualized by tracer bubbles. Since the used beer is dark, only the thin layer with falling bubbles is visible. In other words, the rising bubbles inside the glass are hidden. The principle of a circulation of the liquid is indicated by arrows in figure 1a.
Figure 1. Scheme of the circulation in a glass of beer (a) and velocity profile in the glass (b), adapted from Benilov et al. [1].
a
The velocity profile across the glass was calculated by Benilov et al. [1] and their typical example is shown in figure 1b. Surprisingly, significant influence of the glass shape was numerically predicted.
To the best knowledge of the authors, no direct measurement of this liquid circulation is known from available literature. It remains the challenge for the future.
3.2 Hot chocolate sound effect
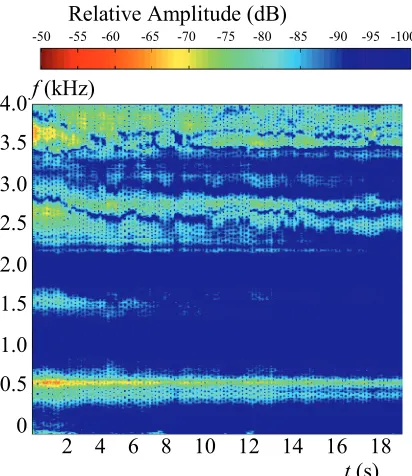
Figure 3 shows an example of a spectrogram of the hot chocolate sound effect. The temperature and height of the coffee column were 82°C and 120 mm, respectively. The gradual increase of the pitch of the tone from 640 Hz to 3524 Hz can be seen in figure 3 and it corresponds to no = 2.5 octaves. The results are in very good agreement with previous experiments [4] and also with those done by Crawford [2].
Figure 4 shows a spectrogram of the hot bubble-free water. Temperature and height of the water column are 85.5°C and 107 mm, respectively. Spectrogram in figure 4 shows one constant dominant frequency 3805 Hz. The temperature and height of the column in this case are similar to those from previous experiment with hot coffee and also the frequency of the tone in the water agrees well with the highest frequency in the hot coffee spectrogram.
For comparison purposes the spectrogram of an empty glass is shown in figure 5. The spectrogram has a constant frequency 634 Hz. However, this frequency can be identified in previous figure 3 and figure 4 only with difficulty.
Figures 3, 4 and 5 demonstrate well the complexity of the acoustic effect. The glass itself oscillates as a rigid body in many modes. Similarly, the spoon itself has many oscillating modes. And the liquid oscillates in several modes too. Frequency of oscillation of the rigid
body is constant in time (see figure 5), frequency of oscillation of the one-phase liquid is also constant in time (see figure 4) – in fact it depends on the temperature only. On the other hand, figure 3 demonstrates rather different physical situation. Except of many modes with constant frequencies (their reasons are the same as in figures 4 and 5), figure 3 indicates the modes with rising frequencies. The obvious reason of continuously rising frequencies is the change of the bubble amount in liquid, i.e. the change of the speed of sound in bubble-liquid mixture in time (cf. figure 3). Moreover, the end of the curve quantifying rising frequency corresponds to the one-quarter wavelength resonator. This curve will be analyzed in the following text.
Figure 2. The speed of sound in bubble liquid mixture – interpretation of a classical Wood’s equation from 1930 according to Wilson and Roy [6].
-50 -55 -60 -65 -70 -75 -80 -85 -90 -95 -100
Relative Amplitude (dB)
Figure 4. Spectrogram of the hot bubble-free water.
4.0
3.5
3.0
2.5
2.0
1.5
1.0
0.5
0
2 4 6 8 10 12 14 16 18
f
(kHz)
t
(s)
-50 -55 -60 -65 -70 -75 -80 -85 -90 -95 -100
Relative Amplitude (dB)
Figure 3. Spectrogram of the hot-chocolate effect.
4.0
3.5
3.0
2.5
2.0
1.5
1.0
0.5
0
2 4 6 8 10 12 14 16 18
f
(kHz)
The dominant frequencies of acoustic responses from figure 3 and figure 4 are also presented in figure 6 where the graphs of the power spectral density (PSD) are shown. Figure 6a shows the PSD of the hot chocolate sound effect (the PSD was done for the stabilized part at the end of the sound record, i.e. approximately from t = 16 s) and figure 6b shows the PSD of the hot bubble-free water sound record. The peaks of dominant frequency are clearly visible in both cases.
Two experimental results with similar parameters (i.e. height of column and temperature) of hot chocolate effect were compared with theoretical relation, eq. (4), the results are presented in figure 7. The experimental and theoretical results are in very good agreement in the increasing parts of the curves; in the final, stabilized parts the experimental values are higher than the theoretical ones. Despite the simplicity of the present experimental setup, the final differences are plausible: the differences are approximately 10%.
The speed of sound was evaluated from experimental data. Resulting points are plotted in figure 8. The dependences of speed of sound on temperature in water according to [7] and [8] are also shown. The height of water (or coffee) column was from 107 mm to 124 mm. Moreover, two additional experiments were performed with the “lower level” of liquid when much shorter columns of 64.5 mm (coffee) and 65.5 mm (water) where used (the “lower level” means the part of the glass below its widening).
Figure 8 shows that the majority of the present experimental data are higher than the reference values [7, 8] by 5% - 10%. The main reason for the differences here (as well as for the differences in figure 7) may be the fact that the acoustic response of the filled glass is very complex problem (as was mentioned above) and the glass widening causes that the liquid column does not behave exactly as a simple one-quarter wavelength resonator and also other oscillatory modes are promoted. It means that
the pure tone of the one-quarter wavelength resonator is contaminated with frequencies of the other modes. This effect is demonstrated by two experiments with “lower level” of liquid in figure 8. The two “lower level” data are in very good agreement with the reference values [7] and [8] – differences are within ±1 %.
Figure 9 shows the spectrogram of another acoustic effect in glass – the so called inverse effect. The experiment was performed using hot tap water (45.7°C) from a partially constricted faucet (according to Crawford [2], who was the first to name the effect). As can be seen in figure 9 the tone firstly goes down (the huge amount of bubbles arises from supersaturated water) and consequently the tone goes gradually up (the bubbles rise up due to the buoyancy force). The curve in spectrogram is denoted with an arrow. Again, the process is very complex and the spectrogram indicates a couple of harmonics and subharmonics.
-50 -55 -60 -65 -70 -75 -80 -85 -90 -95 -100
Relative Amplitude (dB)
Figure 5. Spectrogram of the empty glass.
4.0
3.5
3.0
2.5
2.0
1.5
1.0
0.5
0
2 4 6 8 10 12 14 16 18
f
(kHz)
t
(s)
10
-610
-810
-1010
-1210
-1410
-1610
-1810
-110
010
110
210
310
4PSD
(dB/Hz)
f
(Hz)
f
(Hz)
10
-610
-810
-1010
-1210
-1410
-1610
-1810
-2010
-110
010
110
210
310
410
5PSD
(dB/Hz)
a
b
Figure 6. Power spectral density
(a) the hot-chocolate effect (stabilized part of signal),
4 Conclusions
This study introduced two physical effects known from beverages: the effect of sinking bubbles and the hot chocolate sound effect. These two effects were investigated by means of simple “kitchen” experiments. Despite the simplicity of the approach the results agree well with available literature including reasonable consistence of present data with reference values.
Acknowledgments
The support of the GACR (Project No. P101/11/J019) and of the research plan of the Institute of Thermomechanics (number RVO:61388998) is gratefully acknowledged.
References
1. E.S. Benilov, C.P. Cummings, W.T. Lee, Am. J. Phys. 81, 2 (2013)
2. F.S. Crawford, Am. J. Phys. 50, 5 (1982) 3. F.S. Crawford, Am. J. Phys. 58, 11 (1990)
4. Z. Trávníþek, A.I. Fedorchenko, M. Pavelka, J. Hrubý, J. Sound Vib. 331, (2012)
5. MATLAB, product help
6. P.S. Wilson, R.A. Roy, Am. J. Phys. 76, 01 (2008) 7. D.R. Lide, CRC Handbook of Chemistry and
Physics, (2000) 8. Engineering Toolbox,
http://www.engineeringtoolbox.com/sound-speed-water-d_598.html, cited 17th September 2013
0 500 1000 1500 2000 2500 3000 3500 4000
0 5 10 15 20 t (s) 25
f (Hz)
Theory, eq. (4), ref. [4]
Experiments
Figure 7. Hot-chocolate experiments and comparison with theory, ref. [4].
1200 1300 1400 1500 1600 1700 1800
0 20 40 60 80 100T 120
(oC)
c (m/s)
Engineering Toolbox, ref. [8]
Lide, ref. [7]
Experiments
Experiments, "lower level"
Figure 8. Speed of sound in water, comparison of present experiments with references [7] and [8].
-50 -55 -60 -65 -70 -75 -80 -85 -90 -95 -100
Relative Amplitude (dB)
Figure 9. Spectrogram of the inverse effect.
![figure 2, which is adapted from Wilson and Roy [6], who decreases by occurrence of gas bubbles as is shown in applied a classical Wood’s equation from 1930](https://thumb-us.123doks.com/thumbv2/123dok_us/8206056.1370835/2.595.310.535.352.723/adapted-wilson-decreases-occurrence-bubbles-applied-classical-equation.webp)
![Figure 2 [6]. mixture – interpretation of a classical Wood’s equation from 1930 according to Wilson and Roy](https://thumb-us.123doks.com/thumbv2/123dok_us/8206056.1370835/3.595.48.287.70.282/figure-mixture-interpretation-classical-wood-equation-according-wilson.webp)
![Figure 8. present experiments with references [7] and [8] Speed of sound in water, comparison of](https://thumb-us.123doks.com/thumbv2/123dok_us/8206056.1370835/5.595.67.274.516.749/figure-present-experiments-references-speed-sound-water-comparison.webp)
