Automatic Detection of Tuberculosis using Color Image
Segmentation and Statistical Methods
D.Saravanan
1, R.Parthiban
2, V.S.Shruthi
3Department of Computer Science and Engineering,
IFET College of Engineering and Technology, Villupuram, (India)
ABSTRACT
The bacteria called Mycobacterium tuberculosis causes the infectious disease Tuberculosis (TB), which affects
the lungs most of the times. But it affects any part of the body. There are few diseases which can cause death in
some countries, but TB is one among them. Even though several tools are used for TB detection, but most widely
used tool is the sputum smear microscopy. The problem with the sputum smear microscopy is that it is a slow
process taking more time for TB detection. In addition, most of the countries, including our country, have a
shortage of well trained lab technicians, and sometimes the diagnosis may fail as this process requires eye
strain and concentration. Automatic TB detection methods are the solution to this problem. In this paper, we
will provide a detailed study and analysis on Tuberculosis detection using color image processing and
statistical methods. This study infers that the accuracy of algorithms increases considerably for the detection of
TB automatically.
Keywords—Color model; segmentation; Gaussian; Bayesian; rule-based Classifiers.
I.
INTRODUCTION
Tuberculosis (TB) remains to be one of the infectious disease causing a major public health hazard. The root cause of TB is the airborne bacteria called Mycobacterium tuberculosis (M. tuberculosis) which means that it infects other human being through the air from an infected person. Depending on how long the person is exposed to this bacteria, there is a risk of being infected [1]. There are few methods that can be used for TB screening which includes GeneXpert, microscopy, tuberculin bacilli test (TST), chest X-ray, interferon-γ release assay (IGRA), and culture test. The method that can be used for bright field microscope is microscopic examination for the following reasons: it is somewhat cheaper than other methods, is easy to perform, not requiring much technical expertise and yielding sufficiently fast results [2]. The sputum smear images are used in microscopic examination after staining. Two methods that can be used are: bright field microscopy and fluorescent microscopy. But the difference between these methods are in the light sources and the dyes used for staining. The halogen or high-pressure mercury vapor lamp is used in Fluorescence microscopy, whereas the Ziehl-Neelsen acid-fast stains is used in the conventional microscopy [3].
However, identification of bacilli physically and counting of the number of bacilli (M. tuberculosis) through microscopic examination is a difficult process, which requires a considerable amount of physical strain and mental concentration [4].
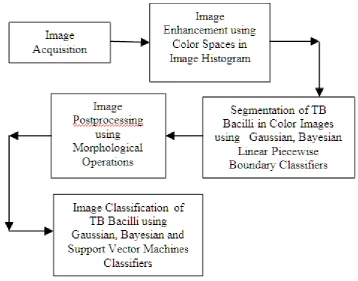
Figure 1.Steps involved in a fully automatic TB detection system.
The sensitivity of the manual detection of TB bacilli also varies greatly depending upon the expertise of the technician [4]. It has been proved that the current screening methods are not that much good enough as it may miss 33–50 % of active cases and automation method has the capability of increasing the accuracy, as machines can screen more fields and can detect cases in the initial stage of the disease itself [5].
Several automatic methods used for bacilli detection using conventional and fluorescence microscopes have been proposed in the literature. The advantages of using the automated methods such as relief from eye strain, better accuracy, multihead visualization, and the ability to store patient records in clouds for future reference, and allowing better and faster decision making. The automated image analysis facilitates on-the-spot diagnosis, enhances the sensitivity by enabling the analysis of a large number of fields than usually done by a technician and enhance the specificity [6]. This paper is structured as follows. Section II provides an overview of computerized TB detection system. In Section III the steps involved in a fully automatic TB detection system, In Section IV discuss the research gap, advantages and disadvantages of different methods and the paper ends with conclusion.
II.
AUTOMATIC
TUBERCULOSIS
DETECTION
SYSTEM
benefits of automated diagnosing systems are [7]: (i) the safety of patients is improved, (ii) the efficiency in health care outcome is improved, and (iii) the quality of care is improved. In health care sectors, automated diagnosing systems are adopted increasingly to improve efficiency [8]. The new automated technology has few advantages: i) saving time, ii) improvement of the quality of diagnosis process, iii) enhancement of the efficiency and productivity and iii) the documentation of patients' records.
A. Image Enhancement using Image Histogram
The image features extracted from fluorescence microscopy images are different from the image features of those images acquired with conventional microscopy [9]. Many researchers have used few filters to reduce the errors due to noise and other artifacts. But, this increases the computational cost and results in an increase in the image acquisition time.
The preprocessing is done in most of the case, to enhance the quality of the acquired images. The enhancement includes removal of noise or enhancement of the contrast. Osaman et al. [10] and Raof et al. [11] proposed the partial contrast method for stretching contrast in the TB image. Contrast enhancement techniques were adapted for a comparative analysis of contrast enhancement for RGB and HSI color spaces. It was inferred that the performance of HSI color space was good as compared to the performance of RGB color space. Anisotropic tabular filtering (ATF) was used for enhancing the quality of the ZN stained image acquired [12].
B. Image Segmentation
Segmentation is the process of partitioning the image into more meaningful regions that extracts the required object. Out of the segmentation algorithms proposed by the researchers, either the similarity principle or the discontinuity principle is followed. The segmentation algorithm is used to distinguish between between M. tuberculosis and background pixels. The commonly used segmentation methods are: (i) thresholding methods, (ii) Clustering algorithms, (iii) artificial neural networks, (iv) Bayesian model (v) fuzzy segmentation etc. The most prominent feature that is used in the literature for detecting M. tuberculosis is color. In ZN stained conventional microscopy, M. tuberculosis is in red color [13] and the background is blue in color. But in auramine-stained fluorescent microscopy, M. tuberculosis appears with colors in the range from green and yellow and sometimes white [14].
C. Feature extraction and classification
The unwanted small artifacts and regions may be present in the image after segmentation. From these segments true bacilli are extracted using the classification methods by combining a set of features that can classify M. tuberculosis. M. tuberculosis bacteria are rod shaped with the length from 1 μm to 10 μm [15]. Commonly used feature descriptors that can be used for extracting the shape features of M. tuberculosis are: i) Fourier descriptors, ii) Hu’s moments, iii) Axis ratio, iv) eccentricity, v) perimeter, and vi) area. After creating the feature vector, all the objects that represent the M. tuberculosis are isolated from other non-Bacillus objects with the help of the efficient classification strategies. The commonly used classification methods are: support vector machine (SVM), Bayesian classifiers, kNN classifiers, and probabilistic neural networks (PNNs) etc.
D. Algorithms developed for images from conventional microscopy
more in R-G images as compared to RGB or HSI images. The bacilli appear as white regions on a dark background in the R-G image. The authors employed the histogram of the R-G image to segment the bacilli, and a threshold value was applied. Morphological and size filters were used to remove the artifacts in the segmented output images. Its low sensitivity is the drawback of their method. Sadaphal et al. [17] adopted a Bayesian segmentation method for segmenting the bacilli. After segmenting the object of interest, the objects were categorized as TB bacilli or not TB bacilli using their shape features. The shape descriptors like axis ratio and eccentricity were used by them.
Makkapati et al. (2009) proposed HSV color space-based approaches [23] by selecting an adaptive hue range for segmenting. A segmentation method using the YCbCr color space was proposed by Sotaquir´a et al. [19]. Different color spaces like RGB, HSV, YIQ, YCbCr, and LAB were considered and it was inferred that the performance of YCbCr is superior than other color spaces with respect to fewer false positives. A threshold on the Cr matrix was used for segmenting the bacilli to have the low time complexity. A study was done by Osman et al. [20] on contrast enhancement using linear stretching for bacilli detection on both RGB and HSV color spaces. Their study shows that linear stretching produces better performance on the HSI color space than RGB for contrast enhancement. The hybrid multi-layered perceptron network (HMLP) was used in for detecting the TB bacilli. It was inferred that Based on their observations in [21], in [22] they used HSV color space.
A combined approach of auto focusing and automatic methods was proposed by Zhai et al. [23] for the detection of TB bacilli. A movable slide stage that can move in x, y, and z directions was used for auto focusing with the help of a step motor. Two-stage segmentation was done such as coarse segmentation and fine segmentation using HSV and Lab color spaces.
II.
METHODOLOGY
The selection of color space is the first step in the segmentation and classification of TB bacilli. The aim of color space in bacilli detection is to increase the separability between two classes. The image is represented by by using a right color space. A digital camera sensor encapsulates the light reflected from objects. Light represents both luminance and chrominance as its attributes. Luminance quantifies the energy of the light sources and chrominance gathers the spectral composition data of the light source. A pixel color in an image is represented by a vector c = [c1, c2, c3]. The color spaces are categorized as the following types: Primary Color Spaces (RGB, Normalized RGB, CIE-XYZ), Perceptually Uniform Color Spaces (CIE-Lab and CIE-Luv), Perceptual Plausible Color Spaces (HSV, HSL, HIS, TSL), Orthogonal Color Spaces (YUV, YIQ, YCbCr, YPbPr, YDbDr, YCgCr, YES, KL Transform), Special-purpose Color Spaces (rg chromaticity, LMS). Figure 1 shows various stages of a fully automatic TB detection system.
As the instruments used for capturing the microscopic sputum smear images consumes more money, we could not include that part as part of this paper. Instead the image data base can be downloaded free of cost.
The commonly used image segmentation algorithms for color image segmentation are: Bayesian Color model and Gaussian color model and Rule-based Classifier
A. Rule-based Classifier
It is the simplest, easiest and computationally efficient approach that can be used for detecting to implement. It is also known with different names such as knowledge-based approach, explicitly-defined bacilli region approach, or piecewise linear decision boundary approach. No training is required for the segmentation. It builds a decision rule using a threshold that discriminates the bacilli pixels from the non-bacilli pixels. It classifies each and every pixel of an image sequentially, individually independently and labels it as bacilli or non-bacilli pixels based on the threshold. The algorithm is implemented for each color spaces individually and independently which is shown in figure 2.
Figure.2. Block diagram of proposed segmentation process using rule based approach
A. Gaussian Color Model
The method is dependent on adjustable parameters – mean vector and covariance vector – that helps in maximizing the bacilli likelihood using Gaussian probability density function. Gaussian model include Single Gaussian model and Gaussian mixture model.
Gaussian Model (SGM/GM) - It is the easiest and simplest parametric model approximated by the conditional
probability density function (pdf) of bacilli colors. The mathematical form of bacilli class conditional probability density function is shown in equation (1):
1/2 T
d/2 1
s s s s
p c / skin
(2 ) C exp 1/ 2 c m C c m
(1)
Here, c, µs and Ʃs represents color vector, mean vector and covariance matrix of the bacilli color respectively. The probability of bacilli color distribution is parameter dependent (µs and Ʃs) and depends on the number of observations in the training sample sets. Alternatively, the Mahalanobis distance can serve the purpose of the covariance matrix and is computed by using equation (2). This model has been used by several researchers.
(2)
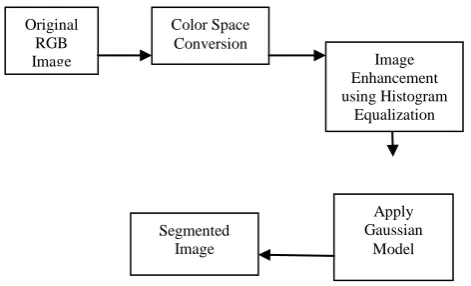
Original RGB Image
Color Space Conversion
Image Enhancement using Histogram
Equalization
Pixelwise Classification
using Thresholding
Method Segmented
Figure. 3. Block diagram of proposed segmentation process using Gaussian Model.
B. Bayesian Color Model
Bayesian model is independent of the choice of color spaces. Two histograms are required in Bayesian model, one for bacilli and one for non-bacilli pixels. According to the model, the probability p(bacilli|c) is given by using the Bayes theorem, given in equation (3).
( | )
( | ) ( )
( | ) ( ) ( | ) ( )
p skin c
p c skin p skin
p c skin p skin p c nonskin p nonskin
(3)
Here, c represents the adopted color space for bacilli classifier, p(c|bacilli) represents the probability that the color of a bacilli pixel is the adopted color space and p(bacilli) represents the probability that a pixel is a bacilli. Figure 4 illustrates the proposed segmentation process using Bayesian Model.
Figure. 4. Block diagram of proposed segmentation process using Bayesian Model.
III.
DISCUSSION
Performing differentiation between bacilli and non-bacilli classes is the main objective of bacilli classifiers, which can be obtained by the selection of the appropriate color space, bacilli color modeling and classification techniques as well as illumination adaptation approaches. It is observed that there is a strong constraint between the degree of bacilli color clustering and the performance of bacilli detection techniques in pixel-based approaches. Histogram approach is suitable in large datasets but it requires large memory storage as compared to mixture and NN models. Bayesian and fuzzy approach based classifier is feasible as compared to NN model as well as other techniques when small datasets are available. Since Bayesian is a non-parametric approach that
Original RGB Image
Color Space Conversion
Apply Gaussian
Model Segmented
Image
Original RGB Image
Color Space
Conversion Image Enhancement using Histogram
Equalization
Apply Bayesian
Model Segmented
Image
Image Enhancement using Histogram
requires large memory storage as compared to fuzzy approach. The latter can be taken theoretically as the best approach among these.
Getting a robust and an efficient bacilli color model under varying and unpredictable situations is quiet a problem. However, color constancy and dynamic adaptation approaches are effectively used as a pre-processing step to overcome the difficulties. Dynamic adaptation approaches upgrade the existing bacilli detection techniques so that it can adapt the environmental changes effectively and produce a robust bacilli detection model. The study is carried out to test the performance of thirteen different color spaces with the images usable in bacilli detection problems. The main aim of the study is to discover the performance of color spaces for bacilli detection process under the variety of challenging factors. To address the issue, color spaces with the rule-based approach and Gaussian-based approach under complex environmental situations have been tested. Experimentally, it is found that rule-based approach has outperformed the Gaussian-based approach. YCbCr model with rule-based approach has outperformed all other models and classifier pairs. YCC, YES, YUV and YPbPr with rule-based approach have also performed well. In Gaussian-based approach, YUV model has outperformed other color models. It is also found that all the color spaces have performed well with Gaussian-based approach with respect to RGB model except XYZ and YDbDr color model. .
IV.
CONCLUSION
The main aim of the study is to discover the performance of color spaces for bacilli detection process under the variety of challenging factors. To address the issue, color spaces with the rule-based approach, Bayesian approach and based approach will be tested. The rule-based approach will outperform the Gaussian-based approach. YCbCr model with rule-Gaussian-based approach will outperform all other models and classifier pairs. YCC, YES, YUV and YPbPr with rule-based approach will also perform well. In Gaussian-based approach, YUV model will outperform other color models. All the color spaces will perform well with Gaussian-based approach with respect to RGB model except XYZ and YDbDr color model.
REFERENCES
[1] Er, O., Temurtas, F., and Tanrıkulu, A.C., Tuberculosis disease diagnosis using artificial neural networks. J. Med. Syst. 34:299–302, 2010.
[2] Osman,M.K., Mashor,M., and Jaafar, H., Combining Thresholding and Clustering Techniques for Mycobacterium tuberculosis Segmentation in Tissue Sections. Aust. J. Basic Appl. Sci. 5(12): 1270–1279 ISSN 1991-8178, 2011.
[3] Steingart, K.R., Henry, M., Vivienne, N., Hopewell, P.C., Ramsay, A., Cunningham, J., Urbanczik, R., Perkins, M., Aziz, M.A., and Pai, M., Fluorescence versus conventional sputum smear microscopy for tuberculosis: a systematic review. Lancet Infect. Dis. 6(9): 570–581, 2006.
[5] Veropoulos, K., Campbell, C., Learmonth, G., Knight, B., and Simpson, J., TheAutomated Identification of Tubercle Bacilli using Image Processing and Neural Computing Techniques. In Proc. of the 8th International Conference on Artificial Neural Networks, Skövde, 797–802, 1998.
[6] Tapley, A., Switz, N., Reber, C., Davis, J.L., Miller, C., Matovu, J.B.,Worodria,W., Huang, L., Fletcher, D.A., and Cattamanchi, A., Mobile digital fluorescence microscopy for diagnosis of tuberculosis. J. Clin. Microbiol. 51(6):1774–1778, 2013.
[7] Chang, I.C., Hwang, H.G., Hung, W.F., and Li, Y.C., Physicians’ acceptance of pharmacokinetics-based clinical decision support systems. Expert Syst. Appl. 33(2):296–303, 2007.
[8] Veropoulos, K., Campbell, C., Learmonth, G., Knight, B., and Simpson, J., TheAutomated Identification of Tubercle Bacilli using Image Processing and Neural Computing Techniques. In Proc. of the 8th International Conference on Artificial Neural Networks, Skövde, 797–802, 1998.
[9] Costa Filho, C. F. F., and Costa, M. G. F., Sputum Smear Microscopy for Tuberculosis: Evaluation of Autofocus Functions and Automatic Identification of Tuberculosis Mycobacterium. Understanding Tuberculosis - Global Experiences and Innovative Approaches to the Diagnosis, Dr. Pere-Joan Cardona (Ed.), ISBN: 978–953-307-938-7, InTech, pp. 277–292,2012.
[10] Osman,M. K.,Mashor,M. Y., Jaafar, H., Raof, R A A., and Harun, N., Performance comparison between RGB and HSI linear stretching for tuberculosis bacilli detection in Ziehl-Neelsen tissue slide images. In Proc. of IEEE International Conference on Signal and Image Processing Applications (ICSIPA), Kuala Lumpur, 357–362, 2009.
[11] Raof, R. A. A., Mashor, M. Y., Ahmad, R. B., and Noor, S. S. M., Image Segmentation of Ziehl-Neelsen Sputum Slide Images for Tubercle Bacilli Detection. In: Dr. Pei-Gee Ho (Ed.), Image Segmentation, ISBN: 978-953-307-228-9, InTech. 365–378, 2011.
[12] Santiago-Mozos, R., Pérez-Cruz, F., Madden, M.G., and Artés-Rodríguez, A., An Automated Screening System for Tuberculosis.IEEE journal of Biomedical and Health informatics. 18(3):855–862, 2014. [13] Makkapati, V., Agrawal, R., and Acharya, R., Segmentation and classification of tuberculosis bacilli from
ZN-stained sputum smear images. In proc. Of IEEE International Conference on Automation Science and Engineering (CASE), Bangalore, 217–220, 2009.
[14] Forero, M.G., Sroubek, F., and Cristóbal, G., Identification of tuberculosis bacteria based on shape and color. Real-Time Imaging. 10(4):251–262, 2004.
[15] Forero-Vargas, M.G., Sierra-Ballen, E.L., Alvarez-Borrego, J., Pech-Pacheco, J.L., Cristobal-Perez, G., Alcala, L., and Desco,
M., Automatic sputum color image segmentation for tuberculosis diagnosis. In Proc. of SPIE Algorithms and Systems for Optical Information Processing V. 4471:251–261, 2001.
[16] Costa,M. G., Costa Filho, C. F. F., Sena, J. F., Salem, J., and Lima, M. O., Automatic identification of Mycobacterium tuberculosis with conventional light microscopy. In Proc. of 30th Annual International IEEE Eng Med Biol Soc. Vancouver, Canada, pp. 382–385, 2008.
[18] Makkapati, V., Agrawal, R., and Acharya, R., Segmentation and classification of tuberculosis bacilli from ZN-stained sputum smear images. In proc. Of IEEE International Conference on Automation Science and Engineering (CASE), Bangalore, 217–220, 2009.
[19] Sotaquirá, M., Rueda, L., and Narvaez, R., Detection and quantification of bacilli and clusters present in sputum smear samples: a novel algorithm for pulmonary tuberculosis diagnosis. In Proc.of International Conference on Digital Image Processing, Bangkok, 117–121, 2009.
[20] Osman,M. K.,Mashor,M. Y., Jaafar, H., Raof, R A A., and Harun, N., Performance comparison between RGB and HSI linear stretching for tuberculosis bacilli detection in Ziehl-Neelsen tissue slide images. In Proc. of IEEE International Conference on Signal and Image Processing Applications (ICSIPA), Kuala Lumpur, 357–362, 2009.
[21] Osman, M. K., Mashor, M. Y., and Jaafar, H., Detection of Mycobacterium tuberculosis in Ziehl-Neelsen stained tissue images using Zernike moments and hybrid multilayered perceptron network.In Proc. of IEEE International Conference on Systems Man and Cybernetics (SMC), Istanbul, 4049–4055, 2010.
[22] Osman, M.K., Mashor, M. Y., and Jaafar, H., Segmentation of tuberculosis bacilli in Ziehl-Neelsen tissue slide images using Hibrid Multilayered Perceptron network. In proc. of 10th International Conference on Information Sciences Signal Processing and their Applications (ISSPA), Kuala Lumpur, 365–368, 2010. [23] Zhai, Y., Liu, Y., Zhou, D., and Liu, S., Automatic Identification of Mycobacterium tuberculosis from