708 | P a g e
A COMPARISON BETWEEN DIFFERENT
OPTIMIZATION TECHNIQUES FOR MILLING
PROCESS TO OPTIMISED PARAMETRIC
DETERMINATION ON ATLAC 382-05 COMPOSITES
D.Ramalingam
1, Dr.M.Saravanan
2, R.Rinu Kaarthikeyen
3Dr.G.Manikandan
41
Associate Professor, Nehru Institute of Technology, Coimbatore (India)
1
Principal, SSM Institute of Engineering and Technology, Dindigul (India)
2
Research Associate, Manager – Engineering, TCMPFL, Chennai ( India)
3
Research Associate, Nehru Institute of Engg & Tech, Coimbatore (India)
ABSTRACT
Milling operation in FRP composite materials is one of the challenging tasks in the manufacturing industries. At the same time, to achieve the concern dimensional accuracy in the product with the required surface quality is equally important rather than any such challenges. Delamination is the major concern in processing of FRP materials. In order to obtain the desired quality outcome in this investigation the optimisation of machining parameters and forecasting the best suited combination are effected through six designated algorithms. Cutting speed and tool feed are taken as input parameters and the surface finish, delamination, machining forces as output parameters while drilling ATLAC 382-05 composite. The analysis through the regression relationship as a link to the optimisation algorithms is performed. As a new move in the simulation through soft computing the outcome of the second best resulted algorithm is assigned as the input to the first best responded algorithm and the optimised parameter combinations were identified for each output parameter.
Key words- ATLAC 382-05composite, Milling, Regression, Simulated Annealing Algorithm,
Genetic algorithm, Scatter search algorithm, Particle swarm optimisation algorithm, Ant colony
optimisation algorithm, Tabu search Algorithm, Minitab, MATLAB
.
I. INTRODUCTION
The application of FRP composite materials are attractive and more significant in the fields aerospace, aircraft,
transportation, marine bodies etc because to their high strength and rigidity attached with low weight, excellent
709 | P a g e
alteration of these composites into final products is connected with machining by conventional as well as non
conventional methods of machining. Among these machining operations, milling has the considerable degree of
application in assembling parts to make into the final product for application. At time of milling operations
manufacturers used face the common quality problems like delamination, obtaining the dimensional accuracy
and precision, required surface finish. All of these main issues are closely associated with the materials
properties and process parameters like machining speed; tool feed rate, tool material and properties, tool
geometry etc. In this investigation the FRP composite namely ATLAC 382-05 is taken for analysis while
undergoing milling operations. Cutting Speed, feed, delamination factor, Surface roughness and Machining
force are the parameters considered.
II. RELATED LITERATURE
For a considerable period of time many researches are performed sequentially by making attempts through
several methods and technology to locate the issues related and suggesting various approaches to achieve the
most desired results in various machining processes on various materials like metals, alloys, composites.
Moreover in order to understand the effects of machining parameters in the various machining many of the
researchers used optimization techniques. Raviraj Shetty et al. [1] conducted an exclusive study with the
Taguchi optimization method to optimize the machining parameters in the turning operation on the age hardened
AlSiC - MMC with CBN cutting tool. Feng [2] has established with the findings of the research that the feed
rate, the tool nose radius, the work material and speeds and the tool point angle have a significant impact on the
surface quality by applying the fractional factorial experimentation method. Paulo Davim et al.[3] conducted
experiment in milling operations on two FRP materials ATLAC 382-05, Viapal VUP 9731 and analysed the
influence of cutting speed and feed on the outcome variables like delamination, surface roughness and cutting
force through Anova technique.
David et al. [4] have demonstrated through an approach for predicting Surface roughness in a high speed
end-milling process by ANN approach and statistical tools to predict the different surface roughness predictor’s
combinations. Kirby, D.E, and Joseph, C.C. [5] have recognized the occurrence of the quality issues in the
resultant parameters in cutting operations carried out on turning and milling machines which includes the
machine tool condition, job clamping, tool and workpiece geometry, and cutting parameters used for machining.
They developed a Fuzzy based prediction approach to optimize the surface roughness. Palanikumar K [6] stated
that the average surface roughness / surface finish are recognized as significant aspect in the processing of
composites and the average surface roughness (Ra) is commonly used in industry.
Xinwang et al. [7] have investigated the thrust force and torque influence while drilling over GFRP, CFRP
materials using HSS drills and carbide drills. During the investigation they noticed that with the increase in the
depth of the hole, the thrust force increased. In addition to that, the observation lead to identify the increase in
the thrust force along the feed rate increases. This is the consequence of the increment in the MRR as the feed
rate increases. C.C.Tsao [8] has proposed the usage of Grey - Taguchi method towards optimizing the
machining parameters while conducting milling operations in aluminium alloy. They conclusion was that the
710 | P a g e
process of A6061P-T651 aluminum alloy. Emad Ellbeltagi et al. [9] offered a dissertation on assessment among
five evolutionary–based optimization algorithms namely GA, MA, PSO, ACO, and SFL. A couple of yardstick
continuous optimization test issues were resolved through using all and through the study, they have concluded
that, the PSO method was generally found to perform better than other algorithms in terms of success rate and
solution quality.
In this paper the analysis and prediction of optimized parametric combination is identified with six designated
optimization algorithm methods through MATLAB programming. A novel approach of feeding the regression
equation relationship as input instead of random approach based on the fitness of the equation developed in
Minitab.
III. EXPERIMENTAL PROCEDURE
ATLAC 382-05 is the composite materials prepared through hand lay-up to the specification of 22 mm of
thickness disc used as the specimen material to carry out the machining operations. The specific properties of
the material are as follows in Table 3.1.
Table 3.1 Properties of ATLAC 382-05 composite
Property Value
Flexural strength (DIN EN 63) 380 N/mm2
Tensile modulus (DIN 53457) 25,275 N/mm2
Tensile strength (DIN EN 61) 404 N/mm2
Compressive strength (DIN 53454) 145 N/mm2
Tensile elongation (DIN EN 61) 1.73 %
Impact resistance (DIN 53453) 190 kJ/m2
Martens temperature (DIN 53458) 240 0C
Thermal conductivity (DIN 52612) 0.22 W/m0C
Operations were carried out in the ‘‘VCE500 MIKRON’’ machining center which has the maximum spindle
speed as 7500 rpm and 11 kW spindle power. The cutting tool selected for this a cemented carbide end mill with
5 mm diameter. The depth of cut chosen to 2 mm. The input cutting parameters selection with three levels
quoted in the Table 3.2.
Table 3.2 Cutting parameters level
Turning parameters Level 1 Level 2 Level 3
Cutting speed, m/min. 47 79 110
Feed, mm/rev. 0.04 0.08 0.12
Taguchi’s L9 array was fixed for the experimental follow up. The output parameters considered for evaluation
of the performance of the operations on the specimen materials were delamination factor (Df), surface
roughness (Ra) and machining force on the workpiece (Fm). The damage affected on the work material during
machining was measured with the microscope Mitutoyo TM 500, with 30 x magnification and 1 µm resolution.
711 | P a g e
9257B piezoelectric dynamometer was used to observe the components of machining forces. The experiment
conducted and the data observed by Paulo Davim et al. [3]taken forthis investigation are presented in the Table
3.3.
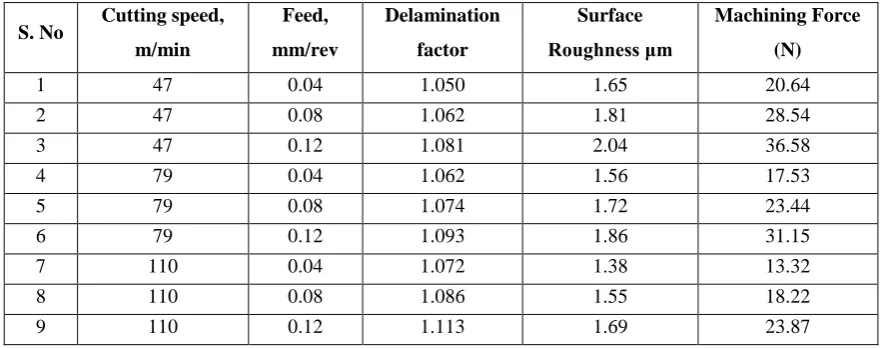
Table 3.3 Experimental observed data
S. No Cutting speed, m/min Feed, mm/rev Delamination factor Surface Roughness μm Machining Force (N)
1 47 0.04 1.050 1.65 20.64
2 47 0.08 1.062 1.81 28.54
3 47 0.12 1.081 2.04 36.58
4 79 0.04 1.062 1.56 17.53
5 79 0.08 1.074 1.72 23.44
6 79 0.12 1.093 1.86 31.15
7 110 0.04 1.072 1.38 13.32
8 110 0.08 1.086 1.55 18.22
9 110 0.12 1.113 1.69 23.87
IV. MATHEMATICAL MODELLING
Minitab17 software is used to analyze the influence of the input variables with the output variables for statistical
regression analysis. Since the second order regression relationship between the variables are with the higher
values of the R – sq comparing to the first order regression, it is evident that the second order regression is more
significant statistically in projecting the influence between the variables. R-sq(adj) and R-sq(pred) values of
second order also in line with the R-sq values. Hence forth second order equation is selected for further analysis.
From the Table 4.1 to 4.3 output parameter wise comparison of the first and second order regression model is
listed.
Table 4.1 Regression model comparison for Delamination factor
Parameter Regression S R-sq R-sq(adj) R-sq(pred) Durbin - Watson
Df 1
st
order 0.0036684 97.18% 96.24% 92.71% 2.12627
2nd order 0.0020493 99.56% 98.83% 94.82% 1.96034
Table 4.2 Regression model comparison for Surface roughness
Parameter Regression S R-sq R-sq(adj) R-sq(pred) Durbin - Watson
Ra 1
st order 0.0292914 98.29% 97.72% 95.83% 1.07698
2nd order 0.0246532 99.39% 98.38% 92.85% 2.15594
Table 4.3 Regression model comparison for cutting force
Parameter Regression S R-sq R-sq(adj) R-sq(pred) Durbin - Watson
Fm 1
st order 1.20053 97.99% 97.23% 93.90% 1.13125
712 | P a g e
Such framed second order regression equations through the Minitab17 for the individual output parameter in
terms of input parameter combination are
Delamination factor = (1.0443) + (0.000064*cutting speed) – (0.176*feed) + (0.000001*cutting speed^2)
+ (2.812*feed^2) + (0.001973*cutting speed*feed); (4.1)
Surface roughness = (1.478) + (0.00121*cutting speed) + (5.09*feed) – (0.000029*cutting speed^2)
+ (2.1*feed^2) – (0.01598*cutting speed*feed);
(4.2)
Machining force = (14.45) + (0.0186*cutting speed) + (206.4*feed) – (0.000597*cutting speed^2)
+ (280*feed^2) – (1.069*cutting speed*feed);
(4.3)
Figure 4.1 Residual plots of surface roughness Figure 4.2 Residual plots of delamination factor
The residual plots through Minitab analysis for the two important resultant parameters surface roughness and
delamination factors are depicted in Figure 4.1 and 4.2. Through performing the best subset regression analysis
the parameter feed is highly influencing on all the three output parameters followed by the speed. The
influencing level of feed and speed over individual output parameters are listed through Table 4.4. Balancing of
both the parameters in the optimum level is to be maintained at time of machining so as to obtain the objectives
of the manufacturing.
Table 4.4 Input parameters influencing level on the output parameters
Output parameters Influence level of Feed Influence level of Speed
Surface Roughness 55.4 % 42.8 %
Delamination 61.8 % 35.4 %
713 | P a g e
V. OPTIMISATION METHODOLOGY
In the present analysis towards optimizing the parameters Scatter search algorithm, Simulated Annealing
Algorithm, Ant colony algorithm, Particle swarm optimisation algorithm, Tabu Search Algorithm and Genetic
algorithm are employed. Prediction of the optimized Surface roughness and Delamination factor along with the
machining force which is the process parameter generated at time of machining in the experimented ATLAC
382-05 composite material was prepared with the objective of analyzing the influence of the cutting speed and
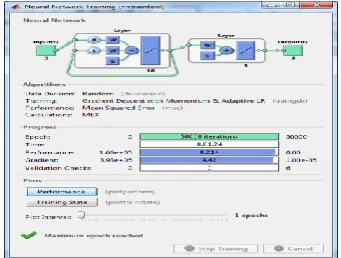
the feed of the tool in the MATLAB R2017 platform with the Elman Back Propagation approach. With 50000
turns of iterations the values of the output parameters with reference to the input parameters combinations are
computed through these algorithms are compared with the experimental observations individually. Figure 5.1
reveals the progress of the training data in MATLAB. The accuracy level of the each algorithm is assessed with
the error rate in computation and listed in the Table 5.1
Table 5.1 Error rate of computation for 25000 iterations
Algorithms SSA SAA Tabu PSO ACO GA
Error rate 0.008738 0.008883 0.009623 0.010436 0.012409 0.018553
Ranking 1 2 3 4 5 6
In the lead of the comparison, it is evident that the Scatter Search algorithm is focusing the most optimized
values as the error rate revealed is with the lowest value (0.008738) which is immediately followed by
Simulated Annealing Algorithm of error value (0.008883). Tabu Search, PSO, ACO and GA algorithms are
attained the third, fourth, fifth and sixth position respectively. As a new approach the second best algorithm
(SAA) results are given as the input to the first best algorithm (SSA) and the computation was effected. Along
with this the condition for computation is modified with the regression relationship equations instead of taking
random selection of combination while computing through the algorithms. Final results were checked for the
accuracy in computations and noticed that the error value (0.008664) is further reduced and converges with the
lowest deviation. Hence the Regression relationship based Simulated Annealing Algorithm feed Scatter Search
Algorithm (SAA feed SSA) results are taken as the optimisation method which suitable for this attempt. In view
of obtaining the results for the in between values of the level chosen for the experiment, the condition with
uniform step interval is fed into the algorithm computation. The step value taken for speed is 6.3 and feed is
0.008 (ten equal intervals for both the cases). The computed results through this approach are listed in the Table
5.2 to Table 5.
714 | P a g e
Table 5.2 Df, Ra, Fm for the speed 47, 53.3 m /min Vs all combination of feedSpeed 47 m / min Speed 53.3 m / min
Feed Delamination Surface
Roughness
Machining
Force Delamination
Surface
Roughness
Machining
Force
0.040 1.091 1.655 20.696 1.112 1.643 20.169
0.048 1.078 1.699 22.145 1.079 1.689 21.560
0.056 1.080 1.740 23.627 1.072 1.731 22.987
0.064 1.083 1.784 25.143 1.073 1.772 24.451
0.072 1.074 1.826 26.697 1.077 1.813 25.954
0.080 1.086 1.867 28.289 1.076 1.854 27.488
0.088 1.071 1.909 29.912 1.076 1.897 29.060
0.096 1.088 1.953 31.574 1.080 1.942 30.669
0.104 1.074 1.996 33.274 1.081 1.987 32.313
0.112 1.092 2.041 35.007 1.084 2.031 33.992
0.120 1.080 2.082 36.771 1.086 2.073 35.706
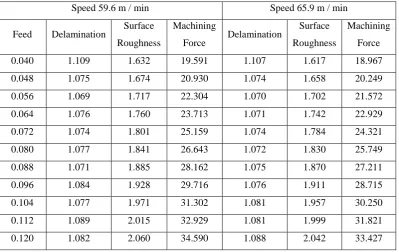
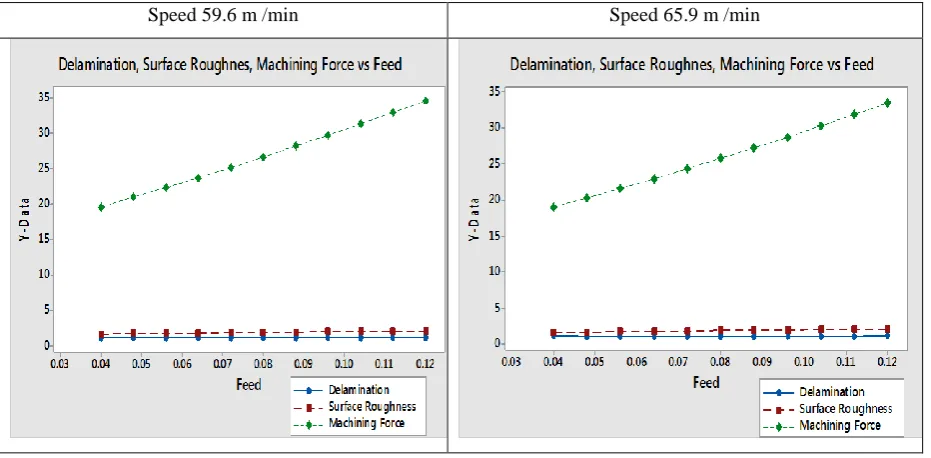
Table 5.3 Df, Ra, Fm for the speed 59.6, 65.9 m /min Vs all combination of feed
Speed 59.6 m / min Speed 65.9 m / min
Feed Delamination Surface
Roughness
Machining
Force Delamination
Surface
Roughness
Machining
Force
0.040 1.109 1.632 19.591 1.107 1.617 18.967
0.048 1.075 1.674 20.930 1.074 1.658 20.249
0.056 1.069 1.717 22.304 1.070 1.702 21.572
0.064 1.076 1.760 23.713 1.071 1.742 22.929
0.072 1.074 1.801 25.159 1.074 1.784 24.321
0.080 1.077 1.841 26.643 1.072 1.830 25.749
0.088 1.071 1.885 28.162 1.075 1.870 27.211
0.096 1.084 1.928 29.716 1.076 1.911 28.715
0.104 1.077 1.971 31.302 1.081 1.957 30.250
0.112 1.089 2.015 32.929 1.081 1.999 31.821
715 | P a g e
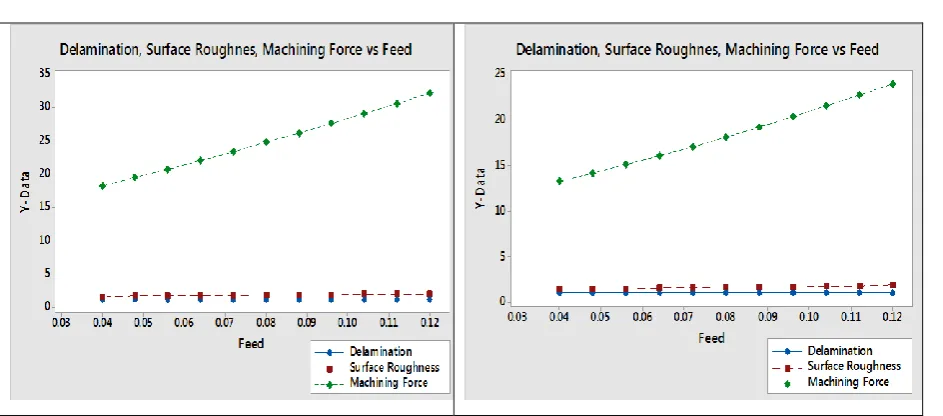
Table 5.4 Df, Ra, Fm for the speed 72.2, 78.5 m /min Vs all combination of feedSpeed 72.2 m / min Speed 78.5 m / min
Feed Delamination Surface
Roughness
Machining
Force Delamination
Surface
Roughness
Machining
Force
0.040 1.103 1.599 18.296 1.097 1.580 17.575
0.048 1.072 1.642 19.527 1.071 1.623 18.756
0.056 1.068 1.683 20.792 1.071 1.663 19.966
0.064 1.076 1.727 22.097 1.073 1.704 21.214
0.072 1.074 1.768 23.432 1.075 1.746 22.499
0.080 1.078 1.808 24.807 1.074 1.789 23.819
0.088 1.071 1.854 26.217 1.079 1.832 25.177
0.096 1.084 1.894 27.663 1.077 1.873 26.568
0.104 1.076 1.940 29.147 1.085 1.920 27.994
0.112 1.088 1.985 30.664 1.081 1.965 29.459
0.120 1.079 2.027 32.217 1.093 2.005 30.958
Table 5.5 Df, Ra, Fm for the speed 84.8, 91.1 m /min Vs all combination of feed
Speed 84.8 m / min Speed 91.1 m / min
Feed Delamination Surface
Roughness
Machining
Force Delamination
Surface
Roughness
Machining
Force
0.040 1.095 1.558 16.809 1.086 1.532 15.995
0.048 1.072 1.601 17.934 1.072 1.577 17.066
0.056 1.070 1.641 19.092 1.072 1.618 18.171
0.064 1.078 1.681 20.284 1.076 1.659 19.311
0.072 1.078 1.726 21.516 1.080 1.702 20.489
0.080 1.079 1.770 22.784 1.081 1.742 21.699
0.088 1.079 1.811 24.084 1.085 1.785 22.948
0.096 1.087 1.852 25.425 1.085 1.826 24.234
0.104 1.082 1.898 26.800 1.092 1.872 25.553
0.112 1.093 1.938 28.207 1.089 1.913 26.908
0.120 1.084 1.985 29.656 1.099 1.958 28.302
716 | P a g e
Figure 5.2 Df, Ra, Fm for the speed 47, 53.3 m /min Vs all combination of feedThe plots graphically generated through Minitab software referring to the computed values are follow through
the Figure 5.2 to Figure 5.5
Speed 59.6 m /min Speed 65.9 m /min
Figure 5.3 Df, Ra, Fm for the speed 59.6, 65.9 m /min Vs all combination of feed
717 | P a g e
Figure 5.4 Df, Ra, Fm for the speed 72.2, 110 m /min Vs all combination of feedVI. RESULTS AND CONCLUSION
Milling experiment conducted on the ATLAC 382-05 composite material. Cutting Speed (m / min), Feed (mm /
rev) are taken as input variables and Machining force (N), Delamination factor (mm/mm), Surface roughness
(µm) are taken as output variable. Second order regression mathematical modelling is taken for processing in
simulating the algorithms. For optimizing the parameters Scatter search algorithm, Simulated Annealing
Algorithm, Ant colony algorithm, Particle swarm optimisation algorithm, Tabu Search Algorithm and Genetic
algorithm were employed in MATLAB platform. Scatter Search Algorithm is converged with the minimum
error value as best result followed by Simulated Annealing algorithm. On replacing with the random process
with regression relationship, feeding the second best algorithm outcome (SAA) as input to the first best
algorithm (SSA) improvement in results was obtained. With the allotment of in-between equal interval values
the computation is performed and plotted graphically.
The optimum value of Surface roughness Ra is 1.446 μm for the feed 0.040 mm / rev and speed 110 m / min.
Optimum Delamination value is obtained in the feed 0.056 mm /rev, speed 72.2 m / min combination as 1.068.
The optimum value of machining force obtained is 13.268 Nfor the combination of feed as .040 mm / rev and
speed 110 m / min. Tool feed is the most influencing input cutting parameter than the speed on all the output
parameters. From the plotted graphs, based on the quality requirement on the end product the manufacturers can
locate the combination of speed and feed rate.
REFERENCES
[1]Raviraj shetty, Taguchi’s techniques in machining of metal matrix composites. J. of the Braz .society of
Mech.Sci. & Eng, 16 (1), 2009, 12-20.
[2]C X. Feng, An experimental study of the impact of turning parameters on surface roughness, In:
718 | P a g e
[3]J. Paulo Davim, Pedro Reis, C. Conceicao Antonio, A study on milling of glass fiber reinforced plasticsmanufactured by hand-lay up using statistical analysis (ANOVA). Composite Structures 64, 2004, 493-500.
[4]V. David, M. Ruben, C. Menendez, J. Rodriguez and R. Alique, Neural networks and statistical based
models for surface roughness prediction, International Association of Science and Technology for
Development. Proceedings of the 25th IASTED international conference on Modeling, Identification and
Control, 2006, 326-331.
[5]D E. Kirby and C C. Joseph, Development of a Fuzzy-Nets-Based surface roughness prediction system in
turning operations, Journal of Computers & Industrial Engineering. 53, 2007, 30-42.
[6]K Palanikumar. K. 2008. Application of Taguchi and response surface methodologies for surface roughness
in machining glass fiber reinforced plastics by PCD tooling. International Journal of Advanced
Manufacturing Technology. 36 (1), 19-27.
[7]Xin Wang, J.P. Tao. 2004. Investigation on thrust in vibration drilling of fiber-reinforced plastics. Journal of
Material Processing Technology. 148, 239-244.
[8]Tsao. C.C. 2009. Grey - Taguchi method to optimize the milling parameters of aluminum alloy, Int. J. Adv.
Mfg. Tech, Vol.40, pp.41- 48.
[9]Emad Ellbeltagi, Tarek Hegazy, Donald Grierson. 2005. Comparison among five evolutionary based