Western University Western University
Scholarship@Western
Scholarship@Western
Electronic Thesis and Dissertation Repository
9-22-2014 12:00 AM
Visual Perception and Cognition in Image-Guided Intervention
Visual Perception and Cognition in Image-Guided Intervention
Kamyar Abhari
The University of Western Ontario
Supervisor Dr. Terry Peters
The University of Western Ontario Joint Supervisor Dr. Roy Eagleson
The University of Western Ontario
Graduate Program in Biomedical Engineering
A thesis submitted in partial fulfillment of the requirements for the degree in Doctor of Philosophy
© Kamyar Abhari 2014
Follow this and additional works at: https://ir.lib.uwo.ca/etd
Part of the Other Biomedical Engineering and Bioengineering Commons
Recommended Citation Recommended Citation
Abhari, Kamyar, "Visual Perception and Cognition in Image-Guided Intervention" (2014). Electronic Thesis and Dissertation Repository. 2432.
https://ir.lib.uwo.ca/etd/2432
This Dissertation/Thesis is brought to you for free and open access by Scholarship@Western. It has been accepted for inclusion in Electronic Thesis and Dissertation Repository by an authorized administrator of
VISUAL PERCEPTION AND COGNITION IN IMAGE-GUIDED
INTERVENTION
(Thesis format: Integrated Article)
by
Kamyar Abhari
Graduate Program in Biomedical Engineering
A thesis submitted in partial fulfillment
of the requirements for the degree of
Doctor of Philosophy
The School of Graduate and Postdoctoral Studies
Western University
London, Ontario, Canada
c
i
Abstract
Surgical image visualization and interaction systems can dramatically affect the
ef-ficacy and efficiency of surgical training, planning, and interventions. This is even more
profound in the case of minimally-invasive surgery where restricted access to the
oper-ative field in conjunction with limited field of view necessitate a visualization medium
to provide patient-specific information at any given moment. Unfortunately, little
re-search has been devoted to studying human factors associated with medical image
displays and the need for a robust, intuitive visualization and interaction interfaces has
remained largely unfulfilled to this day. Failure to engineer efficient medical solutions
and design intuitive visualization interfaces is argued to be one of the major barriers
to the meaningful transfer of innovative technology to the operating room. This thesis
was, therefore, motivated by the need to study various cognitive and perceptual aspects
of human factors in surgical image visualization systems, to increase the efficiency and
effectiveness of medical interfaces, and ultimately to improve patient outcomes. To this
end, we chose four different minimally-invasive interventions in the realm of surgical
training, planning, training for planning, and navigation: The first chapter involves the
use of stereoendoscopes to reduce morbidity in endoscopic third ventriculostomy. The
results of this study suggest that, compared with conventional endoscopes, the
detec-tion of the basilar artery on the surface of the third ventricle can be facilitated with
the use of stereoendoscopes, increasing the safety of targeting in third ventriculostomy
procedures. In the second chapter, a contour enhancement technique is described to
improve preoperative planning of arteriovenous malformation interventions. The
pro-posed method, particularly when combined with stereopsis, is shown to increase the
speed and accuracy of understanding the spatial relationship between vascular
struc-tures. In the third chapter, an augmented-reality system is proposed to facilitate the
training of planning brain tumour resection. The results of our user study indicate that
formulat-ii
ing the optimal point of entry and surgical path independent of the sensorimotor tasks
performed. In the last chapter, the role of fully-immersive simulation environments on
the surgeons’ non-technical skills to perform vertebroplasty procedure is investigated.
Our results suggest that while training surgeons may increase their technical skills, the
introduction of crisis scenarios significantly disturbs the performance, emphasizing the
iii
Acknowlegements
I would like to start by acknowledging my supervisor and my mentor, Dr. Terry
Peters, whose expertise, understanding, and patience, added considerably to my
grad-uate experience. Throughout my PhD, he has always been a source of guidance and
support, and I truly feel honoured to have had the opportunity to learn from him and
to benefit from his breadth of knowledge and deep insights.
I would like to express my sincere gratitude to my co-supervisor, Dr. Roy Eagleson,
as well as Dr. Sandrine de Ribaupierre for their support in and out of graduate school.
I am truly thankful for their help in writing papers and conducting experiments, and
for their assistance at all levels of this research project. This work would have not been
possible without them.
Special thanks goes out to John Moore, Chris Wedlake, Dr. Elvis Chen, Dr. Ali Khan
for sharing their expertise and providing advice and assistance at every level of this
research work. It has truly been a privilege to work with and learn from them. I would
also like to thank Dr. David Holdsworth for his valuable advice and guidance along the
way.
I am particularly grateful to John Baxter for his assistant, technical support, and his
significant contribution to my studies. I would also like to thank Saeed Bakhshmand
for his assistant in data collection.
I would like to thank Dr. Nassir Navab for the opportunity of working at his
won-derful lab in Munich. I like to thank everybody at NARVIS lab, particularly Dr. Pascal
Fallavolitta, Patrick Wucherer, Philipp Stefan, Dr. Matthias Weigl, and Dr. Simon
Wei-dert for making my stay memorable.
I would also like to thank my examiners, Dr. Hanif Ladak, Dr. Tim Wilson, Dr. Ana
iv
I would like to thank everybody in Dr. Peter’s, Dr. Fenster’s, and Dr. Drangova’s lab,
as well as many others at Robarts for their thoughtful discussions, helpful criticisms,
and, most of all, for their friendship. I also like to thank all the surgeons, residents, and
students who participated in my studies which sometimes lasted for more than three
hours!
Finally, I would like to thank my parents and my brothers for their unconditional
love and support. I am truly grateful for having them by me and none of my
Contents
Abstract i
Acknowledgments iii
List of Figures xi
List of Tables xvii
List of Appendices xviii
List of Abbreviations xix
1 Introduction 1
1.1 Visual Perception . . . 2
1.1.1 Visual System . . . 2
1.1.2 Visual Cues . . . 5
Colour . . . 6
Form . . . 6
Motion . . . 8
Depth cues . . . 8
Translucency . . . 11
1.1.3 Bottom-Up & Top-Down Processes . . . 12
Bottom-up processing . . . 12
Top-down processing . . . 13
CONTENTS vi
1.1.4 Measurement of Visual Perception: Psychophysics . . . 14
1.1.5 Sensitivity Index . . . 16
1.2 Cognition . . . 16
1.2.1 Visual Attention . . . 17
1.2.2 Cognitive Load . . . 17
1.2.3 Visuospatial Reasoning . . . 18
1.2.4 Measurement of Cognition . . . 20
1.3 Visuomotor Processing . . . 21
1.4 Layout of Dissertation . . . 21
1.4.1 Chapter 2: The Role of Stereopsis in Endoscopic Third Ventricu-lostomy . . . 22
1.4.2 Chapter 3: Visual Enhancement of MR Angiography Images to Facilitate Planning of Arteriovenous Malformation Interventions . 22 1.4.3 Chapter 4: Training for Planning Tumour Resection: Augmented Reality and Human Factors . . . 23
1.4.4 Chapter 5: A Complete Simulation Environment for Vertebro-plasty Procedure . . . 23
2 The Role of Stereopsis in Endoscopic-Third Ventriculostomy 30 2.1 Introduction . . . 30
2.1.1 Clinical Motivation: Endoscopic Third Ventriculostomy . . . 30
2.1.2 Hypothesis and Objectives . . . 33
2.1.3 Background . . . 34
Endoscopy in Neurosurgery . . . 34
Depth Perception in Neuroendoscopy . . . 34
Related Work . . . 39
Stereopsis and Psychophysics . . . 40
CONTENTS vii
2.2 Materials and Methods . . . 42
2.2.1 Phase1 . . . 43
Preliminary Study . . . 43
Comparison Experiment: Stereo vs. Mono . . . 44
2.2.2 Phase 2 . . . 47
2.3 Results and Discussion . . . 51
2.3.1 Phase1: Results . . . 51
Preliminary Study . . . 51
Comparison Experiment . . . 51
2.3.2 Phase1: Discussion . . . 52
2.3.3 Phase2: Results . . . 53
2.3.4 Phase2: Discussion . . . 54
2.3.5 General Discussion . . . 55
2.4 Conclusion . . . 56
2.5 Limitations and Future Work . . . 57
3 Visual Enhancement of MRA Images to Facilitate Planning of AVM Inter-ventions 65 3.1 Introduction . . . 65
3.1.1 Clinical Motivation: Arteriovenous Malformations . . . 65
3.1.2 Background . . . 68
Related Work . . . 68
Perceptual Factors . . . 70
3.1.3 Hypothesis and Objectives . . . 71
3.1.4 Contributions . . . 72
3.2 Materials and Methods . . . 73
3.2.1 Visualization of Vascular Structures . . . 73
CONTENTS viii
Cel-shading . . . 74
Gradient Shading . . . 75
3.3 Evaluation Studies . . . 75
3.3.1 Experiment Design . . . 75
Continuity: A Perceptual Study . . . 75
Depth: A Psychophysical Study . . . 78
3.4 Results and Discussion . . . 81
3.4.1 Continuity Experiment . . . 81
3.4.2 Depth Perception Experiment . . . 85
3.4.3 Qualitative Feedback . . . 86
3.5 Conclusion . . . 91
3.5.1 Limitations and Future Work . . . 92
4 Training for Planning Tumour Resection: Augmented Reality and Human Factors 98 4.1 Introduction . . . 99
4.1.1 Clinical Motivation . . . 99
4.1.2 Background . . . 100
4.1.3 Related Work . . . 101
4.1.4 Hypothesis, Rationale, and Objective . . . 104
Hypothesis . . . 104
Objective . . . 105
Rationale . . . 105
4.1.5 Contributions . . . 105
4.2 Materials and Methods . . . 106
4.2.1 Action and Perception in Planning Environments . . . 106
4.2.2 Mental Processes in Planning Environments . . . 106
CONTENTS ix
4.2.4 System Implementation . . . 109
4.2.5 Perceptual Cues and Considerations in AR . . . 113
Cel-shading . . . 114
Occlusion Handling . . . 114
Grid lines . . . 115
Keyhole . . . 115
Virtual reality . . . 116
4.2.6 Evaluation Studies . . . 117
Phase1&2 . . . 118
Phase3 . . . 121
4.3 Results and Discussions . . . 124
4.3.1 Phase1 . . . 124
4.3.2 Phase2 . . . 125
4.3.3 Phase3 . . . 125
4.4 Conclusion . . . 130
4.5 Limitations and Future Work . . . 130
5 A Complete Simulation Environment for Vertebroplasty Procedure 141 5.1 Introduction . . . 141
5.1.1 Clinical Motivation: Vertebroplasty . . . 141
5.1.2 Background . . . 142
Simulation in Surgical Training . . . 142
Non-Technical Surgical Skills . . . 143
5.1.3 Related Work . . . 144
Simulation in Health Care . . . 144
Vertebroplasty Simulator . . . 145
5.1.4 Rationale, Hypothesis, and Objectives . . . 145
CONTENTS x
5.2 Methods and Materials . . . 147
5.2.1 Simulator Components . . . 147
5.2.2 Methodology . . . 149
5.2.3 Equipment and Environment . . . 151
5.2.4 Analysis . . . 152
Objective Analysis . . . 152
Subjective Analysis . . . 152
5.3 Results and Discussion . . . 154
5.3.1 Results . . . 154
5.3.2 Discussion . . . 156
5.4 Conclusion . . . 159
5.5 Limitations and Future Work . . . 159
6 Closing Remarks 166 6.1 Future Direction . . . 169
A Derivation of Ip 171
B Subjective Analysis for Vertebroplasty Experiment 175
List of Figures
1.1 Cross-section of main retinal layers . . . 3
1.2 Due to the convexity of the eye lens, visual information on the right side
of the scene is projected on the left side of both eyes and vice verse. The
visual information is then transmitted through optic nerves, either
tem-porally or nasally. Optic nerves meet at the optic chiasm located at the
base of the hypothalamus, formingoptic tracts. These tracts terminate at
the LGN. . . 4
1.3 Dorsal-Ventral Streams: the dorsal stream runs forward from V1 into the
posterior parietal lobe through V3, MT, and MST. The ventral stream
stretches from V1 downward into the inferior temporal lobe through V4
and IT visual areas. . . 5
1.4 Detecting colour is a pre-attentive process; e.g., the red circle within the
sea of blue squares . . . 6
1.5 Information about the motion can be perceived by either following or
holding the eyes still in front of a moving object (inspired from [4]) . . 9
1.6 The sensitivity of depth cues as a function of viewing distance [11] . . . 10
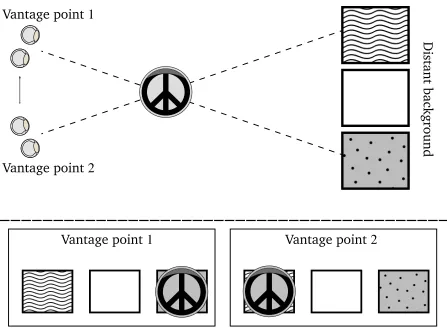
1.7 An example of motion Parallax . . . 11
1.8 X-junction translucency: The ambiguity of the scene is determined by the
order of luminance (Yellow lines correspond to the order of luminance
from the brightest to the darkest). [14] . . . 12
LIST OF FIGURES xii
1.9 An example of top-down processing: the same character can be
per-ceived either as letter ’B’ or number ’13’. This illustrates how our
expec-tations can change our perception. . . 14
1.10 A typical psychometric function . . . 15
1.11 Multi-component model of working memory proposed by [29] . . . 19
2.1 Anatomy of thrid ventricle: the basilar artery is located beneath the third ventricle, a few millimeters behind the clivus . . . 32
2.2 Left: An endoscopic view of the third ventricle during an ETV operation, right: lack of visible landmarks on the floor of the thrid ventricle when the tissue is thick and opaque . . . 32
2.3 Because of the high pressure of CSF inside the ventricles, the bump above the basilar artery is more pronounced in hydrocephalus patients (right) compared to the normal population (left) . . . 33
2.4 Left: Shadows cannot be seen in conventional endoscopy; right: In the images generated via shadow-forming endoscopes with a separate source of light, shadows are visible and can be used as a cue to perceive depth . . . 39
2.5 Vergence-accommodation mismatch in stereoendoscopy. In natural set-tings, these two cues are always in synchrony, providing correct sensa-tion of egocentric depth. . . 40
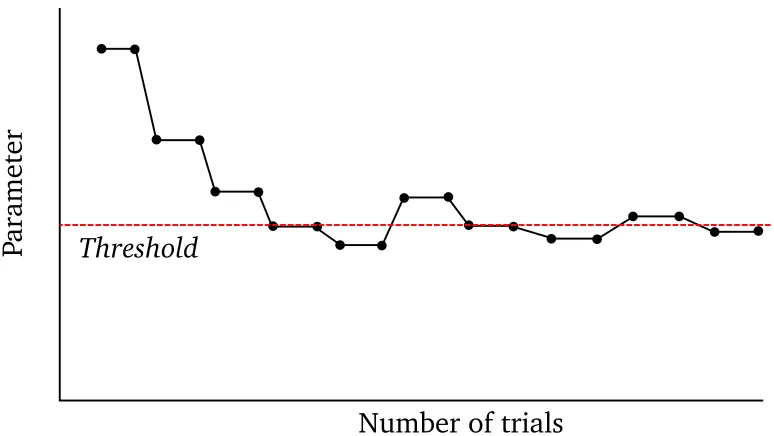
2.6 An example of a staircase paradigm . . . 42
2.7 Model of the third ventricle . . . 44
2.8 The environmental setup for the preliminary experiment . . . 45
LIST OF FIGURES xiii
2.10 The underlying structure of the VisionSense camera: The rays passing
through the two pupils emerge as parallel beams, reaching the left and
right pixels on the CCD chip that is covered by a lenticular array. IPD
corresponds to the distance between the two pupils. . . 46
2.11 The environmental setup for the comparison experiment with the use of
VisionSense camera . . . 47
2.12 bottom right: First set of phantoms, left: Second set of phantoms made
out of two-part silicon . . . 48
2.13 A random-dot pattern was mapped on the surface to eliminate the effect
of monocular cues . . . 50
2.14 A) Virtual endoscopic view, B) Cursor represents the tip of the monopolar
instrument . . . 50
2.15 Correct Response Rate vs Height Difference . . . 51
2.16 Correct Response Rate vs Height Difference . . . 53
2.17 Novices show a larger variance of their targeting distributions compared
to an expert . . . 54
3.1 AVM manifests itself as a tangled mass of blood vessels . . . 67
3.2 Conventional representation of MRA images on axial, sagittal, and
coro-nal planes . . . 68
3.3 Top: buffer edge enhancement is based on the discontinuities of the
Z-value, relative to the viewer; Bottom: Opaque objects can be visualized
if they are placed within translucent materials . . . 76
3.4 Different shading models: (a) no shading, (b) gradient-shading only, (c)
cel-shading only, and (d) gradient and cel-shading combined. . . 77
3.5 Circles indicate the vessel(s)-of-interest. In this example, edges are
LIST OF FIGURES xiv
3.6 An example of stimuli with stereopsis (interlaced) enabled and contours
enhanced. . . 81
3.7 Left: Schematic presentation of stimuli (observers point of view); Right: The relative depth between near and far vertical bars (side view) . . . . 82
3.8 The bars in the background were generated larger in size compared to those in the foreground to avoid reliance on relative size as a visual cue . 82 3.9 The subjects’ response time (sec) with and without contour enhancement 84 3.10 The subjects’ accuracy (%) with and without contour enhancement . . . 84
3.11 Mean accuracy (%) and mean RT (sec) (Refer to Table 3.2 for details) . . 87
3.12 To generate a 2D-TF (a) a gradient-intensity histogram is generated au-tomatically (top-left); (b, c) Different regions on the gradient-intensity histogram correspond to different tissue types (e.g., skin, vessels); (d) Users are equipped with tools to subjectively specify the region-of-interest on the histogram and set the colour/opacity accordingly. . . 89
3.13 An AVM dataset before (left) and after (right) applying gradient shading and contour enhancement, augmenting the context of the volumetric visualization. . . 90
4.1 Planning environments: a) 2D views of axial/coronal/sagittal slices, b) crossed-plane (XP) representation of 2D slices, c) 3D volume rendering, d) Overlay of virtual images on the real video in an augmented-reality (AR) environment . . . 102
4.2 the reality-virtuality continuum proposed by Milgram et al. [9] . . . 103
4.3 The perception-cognition-interaction cycle [37] . . . 107
4.4 Underlying mental processes in planning environment . . . 108
LIST OF FIGURES xv
4.6 The AR system consists of a pair of AR goggles, a head phantom, a stylus,
and an optical tracker. The transformation matrices of T1, T2, and T3
are given using the optical tracker whileT4 is computed using camera
calibration . . . 111
4.7 An example of hue-based occlusion handling . . . 115
4.8 An example of use of a keyhole with grid lines to promote the sensation
of depth . . . 116
4.9 Visualizing grid lines behind the tumour evokes a strong sense of motion
parallax while interacting with the phantom . . . 116
4.10 An example of the virtual reality mode to visualize DTI tracts, functional
areas, and virtual stylus . . . 117
4.11 Rotational (left) and translational error (right) were used as metrics to
measure users’ performance . . . 121
4.12 Visualization of patient-specific data in a) 2D, b) XP, c) 3D, and d) AR/VR
(left and right images correspond to left and right views of the AR
cam-eras/displays) environments in phase3 . . . 123
4.13 Overall rotational and translational errors observed in phase1(top) and
phase2(bottom). . . 126
4.14 Top: Translational (left)and rotational error (right);Middle: Time for SD
(left)and LA (right);Bottom: Ip for SD (left) and LA (right) . . . 127
5.1 X-ray images of the trocar and spine anatomy . . . 146
5.2 The simulation environment for the vertebroplasty procedures . . . 148
5.3 The trocar is attached to a haptic end-effector before being inserted
LIST OF FIGURES xvi
5.4 top-bottom: The vertebroplasty simulation environment consisting of
mannequin, VR simulator, mobile C-arm fluoroscope, real medical
in-strument and a broad spectrum of human sensory channels such as
tac-tile, auditory and visual in real-time. middle: Independent control room
varying mannequin physiology and initialize crisis scenarios. . . 150
5.5 Patient’s physiologic parameters could be manipulated through an
inter-face located in the control room . . . 152
5.6 The position of the trocar throughout the procedure . . . 153
5.7 Example viewpoints of two surgeon trocar insertions versus ground truth
List of Tables
2.1 List of depth cues and their role in endoscopy . . . 36
2.2 Average correct response rate (%) with respect to height difference (mm) 52
2.3 Targeting performance (%) of novices/expert with the help of
stereo-scopic view . . . 54
3.1 12 different conditions of different degrees of stereoscopic disparity and
cel-shaded darkness . . . 83
3.2 Overall level of performance (RT and Accuracy) (µ±std) . . . 86 3.3 Paired t-test comparison between subjects performance and RT under
the possible combinations of contour enhancement . . . 88
3.4 Paired t-test comparison between subject performance and RT under the
possible combinations of stereopsis . . . 88
4.1 Middle row: CT images of the phantom with a synthetic ellipsoid (LA),
a sphere (SD), or a sphere and a tube (AV) were generated to be used
as stimuli in phase 1; bottom row: The true longest axis of the
ellip-soid (LA), shortest distance from the sphere to the skull (SD), and
maxi-mal Hausdorff distance from the sphere to the tube (AV) were shown in
phase2(images are only a few examples from the 2D environment) . . . 119
4.2 Average rotational and translational error (phase3) . . . 128
5.1 Performance Analysis . . . 154
List of Appendices
Appendix A: Derivation of Index of Performance . . . 171
Appendix B: Subjective Analysis for Vertebroplasty Experiment . . . 175
List of Abbreviations
2AFC: 2-Alternative Forced Choice
AR: Augmented-Reality
AVM: Arteriovenous Malformations
AV: Augmented-Virtuality
CL: Cognitive Load
CSF: Cerebrospinal Fluid
CTA: Computed Tomography Angiography
CT: Computed Tomography
DVR: Direct Volume Rendering
DTI: Diffusion Tensor Imaging
ETV: Endoscopic Third Ventriculostomy
fMRI: function Magnetic Resonance Imaging
HCI: Human-Computer Interaction
HMD: Head-Mounted Display
IGI: Image-Guided Intervention
JND: Just Noticeable Difference
MIP: Maximum-Intensity Projection
MIS: Minimally-Invasive Surgery
MPR: Multi-Planner Reformatted
MR: Mixed-Reality
MRA: Magnetic Resonance Angiography
MRI: Magnetic Resonance Imaging
NPR: Non-Photo-Realistic
OR: Operation Room
PMMA: Polymethylmethacrylate
RT: Response Time
TF: Transfer Function
VR: Virtual-Reality
VS: Visuospatial Sketchpad
VE: Virtual Environments
XP: Crossed Plane
Chapter 1
Introduction
“The world, as we perceive it, is our own invention.” - Heinz von Foerster
In minimally-invasive interventions, the target anatomy is often accessed by means
of tools placed through small incisions in the body. Patients who undergo
minimally-invasive interventions often have fewer complications, shorter hospital stays, quicker
recovery times, and less pain than traditional open procedures. However, these
bene-fits come at the cost of limited view of the surgical site and restricted access inside the
body cavity. To overcome these issues, over the past several decades significant efforts
have been dedicated to the developments in medical imaging, tracking and localization
technologies, surgical navigation and simulation, image segmentation, modeling, and
registration [1]. In the meantime, methods of visualization and interaction have
un-dergone dramatic changes to permit rapid and accurate examination of medical images
with minimal mental and physical effort. These advancements are made possible partly
by improvements in the display technology, and partly by studying the role of human
perception, cognition, and action in perceiving, processing, and interacting with
medi-cal images. In fact, researchers collectively agree that even the most technimedi-cally optimal
visualization and interaction environments would not optimally convey information if
the information they deliver surpasses the users’ perceptual and cognitive capabilities
CHAPTER1. INTRODUCTION 2
[2].
In the realm of minimally-invasive interventions, visual perception is the capacity
to transform preoperative and intraoperative images into a form that can be used by
the cognitive system, along with domain knowledge, to formulate plans of action,
ac-complishing surgical tasks. This continual cycle of visual perception-cognition-action
influences every aspect of minimally-invasive interventions, from training and
preop-erative planning to intraoppreop-erative navigation. This introductory chapter reviews some
important aspects of the human visual system and its underlying mechanisms.
1.1
Visual Perception
Perception is the process by which we organize, recognize, and interpret sensory
infor-mation to understand our surrounding environment. It begins when a distal stimulus
emits or reflects energy stimulating a sensory organ. The energy falling on the receptors
of the sensory organ, commonly referred to as proximal stimulus, generates neural
ac-tivity which subsequently is transmitted to the brain. The process of creating a mental
representation of the distal stimulus using the information contained in the proximal
stimulus is described as perception. If the sensory neurons are activated by means of
light, the process of constructing a mental image of the distal object is described as
vi-sual perception- or what we think of asseeing. This section is an introduction to visual
perception and its underlying physiological and behavioural mechanisms.
1.1.1
Visual System
Perceiving a visual scene begins with reception of light by photoreceptor cells located
in the layer of the retina, commonly known as rods and cones (Figure 1.1). The
pho-toreceptor cells are connected toganglioncells in which a biological conversion of the
CHAPTER1. INTRODUCTION 3
to the lateral geniculate nucleus (LGN), a six-layered structure in the thalamus
(Fig-ure 1.2). The LGN consists of two major types of cells: Parvoand Magno. These cells
behave differently in response to four major properties in an image, namely,colour,
mo-tion, spatial resolution, and contrast sensitivity[3]. Magno cells are effectively
colour-blind, have a high contrast-sensitivity, and exhibit a fast response to temporal aspects
of a visual stimulus. Furthermore, their receptive fields are 2 to 3 times larger than
Parvo cells, making them less sensitive to high spatial frequencies. Parvo cells behave
in exactly the opposite manner. These characteristics of Magno and Parvo cells are
perpetuated in the primary visual cortex in the occipital lobe - or V1, contributing to
different aspects of vision. Neurons contained in V1 are tuned to simple properties of
the visual scene including colour, form, and movement. V1 projects mainly to V2 in
which more complex properties such ashorizontal disparityis detected [3].
Direction of light
Ganglion cell Optic
nerve fiber
Rod cell Cone cell
Figure 1.1: Cross-section of main retinal layers
As visual information exits V1 and V2, it travels via two separate pathways: the
dorsal stream, commonly known as wherepathway orhowpathway, that runs forward
from V1 into the posterior parietal lobe through V3, MT (also known as V5), and MST
brain areas; and theventral stream, orwhatpathway, that stretches from V1 downward
into the inferior temporal lobe through V4 and IT visual areas (Figure 1.3). The dorsal
CHAPTER1. INTRODUCTION 4
Optic nerve
Optic chiasma
Optic tract
LGN
Cortex of occipital lobes
Figure 1.2: Due to the convexity of the eye lens, visual information on the right side of the scene is projected on the left side of both eyes and vice verse. The visual information is then transmitted through optic nerves, either temporally or nasally.
Optic nerves meet at the optic chiasmlocated at the base of the hypothalamus, formingoptic tracts. These tracts terminate at the LGN.
and object recognition are, in contrast, mediated largely by the ventral stream [4]. For
example, identifying a cup as an object of interest (what) is accomplished through the
ventral stream, whereas information about locating the cup (where), reaching for it,
and grasping it (how) is provided by the dorsal stream. Furthermore, the dorsal stream
uses an egocentric frame of reference computing the object properties relative to the
observer while the ventral stream employs a scene-based frame of reference providing a
detailed representation of the visual world. Our visual perception is dependent on both
dorsal and ventral streams as shown in both behavioural [5] and biological studies [4].
Even though these streams are different pathways with different functionality, there is
CHAPTER1. INTRODUCTION 5
perceptual and physiological levels [4] [5].
Dorsal stream
Ventral stream
V1
V2 V3
MT/MST
V4
IT LGN
Figure 1.3: Dorsal-Ventral Streams: the dorsal stream runs forward from V1 into the posterior parietal lobe through V3, MT, and MST. The ventral stream stretches from
V1 downward into the inferior temporal lobe through V4 and IT visual areas.
1.1.2
Visual Cues
The complexity of processing a visual scene increases as the information travels from
the retina to the brain. Early stages of visual perception involves unconscious, rapid
(200 msec - 250 msec [6]) accumulation of information about the visual scene
pro-vided by pre-attentive features. These features are often classified into four categories
of colour, form, movement, and spatial localization1 [7]. It is believed that the brain process these cues at the very low-level visual areas to have an initial estimate of the
environment’s properties and then combine them based on their statistical reliability.
CHAPTER1. INTRODUCTION 6
Colour
Processing colours begins immediately after receiving light by a specialized type of
retinal neurons called cone photoreceptors. There are three types of cone cells, each
sensitive to a particular wavelength of light2. The light’s wavelength and energy carry information about the hue (chromatic) and the luminance (achromatic) characteristics
respectively. Colour perception is a result of processing both achromatic and chromatic
signals. Our visual system is extremely sensitive to both hue and luminance3. For instance, identifying the red circle among the sea of blue ones (as shown in Figure
1.4) is a rapid, effortless process [6]. In this example, our brain unconsciously groups
stimuli together if they share a similar hue (blue) and differentiate them if they don’t
(red vs. blue) [8]. Luminance also can serve as a visual cue to make a stimulus
distinguishable. Areas with high contrast4not only attract the visual attention [9], but also play a key role in edge detection.
Figure 1.4: Detecting colour is a pre-attentive process; e.g., the red circle within the sea of blue squares
Form
If one picks up a pen and looks at it from different viewing angles, the perception of
the pen’s physical shape (i.e. distal stimulus) does not change. Meanwhile, the pattern
2S-cells for short-wavelength (blue), M-cells for medium-wavelength (green), and L-cells for long-wavelength (red) light
CHAPTER1. INTRODUCTION 7
of energy creating retinal images (i.e. proximal stimulus) is changing and so activating
different sets of receptors. Despite the difference between the distal and the proximal
stimuli, our perception of the pen remains constant; the pen is perceived as having the
same shape regardless of the viewing angle, illumination, and its location in the visual
field. Thisperceptual constancyinobject recognitionallows us to recognize and identify
certain objects despite time-varying changes in the received signal. Object recognition
involves a hierarchy of processes that begins with low-level recognition of forms, that
is dots, lines, contours, and shapes. Recognition of contours, in particular, helps us
to recognize shape, orientation, and relative depth, especially when other visual cues
are lacking. This information is then integrated with other information collected from
motion, colour, and depth providing information on the overall form. The result is
then matched with structural descriptions in memory. Top-down processes such as
familiarity and recollection may also provide information about the object of interest
and its surrounding environment. Similar to colour perception, the ventral stream
appears to be responsible for analysis of form and object recognition.
Perhaps one of the most notable theories in object recognition is David Marr’s theory
of vision [10]. According to his theory, object recognition involves three major stages
ofprimal sketch,21/
2D sketch, and3D model. In primal sketch, low-level visual features
such as edges, contours, and regions are extracted to explain local 2D geometries in
an image. The physical information about material properties (e.g., colour, texture,
shininess) and egocentric properties of visible surfaces (e.g., depth, orientation) are
collected during the 21/
2D sketch via illuminant, surface reflectance, surface shape,
and the vantage point of observer. Information collected in the first two stages might
suffice for proper perception. In some case, however, the spatial locations of objects
are processed and related to their surrounding environment for 3D representation and
CHAPTER1. INTRODUCTION 8
Motion
Motionis perceived when the light emitted from a moving object transverses the retina
and fires neurons in a sequential pattern [4] (Figure 1.5-Left). Pursuing movement
of a moving object also causes the perception of motion. In this case, the same part
of retina is stimulated and so the information about the moving object comes from
the movement of the eyes/head (Figure 1.5-Right) [4]. There is an exception to this
phenomenon, however: In beta- and phi phenomena, the apparent motion is caused
not by changes in the retinal images or movement of the head/eyes but because of
rapid sequential changes in the static image giving an illusion of motion5. In the beta phenomenon, changes of static images occur with a speed faster than that which
hu-man eyes can resolve, causing the illusion of motion (despite the fact that there is no
movement per se). In the phi phenomenon, changes in luminance of a stationary
im-age causes the sensation of movement. In both cases, the visual system detects rapid
changes in luminance at a certain point on the retina and correlates that with the
lu-minance of its neighbours. In humans, motion perception, and the integration of local
motions into a global percepts, largely take place in MT (V5) as part of the dorsal
stream.
Depth cues
Depth perception involves consolidation of different monocular and binocular cues to
form a three-dimensional image of the world from the two-dimensional images
pro-jected on our retina. Binocular cues, such asstereopsisprovide information about depth
when a scene is observed with both eyes. Stereopsisis the process of perceiving depth
from two slightly different images of the world projected on the left and right
reti-nas. The horizontal difference between these two retinal images, known as binocular
disparity, is used by disparity-tuned cells in several cortical visual areas (such as V2
CHAPTER1. INTRODUCTION 9
Image movement Eye movement
Figure 1.5: Information about the motion can be perceived by either following or holding the eyes still in front of a moving object (inspired from [4])
and V3) to compute depth. Stereoacuity is the acuteness of stereopsis representing
the sensitivity to small disparity differences. Luminance, spatial frequency, observation
time, and contours can influence stereacuity. For instance, at a low luminance level,
stereoscopic acuity declines dramatically while increases in spatial frequency or
fixa-tion time improves it. Stereopsis is the most important binocular cue for interpreting
short distances (Figure 1.6). Stereopsis is discussed in more detail in chapter 2.
Vergence is another binocular cue providing depth information for distances less
than 10 meters (Figure 1.6). When one begins to fixate on a near object, this inward
movement of the eyes (convergence) stretches the extraocular muscles, which in turn,
sends signals to the visual cortex to be used for interpreting depth. A similar process
occurs when the eyes rotate outwards to focus on more distant objects (divergence).
Unlike binocular cues, monocular cues can be detected with one eye only to perceive
depth. One of the most effective monocular cues is motion parallax, defined as the
discrepancy in perceived speed as a result of differences in distance, i.e. when objects
move at the same objective speed relative to the observer, closer objects traverse the
CHAPTER1. INTRODUCTION 10
1
10
100
1000
Viewing distance
D
[m]
1
10
100
1000
Depth
sensitivity
D ∆D
>
0
texture
brightness
size
aerial prespective
stereopsis
motion parallax
vergence
accommodation
Figure 1.6: The sensitivity of depth cues as a function of viewing distance [11]
their direction of movement may provide sufficient information to perceive the
rela-tive distance between them (Figure 1.7). Interestingly, perception of depth in animals
which lack developed binocular vision, is heavily dependent on motion parallax [12].
Motion parallax works best for short distances. Another effective cue, occlusion,
hap-pens when an object is partially occluded by another object within the same visual
direction. Other monocular cues such as relative size, familiar size, perspective, aerial
perspective, depth from motion, accommodation, texture gradient, and distribution of
shadows and illumination can also provide egocentric and relative depth information.
CHAPTER1. INTRODUCTION 11
Vantage point
1
Vantage point
2
Vantage point
1
Vantage point
2
Distant
background
Figure 1.7: An example of motion Parallax
Translucency
Although translucency is not a visual cue, it is an important aspect of medical image
visualization. Translucency allows for simultaneous visualization of multiple objects
that would be impossible otherwise. Studies have shown that spatial reasoning
(sec-tion 1.2.3) can be improved by concurrently presenting objects, as opposed to visually
recalling the location of one with respect to another [13]. Additionally, translucency
al-lows more information to be communicated in a shorter time, which in turn increases
the efficiency of information transfer. The perception of translucency can be evoked
by different factors such as refraction and world knowledge. However, x-junctionsare
perhaps the most important cues, influencing the perception of translucency. In
CHAPTER1. INTRODUCTION 12
along the contours of overlapping objects. As illustrated in Figure 1.8, in computer
graphics, x-junctions with different patterns of luminance may provide ambiguous,
un-ambiguous, and inconsistent information about the depth of overlapping objects [14].
Ambiguous depth order
unambiguous depth order Inconsistent depth order
Figure 1.8: X-junction translucency: The ambiguity of the scene is determined by the order of luminance (Yellow lines correspond to the order of luminance from the
brightest to the darkest). [14]
1.1.3
Bottom-Up & Top-Down Processes
Visual perception is a dynamic interaction betweenbottom-upand top-downprocesses
working together and simultaneously, with feedforward and feedback interactions
be-tween all layers of our visual system. The bottom-up process is driven by sensory
information from the physical world. The top-down process is driven by our
knowl-edge, beliefs, expectations, and intentions. Both bottom-up and top-down processing
streams interact at every level of visual perception to produce the best interpretation
of the surrounding environment [15].
Bottom-up processing
The previous section discussed visual cues which are largely derived from bottom-up
uncon-CHAPTER1. INTRODUCTION 13
sciously, and in parallel, with no interference of our goal-driven, endogenous
atten-tion. The task of the bottom-up processing is to detect and locate pre-attentive features
within the entire visual field, providing information about the scene for the subsequent
processes.
Top-down processing
As bottom-up information flows in from our sensory inputs, top-down information
affects earlier processes in accordance with our prior knowledge and expectations.
The top-down processing uses the information stored in memory to complement the
bottom-up process making the perception more accurate and relevant. Figure 1.9
illus-trates how top-down processes can influence our perception: despite the ambiguity of
the middle character, one is able to perceive the same object differently given through
their prior knowledge of the English language. According to the classical theories,
perception is a processing hierarchy in which top-down is associated with feedback
connections while bottom-up denotes feedforward information flow. From this point
of view, features are first combined into an object and then the object is matched to
some representations in memory. Recent studies in neuroscience, however, shows that
top-down processing is sometimes activated earlier than some lower-level bottom-up
processes to promote efficient recognition. In these cases, the initial guess about an
object or a scene is highly influenced by contextual associations between the stimulus
and the scene [16]. In this approach, the number of object representations that must
be considered is significantly reduced by the top-down processes. From an
evolution-ary standpoint, “such a rapid mechanism provides critical information when a quick
CHAPTER1. INTRODUCTION 14
Figure 1.9: An example of top-down processing: the same character can be perceived either as letter ’B’ or number ’13’. This illustrates how our expectations can change our
perception.
1.1.4
Measurement of Visual Perception: Psychophysics
“What’s the relationship between perceived depth and the neural activity in the primary
visual cortex?” To answer this question, it is not sufficient to study the behaviour of the
brain’s individual components (neural responses) but it is also necessary to interpret
its overall behavioral activity (perceived depth) and correlate one to the other.
Under-standing the brain’s behaviour, however, could be a daunting task because perception
is an experience with temporal variations. This variation is due to the inherently
prob-abilistic nature of sensory estimation, and that our senses are tuned to respond to a
certain bandwidth of external stimuli. For example, if one estimates the depth of an
object in a visual scene multiple times, the response often follows a Gaussian form
probability density distribution with non-negligible variance [18]. To quantify this
be-haviour, psychometric functions (PFs) are acquired through conducting psychophysical
experiments. PFs relate a perceptual property of a stimulus, often measured indirectly,
with a corresponding physical property. In other words, PFs model the probability of
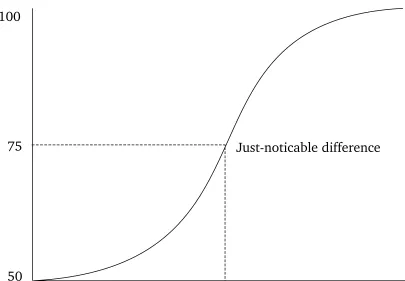
brain’s response to a certain property of the environment. In the simplest form, PFs are
sigmoid-shape (Figure 1.10) with the y-axis representing the rate of performance (e.g.
number of correct responses) and the x-axis representing the intensity of the stimulus
(e.g. depth of an object). We can think of PFs as cumulative distributions of one’s
CHAPTER1. INTRODUCTION 15
50
100
75
P
ercentage
of
correct
responses
Stimulus intensity Difference
Just-noticable difference
Figure 1.10: A typical psychometric function
Traditionally, psychophysical paradigms are carried out in laboratory conditions in
which subjects are presented with a series of stimuli and asked to perform a certain
task. Inmagnitude estimation experiments, for instance, subjects are required to
sub-jectively rate the intensity of the presented stimuli on a given scale. Matching
exper-iments involve matching the intensity of two stimuli by adjusting the intensity of one
with respect to another. In discrimination experiments, subjects are asked to detect
or discriminate small differences in the stimuli intensity. The design of discrimination
experiments often follow one the following paradigms: yes-no, two-alternative
forced-choice (2AFC), or n-alternative forced-choice (nAFC). Yes-no paradigms are often used
to measure the absolute threshold, that is the level of intensity of a stimulus at which
subjects are able to detect. In these experiments subjects are asked to confirm (yes)
or refute (no) the existence of a stimulus at each trial. 2AFC (or nAFC) paradigms are
CHAPTER1. INTRODUCTION 16
JND), that is the smallest detectable difference between two (ornin case of nAFC)
lev-els of a particular sensory stimulus (Figure 1.10). In 2AFC, two options are presented
in every trial in a random order. One item of the pair is a lure, and the other one is a
target. The observer’s task is to report the observation that contains the target. Unlike
yes-no paradigms, where subjects must report the presence or absence of a stimulus,
forced-choice experiments are shown to be independent of the observers’ subjective
report of their personal perception6.
1.1.5
Sensitivity Index
In yes-no paradigms the level of difficulty in detecting the target from background
events can be measured as the proportion of targets which are correctly identified
as such (i.e. (hits) / (hits+miss)), that is the sensitivity of the system. Sensitivity
is therefore the degree of separation between targets and background events, or as
described in the signal detection theory, betweensignal and noise. According to signal
detection theory, the sensitivity index - commonly referred to as d0 - is a measure of
correlation between the level of task difficulty and the distance between signal and
noise distributions. In yes-no experiments,d0 is defined as d0 = (Zhitrate −ZFArate), where
ZP(p ∈ [0 1])is the inverse of the cumulative distribution function. Similarly, in 2AFC
experiments,d0provides a standard measure of performance as: d0 =(Zcorrect−Zincorrect)×
(
√
2)−1. Naturally, higherd0values denote improved perceptual performance in locating
the signal among noise. For more information, refer to [20, 21].
1.2
Cognition
Cognitionrefers to the conscious or unconscious mental processes that are involved in
reasoning, problem solving, decision making, attention, memory, and perception (e.g.,
CHAPTER1. INTRODUCTION 17
top-down processing mentioned in section 1.1.3). The effect of cognition in
visualiza-tion research is rather profound. Cognitive processes not only derive the
comprehen-sion of visual information but also defines how to interact within environments.
1.2.1
Visual Attention
At any given moment, effectively processing the entire information contained in a
nat-ural scene is far beyond the brain’s capacity. To cope with this potential information
overload, the brain is equipped withvisual attention, that is the cognitive mechanism of
selecting behaviourally relevant information from the environment (and/or inhibiting
irrelevant or interfering information) over space and over time [22]. This process may
involve actively searching and processing visual information to locate the target. The
efficiency and efficacy of suchvisual search can be increased by increasing the
homo-geneity of surrounding distractors [23], increasing the visual difference between the
target and distractors (in features such as shape, size, orientation, motion, stereopsis,
color, and lighting) [24], practice [25], and reducing the number of distractors.
1.2.2
Cognitive Load
Encoding, storing, and retrieving information is a complex cognitive process resulting
from interaction between long term memory, short term memory, and working
mem-ory. Working memoryis our conscious organizer and processor that passes information
in small, incremental steps to long term memory, preventing random, rapid changes.
Meanwhile, short term memory temporarily stores information to be later processed
and organized by working memory [26]. Our working memory is limited in both
con-tent and recon-tention capacities, particularly when dealing with novel information, and
can be overloaded by too much information and/or too long of a retention. This
effec-CHAPTER1. INTRODUCTION 18
tiveness of information transfer [27]. There are three different kinds of cognitive load:
intrinsic, extraneous, and germane. The intrinsic (or necessary) load is related to the
difficulty of the content itself. The extraneous (or irrelevant) load is associated with
unnecessary information such as distractions, and therefore should be reduced or
elim-inated. Germane (or relevant) load relates to the cognitive loaddevoted to processing
new information into more advanced and complex structures known as schema.
Inter-pretation of data, for a specific task at a specific level of expertise, poses an intrinsic
load that cannot be changed. To facilitate the process of information transfer
how-ever, the intrinsic cognitive load needs to be efficiently managed without exceeding
working memory limitation. This can be accomplished by providing adequate relevant
prior knowledge while avoiding split-attention, redundant source of information,
dis-appearance of information before being processed (transiency). As a rule of thumb,
decreasing the extraneous load is necessary to improve the information transfer. It
is important to note that reduction of cognitive load by lowering the difficulty of the
problem is not always beneficial [28]. In the realm of training, for instance, mismatch
between the level of expertise and problem difficulty can have negative effects on the
quality of learning. This is even true when the inherent difficulty of the problem, the
intrinsic load, is too low for trainees. Therefore, alignment of task difficulty and level
of expertise is as important as lowering the extraneous load to enhance the learning
process.
1.2.3
Visuospatial Reasoning
In 1974, Baddeley and Hitch proposed a model to describe how working memory
func-tions [29]. Their multi-component model is composed of a central executive and its
three slave systems, namely,visuospatial sketchpad(VS),phonological loop, andepisodic
buffer (Figure 1.11). The phonological loop stores verbal information, the VS deals
in-CHAPTER1. INTRODUCTION 19
formation across domains of visual, spatial, and phonological information [30]. The
underlying cognitive processes, including attention, are supervised by the central
ex-ecutive system. Logie [31] has proposed that the VS can be further subdivided into
a visual cache, which stores visual information about form and colour, and an inner
scribe, which is a rehearsal mechanism for visual information and is responsible for
spatial and movement information. The VS provides a temporary environment for
vi-suospatial reasoning, that is our ability to perceive, visualize, simulate, manipulate,
enact, and recall visual and spatial representations [32]; but perhaps the most
im-portant aspect of visuospatial reasoning is themental rotation [33] and translation of
visuospatial images. These transformations occur relative to three different classes of
reference frames: object-based (relative to the object itslef), egocentric-based (relative
to the self), and environmental (relative to fixed features of the environment) [34].
Egocentric-based transformations are either relative to the observer’s perspective or to
the end effectors (e.g. hands) [34]. While environmental transformations rarely
oc-cur, the object-based and egocentric-based transformations can be physically performed
and/orimagined.
Phonological Loop
Central Executive
Visuospatial Sketchpad
Episodic Buffer
CHAPTER1. INTRODUCTION 20
1.2.4
Measurement of Cognition
Measuring the cognitive load can be performed through performance-based and
phys-iological measures, as well as subjective ratings [28]. Performance-based techniques
often involve dual task experiments in which subjects’ performance (i.e. time,
accu-racy) is measured with respect to a secondary stimulus while focusing on a primary
task. Under this condition, the larger the cognitive load imposed by the primary task,
the longer the reaction time and/or the lower the accuracy. Physiological measures
involve measuring subjects’ physiological changes such as heart rate and pupil size
un-der the presence of cognitive load. These methods often suffer from low ecological
validity - the degree to which the result of the study reflects the natural settings [28].
In subjective ratings method, individuals report their subjective experience of mental
effort. Despite the body of evidence supporting the sensitivity of subjective ratings,
one’s subjective experience of difficulty may change significantly depending on his/her
motivational and emotional condition [28]. Among available techniques for subjective
workload measurement, the NASA task load index - NASA-TLX - is thought to be one of
the most validated tools in this domain [35]. NASA-TLX is a post-hoc subjective
multi-dimensional assessment tool developed by NASA after40laboratory simulations over a
three year development cycle. This method involves two parts: first, subjects rate their
experience of mental demand, physical demand, temporal demand, performance, effort,
and frustrationduring the experiment. In the second part, subjects perform a pairwise
comparison between these factors, selecting the one more relevant to the workload.
The result of such comparison is then used to weight the initial ratings. The
over-all task load index is the average of weighted workload measures. NASA-TLX can be
CHAPTER1. INTRODUCTION 21
1.3
Visuomotor Processing
Visuomotor skillsrefers to the coordination of muscular movements and vision to
per-form acts involving perception and action. In surgery,eye-hand coordinationis a critical
aspect of visuomotor processing in which visual information along with
propriocep-tion provide input to guide hand movements. Visuomotor skills - at the lowest level of
action - are eitherposition-based, that is a sequence of changes in position and
orienta-tion, orselection-based, that is making contact with, or grasping, an object. To perform
these low-level motions, the cognitive system first decomposes the overarching goal
into a sequence of tasks, which can be further subdivided into a number of sub-tasks.
It is at the lowest level, that performance can be measured through behavioural
stud-ies. This is often accomplished in terms of the speed and accuracy. In this framework
for performance, there is always a trade-off between speed and accuracy as some tasks
favour speed over accuracy and some others favour accuracy over speed. Therefore,
any methodology measuring a sub-task performance must always address both the
speed and accuracy while combining the two in a way that respects the trade-off7.
1.4
Layout of Dissertation
This thesis addresses psychophysical and psychological implications of visualization,
interaction, and simulation in four different image-guided procedures with the goal of
improving the quality of patient care. Chronologically speaking, the empirical findings
offered in each chapter rationalize the approach taken in the following chapter.
CHAPTER1. INTRODUCTION 22
1.4.1
Chapter 2: The Role of Stereopsis in Endoscopic Third
Ven-triculostomy
Endoscopic third ventriculostomy (ETV) is a minimally-invasive surgery to treat
ob-structive hydrocephalus by perforating the floor of the third ventricle. Although ETV
is safer than the alternative (i.e. shunt placement), the risk of morbidity due to injury
to the basilar artery increases as the floor of the third ventricle thickens and becomes
opaque. In hydrocephalus patients, as the pressure from the cerebrospinal fluid
in-creases, the ventricle expands and the floor deforms, warping around the underlying
structures. Surface curvature could therefore be used as a landmark to locate and
avoid the artery. Conventional endoscopes, however, provide an impoverished view
of the surgical scene, impeding the detection of these structures. In Chapter 2, we
establish a methodology to determine whether stereoendoscopy - as opposed to the
conventional monocular approaches- can improve the perception of these structures,
lowering the risk of ETV interventions.
1.4.2
Chapter 3: Visual Enhancement of MR Angiography Images
to Facilitate Planning of Arteriovenous Malformation
Inter-ventions
Arteriovenous malformations (AVMs) are vascular lesions in which blood flows directly
from the arterial to the venous system bypassing the normally interposed capillary bed.
Treatment may involve surgical resection in which a surgeon examines preoperative
images in order to gain a full understanding of the lesion’s anatomy, its location, and
its spatial relation with surrounding structures. Accordingly, in Chapter 3, I investigate
the usability of a non-photorealistic contour enhancement technique, volume
render-ing, and stereopsis to improve upon identification and localization of vascular
CHAPTER1. INTRODUCTION 23
of Chapter 2 on stereopsis is further extended in this chapter.
1.4.3
Chapter 4: Training for Planning Tumour Resection:
Aug-mented Reality and Human Factors
Planning surgical interventions is a complex task, demanding a high degree of
percep-tual, cognitive, and sensorimotor skills to reduce intra- and postoperative
complica-tions. This process requires spatial reasoning to coordinate between the preoperatively
acquired medical images and patient reference frames. In the case of neurosurgical
in-terventions, traditional approaches to planning tend to focus on providing a means for
visualizing medical images, but rarely support transformation between different spatial
reference frames. Thus, surgeons often rely on their previous experience and intuition
as their sole guide to perform mental transformation. In the case of junior residents,
this may lead to longer operation times and increased chance of error under additional
cognitive demands. In Chapter 4, I introduce a mixed augmented/virtual reality system
to facilitate training for planning a common neurosurgical procedure, brain tumour
re-section. The proposed system is designed based on our previous findings on the effect
of stereopsis and occlusion on surgical performance and evaluated with human factors
explicitly in mind, alleviating the difficulty of mental transformation.
1.4.4
Chapter 5: A Complete Simulation Environment for
Verte-broplasty Procedure
In addition to visual perception and its implications for image-guided interventions, the
effect of cognition in surgical training is rather profound. Chapter 5 presents a unique
simulation approach to vertebroplasty procedures, evaluating both surgeons’ technical
and non-technical cognitive skills during their immersion in a complete medical
CHAPTER1. INTRODUCTION 24
is injected into a fractured vertebra in order to restore its stability. Two crisis scenarios
are included for the evaluation of the effect of interruption on the low-level surgical
skills. Validation and evaluation of our work is conducted together with19junior
sur-geons in order to provide a qualitative measure of usability, assess vertebroplasty
tech-nical performance of the surgeon, and associate between mental workload and surgical
performance during crises. Training these mixed-mode scenarios can thereby be
evalu-ated on our platform, allowing for improved assessment and a stronger foundation for
credentialing, with the potential to reduce the occurrence of adverse events in the OR8.
Closing remarks as well as future directions are discussed in Chapter 6.
Bibliography
[1] Kevin Cleary and Terry M Peters. Image-guided interventions: technology review
and clinical applications. Annual review of biomedical engineering, 12:119–142,
2010.
[2] T. Peters and K. Cleary. Image-Guided Interventions: Technology and Applications.
SpringerLink Engineering. Springer, 2008.
[3] Margaret Livingstone and David Hubel. Segregation of form, color, movement,
and depth: anatomy, physiology, and perception. Science, 240(4853):740–749,
1988.
[4] Robert H Wurtz and Erik R Kandel. Perception of motion, depth and form.
Prin-ciples of neural science, pages 548–571, 2000.
[5] Melvyn A Goodale and A David Milner. Separate visual pathways for perception
and action. Trends in neurosciences, 15(1):20–25, 1992.
[6] Christopher G Healey. Perceptual techniques for scientific visualization. In
SIG-GRAPH99 Course. Citeseer, 1999.
[7] Colin Ware. Information visualization: perception for design. Elsevier, 2012.
[8] Maureen Stone. Choosing colors for data visualization. 2006.
[9] Pamela Reinagel and Anthony M Zador. Natural scene statistics at the centre of
gaze. Network: Computation in Neural Systems, 10(4):341–350, 1999.
BIBLIOGRAPHY 26
[10] David Marr, S Lal, and HB Barlow. Visual information processing: The structure
and creation of visual representations [and discussion].Philosophical Transactions
of the Royal Society of London. B, Biological Sciences, 290(1038):199–218, 1980.
[11] Shojiro Nagata. How to reinforce perception of depth in single two-dimensional
pictures. Proceedings of the society for information display, 25(3):239–246, 1984.
[12] Karl Kral. Behavioural–analytical studies of the role of head movements in depth
perception in insects, birds and mammals. Behavioural processes, 64(1):1–12,
2003.
[13] Christina A Burbeck and Yen Lee Yap. Spatiotemporal limitations in bisection and
separation discrimination. Vision research, 30(11):1573–1586, 1990.
[14] Roland W Fleming and Heinrich H B¨ulthoff. Low-level image cues in the
per-ception of translucent materials. ACM Transactions on Applied Perception (TAP),
2(3):346–382, 2005.
[15] RA Kinchla and JM Wolfe. The order of visual processing:top-down,bottom-up,
or middle-out. Perception & psychophysics, 25(3):225–231, 1979.
[16] Mark J Fenske, Elissa Aminoff, Nurit Gronau, and Moshe Bar. Top-down
facilita-tion of visual object recognifacilita-tion: object-based and context-based contribufacilita-tions.
Progress in brain research, 155:3–21, 2006.
[17] Moshe Bar. A cortical mechanism for triggering top-down facilitation in visual
object recognition. Journal of Cognitive Neuroscience, 15(4):600–609, 2003.
[18] G¨unther Knoblich. Human body perception from the inside out. Oxford University
Press, 2006.
[19] Walter H Ehrenstein and Addie Ehrenstein. Psychophysical methods. In Modern
BIBLIOGRAPHY 27
[20] Wilson P Tanner Jr and John A Swets. A decision-making theory of visual
detec-tion. Psychological review, 61(6):401, 1954.
[21] Micah R Bregman, Aniruddh D Patel, and Timothy Q Gentner.
Stimulus-dependent flexibility in non-human auditory pitch processing. Cognition,
122(1):51–60, 2012.
[22] M Chun and J Wolfe.Visual Attention, Blackwell Handbook of Perception. Blackwell
Handbooks of Experimental Psychology. Wiley, 2001.
[23] John Duncan. Boundary conditions on parallel processing in human vision.
Per-ception, 18(4):457–469, 1989.
[24] H.E. Pashler. Attention. Studies in cognition. Psychology Press, 1998.
[25] Anne Treisman, Alfred Vieira, and Amy Hayes. Automaticity and preattentive
processing. The American journal of psychology, pages 341–362, 1992.
[26] Jan L Plass, Roxana Moreno, and Roland Br¨unken. Cognitive load theory.
Cam-bridge University Press, 2010.
[27] John Sweller, Paul Ayres, and Slava Kalyuga. Cognitive load theory, volume 1.
Springer, 2011.
[28] Wolfgang Schnotz and Christian K¨urschner. A reconsideration of cognitive load
theory. Educational Psychology Review, 19(4):469–508, 2007.
[29] Alan D Baddeley and Graham J Hitch. Working memory. The psychology of
learn-ing and motivation, 8:47–89, 1974.
[30] Alan Baddeley. The episodic buffer: a new component of working memory?


![Figure 1.5: Information about the motion can be perceived by either following orholding the eyes still in front of a moving object (inspired from [4])](https://thumb-us.123doks.com/thumbv2/123dok_us/7770386.1279168/31.612.166.462.72.277/figure-information-motion-perceived-following-orholding-moving-inspired.webp)
![Figure 1.6: The sensitivity of depth cues as a function of viewing distance [11]](https://thumb-us.123doks.com/thumbv2/123dok_us/7770386.1279168/32.612.90.525.63.380/figure-sensitivity-depth-cues-function-viewing-distance.webp)