Comparison between Solar PV Panel Based
On MPPT P&O Algorithm and Fuzzy Logic
Control
Vani Bhargwa1, Monalisha2
Assistant Professor, Dept. of EE, Ajay Kumar Garg Engineering College, Ghaziabad, Uttar Pradesh, India1
PG Student [EPES], Dept. of EE, Ajay Kumar Garg Engineering College, Ghaziabad, Uttar Pradesh, India2
ABSTRACT: In this paper there is a comparison between power output of solar PV which is based on MPPT P&O
algorithm and Fuzzy logic control. Output power of solar PV system is tracked through conventional P&O algorithm and maintains desired output power level. In this system boost converter is used to maintain the output voltage of solar PV system to the desired voltage level. Fuzzy logic control is used in place of conventional MPPT P&O algorithm to track the solar PV output power. The main aim of this project is to show the comparison of conventional MPPT P&O algorithm and the Fuzzy logic control.
KEYWORD: Mathematical modeling of solar PV module, Introduction of MPPT, MPPT algorithm, Fuzzy logic
controller.
I.INTRODUCTION
One of the biggest concerns in the power sector is the increasing power demand day by day but the absence of enough resources to meet the demand of power using the conventional sources of energy. Demand has increased for the energy of renewable sources to be utilized with conventional systems to achieve the energy demand. Wind energy and solar energy are the main energy sources which are utilized in this way. Continuously using of fossil fuels caused the reducing of fossil fuel deposit and affected the environment. Depletion of biosphere is also happen due to this.
Solar energy is available in large amount which made it possible to utilize it and harvest it. Solar energy is depends on the presence of a grid and is also act as grid connecting unit. Thus it may be used in rural areas where the presences of grids are very low. Another advantage of solar energy is the portable operation.
For tackle the present energy crisis it is to develop an effective manner in which there is an extraction of power from incoming solar radiation. The mechanisms of power conversion are reduced in size in the past few years. Development of power electronics and material science are very useful because it helped engineers to come up to withstand demand of high power. Increasing of power density is one of the big disadvantages of these systems. But they can act as a generation source of prime power in competitive markets because of low efficiency and high production of these systems.
II.NOMENCLATURE
In a PV module,
Output voltage is Vpv
Output current is Ipv
Reference temperature, Tr = 298 K
Module operating temperature, T (Kelvin)
Light generated current is Iph.
Module saturation current is Io.
An ideality factor, A = 1.6
Boltzmann constant, k = 1.3805 × 10⁻²³ J/K
Electron charge, q = 1.6 × 10⁻¹⁹ C
Series resistance is Rs.
Short-circuit current is Iscr.
The Co-efficient of short-circuit current temperature is Ki.
Iscr = 0.0017A /
Is illumination (W/m2) = 1000W/m2
The silicon band gap is Ego = 1.1 eV
Number of cells which is connected in series is denoted by Ns.
Number of cells which is connected in parallel is denoted by Np.
III. MATHENMATICAL MODELING OF SOLAR PV MODULE
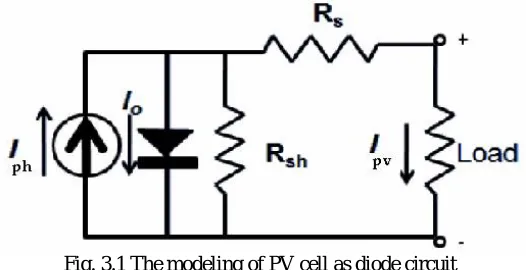
In Figure 3.1.There is an equivalent circuit which shows a PV cell
Fig. 3.1 The modeling of PV cell as diode circuit
The photo current of cell is represented by the Iph which is the source of current. Rsh is the intrinsic shunt resistance and Rs is the series resistance of cell. Generally the Rsh value is very large and Rs value is very small, so they can be neglected for making the analysis simple.
PV modules are the group of larger units of PV cells. For forming the PV arrays they are connected in parallel-series configuration.
In equations (1)- (4) there is a mathematical modeling of photovoltaic panel.
Module photo-current:
[ (T 298)]*/1000 (1)
The reverse saturation current of module - Irs:
/[exp(q / kAT) 1] (2)
The saturation current of module I0 varies with the temperature of cell, which is specified by
= [ ] exp[ ∗ { - }] (3)
The output current of the PV module is
= * - * [exp{ ∗( ) } – 1] (4)
Where Vpv = Voc, Np = 1 and Ns = 36
IV. INTRODUCTION OF MPPT
In the literature there are many different techniques of MPPT which have been reported. They are classified as the methods of on-line and off-line. The algorithms which are used in On-line methods are used in the calculating of actual power which is delivered by panels of PV. Then it compares it with previous values and also used in the adjusting of a reference signal which leads the actual MPPT. Off- line methods provide a reference signal which is based on detailed previous knowledge of PV array and parameter measurements like module temperature, solar irradiation level, open circuit and short circuit voltage and current of PV panel’s sample.
On line methods contain:
1. Perturbation & Observation algorithm
2. Incremental Conductance algorithm
Off line methods contain: 1. Constant voltage
2. Short- circuit current
V. MPPT ALGORITHM
In MPPT systems there are widely use of P & O algorithms because it has simple structure and simple implementation. In P&O algorithms, the perturbation variable may be the value of reference for terminal voltage of PV panel, output current of PV panel, or duty cycle of MPPT converter. In this algorithm, the voltage is adjusted by the controller from the array in a small amount and measures power. For the next cycle, the direction of the perturbation will carry on in the same direction when the value of power is increasing, otherwise the direction of the perturbation will be reversed. Thus this algorithm is also called hill- climbing algorithm.
5.1 The principle of P & O algorithm :
In P & O algorithms, the perturbation variable may be the value of reference for terminal voltage of PV panel, output current of PV panel, or duty cycle of MPPT converter. In the figure 5.1, when the point of operation is at the left side in MPP then it is identified that output voltage of panel of PV is perturbed with dp/dv > 0. Then these algorithms would increase the reference voltage of PV panel. When the point of operation is at the left side in MPP then it is identified that output voltage of panel of PV is perturbed with dp/dv < 0. Then these algorithms would decrease the reference voltage of PV panel.
If current is the perturbation variable, after that the perturbation in the output power of PV is proficient by increasing or decreasing of reference current with a small value. The main function in this algorithm is the determination of perturbation.
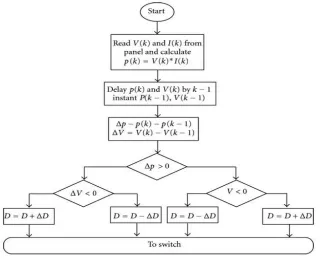
In fig 5.2, it shows the flow chart of the conventional P&O algorithms. By sensing solar PV voltage and current, power is calculate. In the process power is tracked and maintained power up to maximum power point.
Fig.5.2 Flow chart of P&O algorithms
VI. FUZZY LOGIC CONTROLLER
VII. RESULT AND DISCUSSION
Solar PV System with MPPT P&O Algorithms
In fig 7.1, It shows the block diagram of solar PV system with conventional MPPT P&O algorithms.
Fig. 7.1 Block Diagram of Solar PV System With MPPT P&O Algorithms
In this system solar radiation from the sun is received by solar PV module and this radiation is converted into electricity. The voltage and current of the solar PV system is sensed by the MPPT P&O algorithm and corresponding duty cycle is generated. With the help of the MPPT the maximum power of the solar system is tracked. Then the corresponding duty cycle is fed to the IGBT of the boost converter and it triggered the IGBT. This boost converter is used to convert output voltage of solar PV system to the desired level. With the help of the simulation the corresponding output is shown and output is shown with the help of the graph.
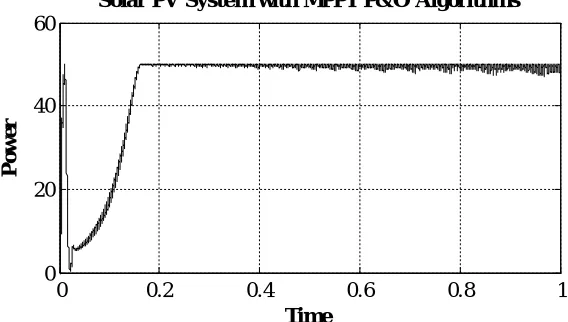
Simulation Result of Solar PV System with MPPT P&O Algorithms
In fig 7.2 show that the result of simulation of the solar PV system with conventional MPPT P&O algorithms. According to this simulation result there is some time delay for saturating the power curve and also seen that oscillation is increase with increasing time.
Fig 7.2 Power Curve Solar PV System with P&O Algorithms
0 0.2 0.4 0.6 0.8 1
0 20 40 60
Solar PV System with MPPT P&O Algorithms
Time
P
o
w
Solar PV System with Fuzzy Logic Control
In fig 7.3 show that the block diagram of solar PV system with fuzzy logic controller
Fig 7.3 Block Diagram of Solar PV System with Fuzzy Logic Control
In this system, the process is same as the as solar PV system conventional MPPT P&O algorithm but the difference is that conventional MPPT P&O algorithm is replaced by fuzzy logic control. With the help of the help of the fuzzy logic control duty cycle is generated and this duty cycle is fed to the IGBT of the boost converter. And this duty cycle is responsible for the triggering of the IGBT of the boost converter. With the help of the boost converter the output voltage of the solar PV system is converted to the desired level of voltage. Through the simulation we get the output result of the simulation with the fuzzy logic control. Through the simulation we find that simulation is faster than conventional MPPT P&O algorithms. Output of the system is shown below.
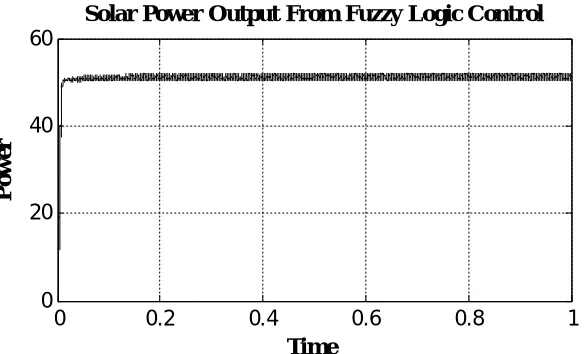
Simulation Result of Solar PV System with Fuzzy Logic Control
In fig. 7.4 shows that, This graph is resulted from solar PV system with fuzzy logic control. Power curve is saturated in less time than solar PV system with conventional MPPT P&O algorithm. And according to this graph the oscillation present in this graph is less than the conventional MPPT P&O algorithms.
Fig. 7.4 Power curve of solar PV System with Fuzzy Logic Control
0 0.2 0.4 0.6 0.8 1
0 20 40 60
Solar Power Output From Fuzzy Logic Control
Time
P
o
w
Solar PV System Curves
In fig 7.5 shows that, this graph is shows the I-V characteristic of the solar PV system.
Fig. 7.5 I-V Characteristic of Solar PV System
The MPP (Maximum Power Point) is a point on the I-V curve where the output of maximum power is located. The current and voltage at this point is denoted by Imp and Vmp. The maximum power (Pmax) are also derived from the value of Imp and Vmp.
Pmax (in Watts) = Vmp*Imp
The comparison of the performance of solar or PV module, the current versus voltage curve shown its current and voltage output possible combination. The product of current in amperes and the voltage in volts gives the power in the curve at any point.
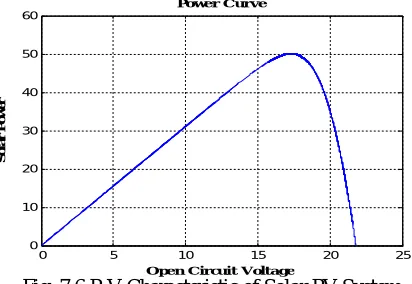
In fig 7.6 shows that, this graph is shows the P-V characteristic of the solar PV system
Fig. 7.6 P-V Characteristic of Solar PV System
VIII.CONCLUSION
In this paper, the conclusion of the simulation part shows that the power curve changes with respect to time. In conventional MPPT P&O algorithms the power-time curve is settled after some delay. But with the fuzzy logic control the power-time curve is settled in less delay time in comparison with the conventional MPPT P&O algorithms. And the harmonics generate through the conventional MPPT P&O algorithms is increasing with respect to time as the simulation is running further, but the harmonics generate through the fuzzy logic control is less with respect to conventional MPPT P&O algorithms. So through this conclusion it is clear that the fuzzy logic control is better than conventional MPPT P&O algorithms.
0 0.5 1 1.5 2 2.5 3 3.5
0 5 10 15 20 25
Solar I-V Characteristics
Open Circuit Voltage
S h o rt C u rc u it C u rr en t 0 10 20 30 40 50 60
0 5 10 15 20 25
S o la r P o w er
REFERENCES
[1] M.Veerachary,“Power Tracking for Nonlinear PV Sources with Coupled Inductor SEPIC Converter,” IEEE Transactions on Aerospace and Electronic Systems, vol. 41, No. 3, July 2005.
[2] I. H. Altas and A.M. Sharaf, “A Photovoltaic Array Simulation Model for Matlab-Simulink GUI Environment,” IEEE, Clean Electrical Power, International Conference on Clean Electrical Power (ICCEP '07), June 14-16, 2007, Ischia, Italy.
[3] S.Chowdhury, S.P.Chowdhury, G.A.Taylor, and Y.H.Song, “Mathematical Modeling and Performance Evaluation of a Stand-Alone Polycrystalline PV Plant with MPPT Facility,” IEEE Power and Energy Society General Meeting - Conversion and Delivery of Electrical Energy in the 21st Century, July 20-24, 2008, Pittsburg, USA.
[4]. M. G. Villalva, J. R. Gazoli, E. Ruppert F, "Comprehensive approach to modeling and simulation of photovoltaic arrays", IEEE Transactions on Power Electronics, 2009 vol. 25, no. 5, pp. 1198--1208, ISSN 0885-8993.
[5]. M. G. Villalva, J. R. Gazoli, E. Ruppert F, "Modeling and circuit-based simulation of photovoltaic arrays", Brazilian Journal of Power Electronics, 2009 vol. 14, no. 1, pp. 35--45, ISSN 1414-8862.
[6]. R. Sridhar, Dr. Jeevananathan, N. Thamizh Selvan, Saikat Banerjee, “Modeling of PV Array and Performance Enhancement by MPPT Algorithm", International Journal of Computer Applications (0975 – 8887) Volume 7– No.5, September 2010.
[7]. N. Panderajan and Rangnath Muthu, "Mathematical Modeling of Photovoltaic Module with Simulink", International Conference on Electrical Energy System (ICEES), 3-5 Jan 201l.
[8]. Mohd Zainuri, M.A.A.; Mohd Radzi, M.A.; Soh, A.C.; Rahim, N.A., "Development of adaptive perturb and observe-fuzzy control maximum power point tracking for photovoltaic boost dc-dc converter," IET Renewable Power Generation,, vol.8, no.2, pp.183,194, March 2014
[9]. Wu, Y., Zhang, B., Lu, J., Du, K.L; ‘Fuzzy logic and neuro-fuzzy system: a systematic introduction’, Int. J. Artif. Intell. Expert Syst. (IJAE), 2011, pp. 47–80.
[10]. L. F. Casey, C. Schauder, J. Cleary, and M. Ropp, “Advanced inverters facilitate high penetration of renewable generation on medium voltage feeders - impact and benefits for the utility,” in Proc. IEEE Conf. Innovative Technol. Efficient Reliable Electr. Supply, Sep. 27–29, 2010, pp. 86–93. [11]. G. Marcelo. J. Gazoli and E. Filho, “Comprehensive approach to modeling and simulation of photovoltaic arrays”, IEEE Transaction on Power Electronics. Vol. 24, no. 5, May 2009.pp.1198-1208.
[12]. B. K. Bose, “ Energy, environment, and advances in power electronics,” IEEE Trans. Power Electron., vol. 15, no. 4, pp. 688-701, Jul. 2000. [13]. F. Blaabjerg, C. Zhe, and S. B. Kjaer, “Po wer e lectronics as efficient interface in dispersed power generation systems,” IEEE Trans. Power Electron., vol. 19, no. 5, pp. 1184-1194, Sep. 2004.
[14]. F. M. González-Longatt, “Model of photovoltaic module in Matlab,” in 2do congreso iberoamericano de estudiantes de ingenierıacute;a eléctrica, electrónica y computación, ii cibelec, 2005, pp. 1– 5.