7
Osmo-air drying of pumpkin (Cucurbitacae maxima)
cubes and selection of suitable drying model
Sagar S. Shelke1, Pradip A. Borkar2, Rajesh P. Murumkar3, Mahendra R. Rajput4 1M. Tech. Scholar, 2Associate Professor, 3Assistant Professor, 4Sr. Research Assistant
Dr. Panjabrao Deshmukh Krishi Vidyapeeth (Agricultural University), Akola, India
Abstract
In this study, the osmotic dehydration in 50, 60 and 70ºBrix sugar solution at 30,45 and 60ºC syrup temperature) and drying air temperature (45, 55 and 65ºC) on drying behaviour of pumpkin cubes were investigated. The pumpkin cubes were dried in a laboratory model tray dryer. Drying of pumpkin occurred in falling rate period. Four thin-layer drying models (Exponential, Page, Henderson and Pabis and Logarithmic) were fitted to the moisture ratio data. Among the drying models investigated, the Logarithmic model satisfactorily described the drying behavior of pumpkin cubes. The effective moisture diffusivity of osmo-convectively dried samples increased with increase in drying air temperature.
Keywords: Pumpkin; Drying; Mathematical models; Diffusivity.
1. Introduction
Pumpkin (Cucurbita maxima) belongs to Cucurbitacae family. The knowledge of the nutritive value is to encourage the increase in the consumption and their use for nutritional and technological applications. Pumpkin is a good source of carotene, water soluble vitamins and amino acids. It is relatively in total solids, usually ranging between 7% to10% (Arevalo-Pinedo and Murr, 2006; Alibas, 2007). This is rich in antioxidants and vitamins which allows the pumpkin to have an important health-protecting effect. In fact, the range of values of lipophilic substances as carotenoids present in pumpkin varieties can contribute significantly to the uptake of provitamin A and especially lutein, a carotenoid with special physiological functions (Murkovic et al., 2005).
Pumpkins are also poor in total solids (Alibas, 2007) and in calories, which means that they are adequate for low calories regimes, and they are often recommended in diets. This vegetable is also known for the properties of its seeds, that are rich in fat, protein, thiamine, niacin and various minerals (Almeida, 2006).
8 To improve air-drying process, pre-treatment prior to drying is required, osmotic dehydration is one of the most useful pre-treatment for drying of fruits and vegetables (Beaudry, 2001). Osmotic dehydration is the incomplete removal of water from a food product by means of an osmotic agent (usually either sugar or salt solution). The main advantage of this process is its influence on the principal drying method, shortening of the drying process, resulting in lower energy requirements. Considering that heat is not applied in this stage, osmotic dehydration offers higher retention of initial food characteristics, such as color, aroma, nutritional constituents, and flavor compounds. Sucrose is considered one of the best osmotic substances, especially when the osmotic dehydration is employed before drying. The presence of this sugar on the surface of the dehydrated sample is an obstacle for the contact with oxygen (Lenart, 1996), which reduces the oxidative reactions.
The drying kinetics of food is a complex phenomenon and requires simple representations to predict the drying behavior, and for optimize the drying parameters. Recently, studies have been done on drying kinetics of fruits and vegetables (Sabarez & Price, 1999; Togrul & Pehlivan, 2002; Soysal, 2004; Doymaz, 2004; Cao et al., 2004; Jain & Pathare, 2004). However, work on the effect of pretreatments i.e. osmotic dehydration, on drying kinetics of pumpkin has not yet been reported. The objective of this study was (i) to investigate the influence of pretreatments and drying air temperature in the drying behavior of pumpkin, (ii) to evaluate a suitable thin-layer drying model for describing the drying process, and (iii) to calculate the effective moisture diffusivity.
2. Materials and methods 2.1. Raw material
Pumpkin (Cucurbitacae maxima) for this investigation was procured from the College of Horticulture, Dr. Panjabrao Deshmukh Krishi Vidyapeeth (Agricultural University), Akola (Maharashtra). Fresh whole pumpkin of ‘Vishal’ variety were washed, peeled, sliced. The slices were cut into 10 × 10 × 10 mm cubes using stainless still cutter. The initial moisture content was determined by AOAC methodology no. 934.06 (AOAC, 1990), which was 89-92 % wb.
2.2 Osmotic dehydration
Pumpkin cubes were partially dehydrated using osmotic dehydration technique. The cubes were placed in different containers holding 50, 60 and 70 ºBrix of sugar solution at temperatures (50, 60 and 70ºC) for 4 h; and stirring of the solution was done at regular intervals of 15 minutes. Syrup to fruit ratio was kept constant as 4:1. After a period of 4 h, cubes were removed quickly and blotted gently using a tissue paper to remove the surface moisture.
2.3. Hot-air-drying
9 variation in the moisture loss. Experiments were replicated thrice. A total 3 treatments combination as described in Table 1 was conducted.
2.4. Mathematical modelling
Mathematical modeling is essential to predict and simulate the drying behavior. It is also an important tool in dryer’s design, contributing to a better understanding of the drying mechanism. The experimental drying data was graphically analyzed in terms of reduction in moisture content and moisture ratio with drying time. Since the moisture ratio curve can better explain the drying behavior than that of moisture content curve, the moisture ratio values were used to predict the drying model for osmo-convectively dried samples of pumpkin. To select a suitable model for describing the drying process of pumpkin cubes, drying curves were fitted with four thin-layer drying equations, namely Exponential (Eq. (1)), Page (Eq. (2)), Henderson–Pabis (Eq. (3)), Logarithmic (Eq. (4)). (Akpinar et al., 2005; Doymaz, 2004; Togrul & Pehlivan, 2002).
Exponential MRexp
kt … (1)Page MRexp
ktn
… (2)Henderson-Pabis
MR
a
exp
kt
… (3)Logarithmic
MR
a
b
ln
t
… (4)The acceptability of the model has been determined by the coefficient of determination (R²), was one of the main criteria for selecting the best equation. In addition to the coefficient of determination, the goodness of fit was determined by various statistical parameters such as reduced mean square of the deviation χ² and root mean square error ERMS. For quality fit, R² value should be higher close to one and χ² and ERMS values should be lower (Pangavhane et al., 1999; Sarsavadia et al., 1999; Togrul & Pehlivan, 2002; Erenturk et al., 2004; Demir et al., 2004). The above parameters can be calculated as follows:
z N M M N i R i Rprei
1 2 , , exp, , 2 … (6)
12 1 2 exp, , , , 1
Ni Rprei R i RMS M M N E … (7)Where: MR,exp,i and MR,pre,i are the experimental and predicted dimensionless moisture
ratios, respectively; N is the number of observations; and z is the number of drying constants.
3. Results and discussion
3.1 Drying behaviour of osmo- convectively dried pumpkin cubes
10 dehydration rate of pumpkin cubes also pre-treatment of fruits in sugar solutions usually reduces the convective drying rates (Simal et al., 1997, Karathanos & Kostaropoulos, 1995, Rahman and Lamb, 1991).
Effect of osmotic on drying curves of pumpkin cubes dried at 45, 55 and 65ºC are presented in Figure 2. The drying curves show that moisture ratio decreases continuously with drying time. Pumpkin cubes did not exhibit a constant rate period of drying. The entire drying took place in the falling rate period. Similar results have been reported for the drying studies on onion slices (Rapusas & Driscoll, 1995) and apricots (Doymaz, 2004). Continuous decrease in moisture ratio indicates that, diffusion has governed the internal mass transfer. This is in agreement with the results of study on onions (Mazza & Maguer, 1980), lettuce and cauliflower leaves (Lopez et al., 2000) and figs (Piga et al., 2004).
3.2 Mathematical modeling of drying curves
The moisture ratio data of osmotically dried pumpkin cubes dried at various temperatures were fitted into the different thin-layer drying models mentioned above. The values of (R2), χ² and E
RMS, are summarized in Table 2.
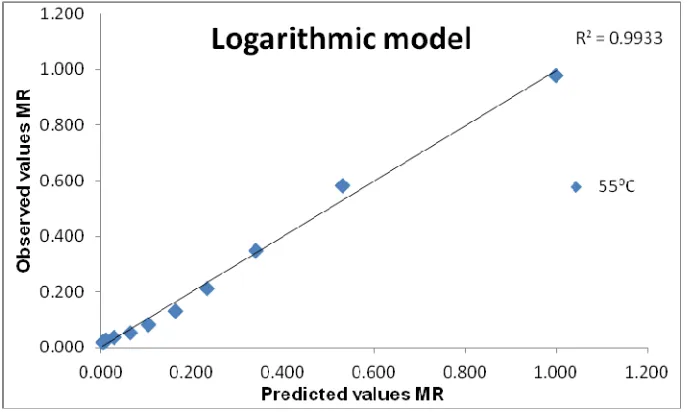
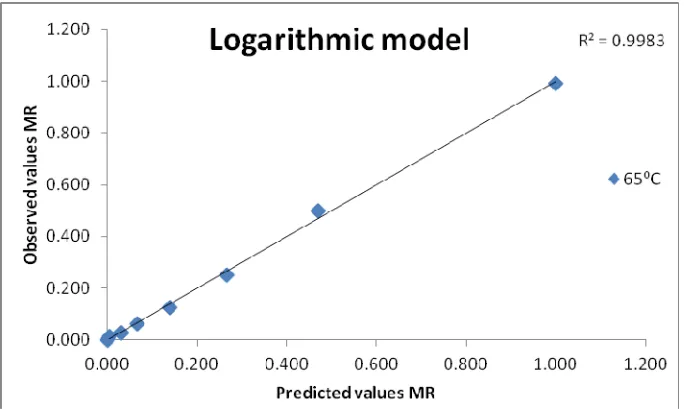
It was observed that in all cases, the values of R² was greater than 0.90, indicating a good fit (Madamba et al., 1996; Erenturk et al., 2004). But the logarithmic model gave comparatively higher R² values in all the drying treatment (0.996-0.999) and also the χ² (0.000 – 0.01) and ERMS (-0.001 - 0.003) values were
lower. Hence, the Logarithmic model may be assumed to represent the thin-layer drying behaviour of pumpkin cubes. Demir et al. (2004) and Goyal et al. (2006) reported a similar result for air-drying of bay leaves and raw mango slices, respectively.
Figures 3, 4 and 5 shows a comparison between both observed and predicted moisture values obtained using the Logarithmic model, which gave the best fit for the entire Pumpkin drying process. This means that the model has very high performance for describing the characteristics of drying curves.
3.3 Calculation of effective moisture diffusivity
The continuous decrease in moisture ratio with increase in drying time shows that the results can be interpreted by using Fick’s diffusion model. The solution of Fick’s diffusion equation for particles with slab geometry, with the assumption that moisture migration was caused by diffusion, negligible shrinkage, constant diffusion coefficients and temperature was as follows (Crank, 1975): For infinite plate shape (Pumpkin cubes was considered to be infinite plate shape)
2 eff 2 2 1 2 2 0 4 π 1 2 exp 1 2 1 π 8 H t D n n M M M M M n e eR ... (8)
For long drying periods, Eqn (8) can be further simplified to only the first term
of the series.
2 eff 2 2 0 4 π π 8 ln ln H t D M M M M e e ... (9)
Where, MR is the dimensionless moisture ratio, M the moisture content at any
time (g H2O/g dry matter), M0 the initial moisture content (g H2O/g dry matter), Me
the equilibrium moisture content (g H2O/g dry matter), Deff the effective diffusivity
(m2/s), H the half thickness of slab in sample (m), n the positive integer, t the Time (s).
A general form of Eq. (9) could be written in semi-logarithmic form, as follows.
MR ABt11 The effective diffusivity is typically calculated by plotting experimental drying data in terms of ln (MR) versus drying time. From Eqn (10), a plot of ln (MR)
versus the drying time gives a straight line with a slope of:
2 eff 2
4
π
H D
Slope … (11)
Drying at higher temperature gave highest Deff values. The moisture
diffusivity value of food material was affected by moisture content as well as temperature. At lower level of moisture content the diffusivity is less than that of high moisture content. Also it was observed that moisture diffusivity increased with drying air temperature in osmotically dried samples which is in accordance of the results reported by Rahman and Lamb, (1991) and Pokharkar and Prasad (1998). The moisture diffusivity varied in the range of 9.73 ×10-08m²/s, 11.68 ×10-08m²/s and 14.92×10-08m²/s for osmo-convectively dried samples depending on the drying air temperature (Table 1). These values are within the general range of 10-08 to 10-12m²/s for drying of food materials (McMinn and Magee, 1999).
4. Conclusions
The effect of temperature and osmo-convective drying behavior of Pumpkin cubes in tray dryer was investigated in this study. Increase in drying air temperature from 45 to 65ºC decreased the drying time from 240 to 360 min for osmo-convectively dried samples. The entire drying process occurred in falling rate period and constant rate period was not observed. Four thin-layer drying equations were investigated for their suitability to describe the drying behavior of pumpkin cubes. The Logarithmic model shows the best fit with high values for the coefficient of determination (0.996-0.999) and low χ² and ERMS values. The effective moisture
diffusivity varied from in the range of 9.73 ×10-08m²/s to14.92×10-08m²/s for
osmo-convectively dried samples at different drying air temperature. Acknowledgements
The authors are highly thankful to All India Coordinated Research Project on Post Harvest Technology, Dr. Panjabrao Deshmukh Agricultural University, Akola, Maharashtra, India for providing facilities to carry out this research work.
[References]
[1] Akpinar, E.K., Bicer, Y., 2005. Modelling of the drying eggplants in thin-layers. International Journal of Food Science & Technology 40, 273-281.
[2] Alibas I. 2007. Microwave air and combined microwave-air-drying parameters of pumpkin slices. LWT40(8):1445-1451
[3] Almeida D., 2006. Manual de culturas horticolas. Editorial Presenca, Portugal, Lisboa, p. 111.
[4] AOAC, 1990. Official method of analysis of the Association of Official Analytical Chemist. No. 934.06. Arlington, USA.
[5] Arevalo-Pinedo and Murr F. E. X., 2006 Kinetics of vaccum drying of pumpkin (cucurbita maxima): modeling with shrinkage. Journal of Food Engineering 76, 562-567
12 [7] Beppu, H., Nagamura, Y., Fujita, K., 1993. Hyglycaemic & antidiabetic effects in mice of Aloe arborescens Miller var. natalensis berger. Phytotherapy Research 7, 37- 42.
[8] Cao, W., Nishiyama, Y., Koide, S., 2004. Simulation of intermittent drying of maitake mushroom by a simplified model. Biosystems Engineering 87(3), 325 – 331.
[9] Crank, J., 1975. The mathematics of the diffusion. Oxford university press, London. 39-58.
[10] Demir, V., Gunhan, T., Yagcioglu, A.K., Degirmencioglu, A., 2004. Mathematical modelling & the determination of some quality parameters of air-dried bay leaves. Biosystems Engineering 88(3), 325 - 335.
[11] Doymaz, I., 2004. Effect of pre-treatments using potassium metabisulphide & alkaline ethyl oleate on the drying kinetics of apricots. Biosystems Engineering 89(3), 281 – 287
[12] Erenturk, S., Gulaboglu, M.S., Gultekin, S., 2004. The thin-layer drying characteristics of rosehip. Biosystems Engineering 89(2), 159 - 166.
[13] Goyal, R.K., Kingsly, A.R.P., Manikantan, M.R., Ilyas, S.M. 2006. Thin-layer drying kinetics of raw mango slices. Biosystems Engineering 95(1), 43 - 49. [14] Jain, D., Pathare, P.B., 2004. Selection and evaluation of thin layer drying
models for infrared radiative and convective drying of onion slices. Biosystems Engineering 89(3), 289 – 296
[15] Jarayaman, K.S., Das Gupta, D.K., 1995. Drying of fruits and vegetables. In A. S. Mujumdar (Ed.), Handbook of industrial drying (pp. 643–690). New York: Marcel Dekker Inc.
[16] Karathanos, V.T., Kostaropoulos, A.E., Saravacos, G.D., 1995. Air drying kinetics of osmotically dehydrated fruits. Drying Technology 13(5-7), 1503 - 1521.
[17] Lenart, A., 1996. Osmo-convective Drying of Fruits and Vegetables: technology and application. Drying Technology 14(2),391.
[18] Lopez, A., Iguaz, A., Esnoz, A., Virsed, P., 2000. Thin-layer drying behaviour of vegetable wastes from wholesale market. Drying Technology 18, 995-1006. [19] Madamba, P.S., Driscoll, R.H. & Buckle, K.A., 1996. The thin-layer drying
characteristic of garlic slices. Journal of Food Engineering 29, 75–97.
[20] Mazza, G., Maguer, M.L., 1980. Dehydration of onion: some theoretical and practical considerations. Journal of Food Technology 15, 181-194.
[21] McMinn, W.A.M., Magee, T.R.A., 1999. Principles, methods and applications of the convective drying of foodstuffs. Transactions of Institution of Chemical Engineers 77(c): 175-193.
[22] Murkovic M, Mulleder U and Neunteufl H (2005) Carotenoid content in different varieties of pumpkins. Journal of Food Composition and Analysis, 15, 633-638. [23] Okos, M.R., Narasimhan, G., Singh, R.K., Witnauer, A.C., 1992. Food
dehydration. In D. R. Heldman, & D. B. Lund (Eds.), Handbook of food engineering. New York: Marcel Dekker.
[24] Pangavhane, D.R., Sawhney, R.L., Sarsavadia, P.N., 1999. Effect of various dipping pre-treatment on drying kinetics of Thompson seedless grapes. Journal of Food Engineering 39, 211-216.
13 [26] Pokharkar, S.M., Prasad, S., 1998. Mass transfer during osmotic dehydration of
banana slices. Journal of Food Science and Technology 35(4), 336-338.
[27] Rahman, M. S & Lamb, J. (1991). Air drying behaviour of fresh and osmotically dehydrated pineapple. Journal of Food Process Engineering, 14, 163-171. [28] Rapusas, R.S., Driscoll, R.H., 1995. The thin-layer drying characteristics of
white onion slices. Drying Technology 13(8&9), 1905-1931.
[29] Sabarez, H.T., Price, W.E. 1999. A diffusion model for prune dehydration. Journal of Food Engineering 42, 167-172
[30] Sarsavadia, P.N., Sawhney, R.L., Pangavhane, D.R., Singh, S.P., 1999. Drying behaviour of brined onion slices. Journal of Food Engineering 40, 219-226. [31] Simal, S., Deya, E., Frau, M., Rossello, C., 1997. Simple Modelling of Air
Drying Curves of Fresh and Osmotically Predehydrated Apple Cubes. Journal of Food Engineering 33,139.
[32] Soysal, Y., 2004. Microwave drying characteristics of parsley. Biosystems Engineering, 89(2), 167-173
14 Fig. 1. Schematic diagram of tray dryer: (1) Thermocouples (2) Digital balance (3) (4) Blower
(5) Door (6) Trays
Fig 2 Effect on osmo-convective drying for concentration of
53.98oBrix at drying air
temperature of 45, 55 and 65ºC.
1 Air outlet
Air inlet
2
4
15 Fig 3 Observed and predicted values of moisture ratio by logarithmic model for
45⁰C temperature.
16 Fig 5 Observed and predicted values of moisture ratio by logarithmic model for 65⁰C temperature.
Table 1 Drying time and Effective moisture diffusivity for pumpkin cubes
Treatme nt
Temperatu re of osmotic solution
(ºC)
Syrup concentrati
on (ºBrix)
Temperatu re of drying
(ºC)
Dryin g time (min)
Diffusivit y (m²/s)
R2 value
s
1 57.50 53.98 45 240 9.73×10- 0.982
2 57.50 53.98 55 300 11.68×10- 0.975
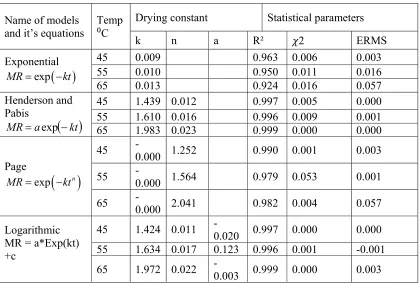
17 Table 2 Values of model constants and statistical parameters
Where,
a, b drying coefficients
Deff effective diffusivity in m2/s
ERMS. root mean square error
H half thickness of slab in sample in, m k drying constant
M moisture content at any time, g H2o/g dry matter
M0 initial moisture content, g H2o/g dry matter
Me equilibrium moisture content, g H2o/g dry matter
MR moisture ratio, dimensionless
N number of observations
n drying constant, positive integer R² coefficient of determination t time (s)
χ² reduced mean square of the deviation z number of drying constants.
Subscripts
pre predicted exp experimental Name of models and it’s equations
Temp
⁰C
Drying constant Statistical parameters
k n a R² 2 ERMS
Exponential
exp MR kt
45 0.009 0.963 0.006 0.003
55 0.010 0.950 0.011 0.016
65 0.013 0.924 0.016 0.057
Henderson and Pabis
kt aMR exp
45 1.439 0.012 0.997 0.005 0.000
55 1.610 0.016 0.996 0.009 0.001
65 1.983 0.023 0.999 0.000 0.000
Page
exp n
MR kt
45 -0.000 1.252 0.990 0.001 0.003
55 -0.000 1.564 0.979 0.053 0.001
65 -0.000 2.041 0.982 0.004 0.057
Logarithmic MR = a*Exp(kt) +c