Coverage Optimization based on Redundant Sense
Area Ratio in Wireless Multimedia Sensor
Networks
T.Sridevi, R.Vinothini, N.Ramya, T.N.Prabhu
Department Of Information Technology, Sri Ramakrishna Engineering College,
Coimbatore.
Abstract-In wireless multimedia sensor networks coverage area and redundant sensor are a major problem thus throughput is minimum and more delay .In order to optimize the network coverage, use a coverage-enhancing algorithm based on overlap-sense ratio. By adjusting the sensing directions of the nodes, the coverage area is increased with the reduction of complexity. In addition modified strategy algorithm is used to increase the network by reducing redundant. We proposes a load balancing algorithm which ensures a fair traffic load distribution per link during the network operation and matches the values returned by the mathematical planning model for the set lifetime and throughput. Experimental results show that the proposed method achieves high throughput and less energy consumption when compared to the existing method.
Keywords
Coverage-enhancing, throughput, traffic load distribution.
I.INTRODUCTION
Wireless sensor networks have drawn a more attention in the last few years including traditional WSNs and wireless multimedia sensor networks (WMSNs). The WSNs is the networks composed of low-cost, low-power, and small-size sensors that have circle sense area and communicate information by multiple hop and only provide simple sensing data, such as temperature, humidity, and so not as to meet the requirement of more complicated and precise data applications. But WMSNs is the distributed sensing networks composed of video cameras that have sector sense area and can process, send, and receive more intensive and complicated video information data by packaging with wireless transceiver and differ from the WSNs due to their characteristic of directivity and turnability. In WMSNs, it can be determined by coordinate, radius of sensors, the direction of sense sector, and the size of separation angle. After randomly deployed, Coverage-enhancing algorithm can maximize coverage of a region with minimum activated sensors and maximize networks lifetime with maximum redundant sensors. A coverage-enhancing algorithm is used based on overlap-sense ratio (OSRCEA) for a given region. Assuming that parameters of neighboring sensors are known, the parameter of “overlap-sense ratio (OSR) is introduced to represent the whole impact of neighboring sensors [1]. In addition to that, a modified strategy of shutting off redundant sensor is
proposed to prolong the network lifetime. But in this method, the throughput is which the traffic load that must be transmitted to each network link as a function of the available battery level of the nodes.
II. RELATED WORK
The problem addressed in existing model is two topics namely 1.Throughput, 2.More delay. Most of the proposed techniques have given only implicit assumptions about coverage area and network lifetime and did not deal with the throughput and delay [1].Without addressing the problem of throughput and more delay, only the coverage area and network lifetime of wireless multimedia sensor networks is addressed. cluster the sensors into several sets, such that sensors in each of the sets can completely perform the monitoring task. Then, these sets are activated successively. We define the active set as a set of sensors which perform the monitoring task completely. Therefore, at any moment, only the sensors in one active set go into an active state and perform the monitoring task. On the contrary, all the other sensors, which belong to the non‐active sets, are in the low‐energy sleep state. Therefore, to maximize the lifetime of the network, it is critical to rotate the roles of the active set among the sensors in the network. It helps efficient usage of another scarce resource such as bandwidth. But they have high energy consumption and delay [8].The problem of coverage by directional sensors with tunable orientations under the random deployment strategy.
To develop solutions that maximizes the number of targets to be covered while minimizing the number of sensors to be activated at any instant [3]. To provide higher degree of coverage in which multiple sensors monitor the same location at the same time in order to obtain high confidence in detection [8].
Consider the above defensives to introduce LOAM (optimal load balancing algorithm) in run time, the traffic load that must be transmitted to each network link as a function of the available battery level of the nodes to reduce the complexity of throughput and delay.
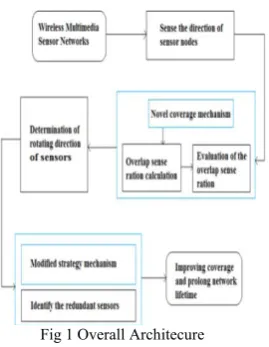
Fig 1 Overall Architecure
In this paper, sensing field with nodes being deployed randomly square region is used to describe the square region Fig.2 (a).The bi- dimensional sector area is utilized to model the sensing region of directional sensor, which is illustrated in Fig.2 (b).
(a) (b) Fig 2 Sensing field and directional sensing field
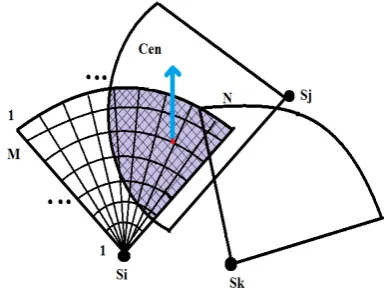
The directional sensing model can be represented by (Pᵢ, R, ,α) where Pᵢ(x, y) denotes the location of nodes Sᵢ, R is the radius of a sensing region that indicates the maximum sensing range of nodes, is a unit vector called sensing direction that divides a sensing region into two parts. Sensing angle is denoted by α, where 2 α describes the sensor’s field of view (FOV). Intersection angle between the sensing direction of nodes Sᵢ and X axis is called the direction angle denoted by φi with the range of[0,2П). In the sensing field, neighboring sensors are the nodes whose Euclidean distance to the current node is less than 2R. It is enough to consider the effect of neighboring sensors and adjust node’s sensing direction. It can be seen that S1 and S2 are the neighboring sensors of Sᵢ, S3 is not the neighboring sensor because the distance between Sᵢ and S3 is larger than 2R. The grid part represents the overlapping region of Si. The centroid of the overlapping region is denoted by Cen The centroid angle is the angle is the angle between X axis and the line which pass through Cen and the node, denoted by ᵝᵢ with the range of[0,2П)shown in Fig.3.Based on that diagram find the direction angle for rotating sensors to cover the maximum area.
Fig 3 Sensing model with neigboring sensors
IV. NOVEL COVERAGE METHOD FOR COVERAGE AREA This method can be used to increase coverage area A Overlapping Region
In this Novel Coverage Method for Coverage Area use OSR parameter, denoted by η is used to reduce the
overlapping region of current node. The OSR is represented by ratio of the overlapping area and sensing area,
2
1
M
M
η
=
(1)Where M1=αR² is the sensing area and M2 is the overlapping area. It can be seen that ηϵ[0, 1].Different from traditional virtual force methods, OSR is a scalar operation. There are two special cases in the relationship between OSR and the rotational angle. When η ≈1 based on that condition the node should rotate its direction with the greatest rotation angle maximally reduce the overlapping region, .i.e, the rotation angle is equal to sensing angle α. This case is shown in Fig.4(a).where S1 is almost covered by S2 and S1 should rotate counterclockwise direction with the angle of α Similarly S2 should rotate clockwise direction with the same angle of α. Therefore the result is no overlapping between the region of S1 and S2, which is shown in Fig.4 (b) the other case η=0, in this case no overlapping region between S1 and S2 so it is unnecessary to adjust its sensing direction of nodes.
Fig 4: Adjust of sensing direction when
η
≈
1
The rotation angle of node Sᵢ is denoted as
( )
i
g
iθ α
= ×
η
(2)1,
1
( )
0,
(0,1)
1
i
i i threshold
threshold i
g
η
η
η η
η
η
=
=
<
≤ <
(3)
When ηᵢ is very small the corresponding rotation angle also very small .It is difficult for sensor to implement in an practical application. So therefore ηthreshold is introduced to
meet physical realization in rotation. When ηᵢ>=ηthreshold the
node with greatest rotation angle turns a larger rotation angle.
B Evaluation of Overlapping Area
To obtain the optimal rotation angle, overlapping area should be calculated accurately. Due to irregularity of the overlapping region the grids are adopted to compute the overlapping area. First sensing radius and FOV are divided into M and N pieces, so the sensing angle is divided into M x N pieces, which is shown in Fig.5
The Center of each piece is represented by piece’s location coordinates. The area of piece is:
(
2(p 1)
2)
2 ipqR
Area
p
M
N
α
=
− −
×
×
(4)Based on that equation each pieces of the variable is only related to p variable and other is constant.
Fig 5 Computation of overlapping Area
According to the overlapping area
2
1 1
M N
ipq ipq
p q
M
Cg
Area
= =
=
×
(5)Where Cgipq covered mark in p-rows and q-columns of Sᵢ.
It is one if it is p-rows and q-columns are covered by its neighboring sensors otherwise it is zero. Substitute the equation (5) into (1) the OSR equation is written as:
1 1 2 M N ipq ipq p q i
Cg
Area
R
η
α
= =×
=
(6)C Determination Rule for Rotation Direction
Node’s rotating direction is equal to the location of Cen. Cen is denoted the distribution of overlapping region and the overlapping region is represented by the sum of overlapping region. When Cen is located in the clockwise direction that seems more overlapping region in the sensing direction. So the nodes need to rotate counterclockwise
direction to reduce overlap and vice versa. Cen is located in the sensing direction that indicates both clockwise and counterclockwise are in overlapping area so the nodes can choose rotating direction randomly. The rotating direction is decide for the relationship between direction angle φᵢ and centriod angle ᵝᵢ.It is not necessary to calculate the centriod angle there is no overlapping otherwise calculate the centriod angle ᵝᵢ.
The Horizontal Cen of coordinates
1 1
1 1
M N
ipq ipq
p q
i M N
ipq p q
Cg
x
xCen
Cg
= = = =×
=
(7)The Vertical Cen of Coordinates
1 1
1 1
M N
ipq ipq
p q
i M N
ipq p q
Cg
y
yCen
Cg
= = = =×
=
(8)Where xipqand yipqare the horizontal and vertical
coordinates of p-rows and q-columns of Sᵢ. When is obtained through (7) and (8) equation .The Euclidean distance between Cen and node is:
2 2
(
)
(
)
i i pi i pi
d
=
xcen
−
x
+
ycen
−
y
Where xip and yip are the horizontal and vertical coordinates
of Sᵢ .Considering the range of ᵝᵢ centriod angle into two cases based on the vertical coordinates when ycen<ypithe
centriod angle is:
2
arccos
i pii
i
xCen
x
d
β
=
π
−
−
(9) When ycen>ypi the centriod angle is:arccos
i pii
i
xCen
x
d
β
=
−
(10)Once centriod angle is obtained to determine the rotating direction by the relationship between direction angle and centriod angle.
Specific determination rule is divided into the following two situations:
,
0
2
,
,
,
i i
i i i
Clockwiserotation
Randomrotation
Counterclockwiserotation othercases
ϕ β
ϕ π α
ϕ β
<
≤ ≤ −
=
(11),
2 2 , ,
,
i i
i i i
Counterclockwiserotation
Randomrotation
Clockwiserotation othercases
ϕ β
π α ϕ
π
ϕ β
>
− < < =
Fig 5(b) Rule for rotating
2
π α ϕ
− < <
i2
π
Algorithm 1 OSR
1. Find neighboring sensors; 2. Set parameter state=1 3. While(turn==1) 4. Calculate OSR;
5. Node turns optimal angle according to the rotation angle function;
6. if(network is equilibrium) 7. turn=0;
8. end 9. end
10. calculate OSR;
11. while(OSR>=predefined threshold) 12. calculate priority;
13. if(priority is highest) 14. state=0;
15. send state information to its neighboring sensors 16. else
17. calculate OSR; 18. end
19. end
V.MODIFIED STRATEGY
The optimization of network coverage is finished but there is some redundant sensors in the network due to some sensors are overlapping with the neighboring sensors. The node whose OSR is larger than predefined threshold there is some redundant sensors. It leads to unnecessary energy consumption to keep the redundant sensors active. In order to increase the network lifetime after optimize network coverage.
There are several steps for shutting redundant sensors. First compute the OSR for each node .Then determine each node have redundant or not. There is redundant in the node set priority for each node. If the priority is high shut off the node otherwise lowest priority will be changed because of the closed sensor .It means some of redundant may be no longer redundant. It is necessary to decide whether unclosed nodes are still redundant or not. The above step should be repeated there is no redundant node in the network.
VI.LOAD OPTIMAL BALANCING ALGORITHM
Optimal Load Balancing Algorithm is aimed at approaching the best redistribution of the traffic load according to the connectivity results offered by the former optimization. This algorithm determines, in runtime, the traffic load must be transmitted to each network link. In every node running LOAM distributes the data flow among all its neighbors in coverage from source to destination. In this method the throughput per link has the restriction imposed by the traffic generated (v) as lower limit and the nominal bandwidth of the network (Ψ) as upper bound. These bounds must be fulfilled regardless of the type of traffic generated (sensing/monitoring data or video traffic). Therefore, once the value of the throughput per link is bonded. Finally, the aggregate throughput at expression is upper bounded by the sum of nominal bandwidths of all available links and it is lower bounded by zero, which is the lack of data transmissions. This fact assures the convergence of our calculations because the outcomes must be comprised between these bounds
2 1 2 1
^ . . . .
0, 0, 0, ( , ) ,
N N V N N D
ij ij i j ij ij i j
i j i j
V D
ij ij Network
V D
ij ij ij
ij
Maximize th K S th K S
th th T i j N i j
th th th th ψ
→ →
= = = =
= +
> > > ∀ ∈ ≠ = +
≤
Where thij is achieved throughput of the link. thvijis
achieved throughput of source data of the link.˄ denotes the aggregated throughput. Kijis the parameter that indicates
the existence of a link between nodes I and j.Si->j when a
message is transmitted to a node, parameter that indicates if this node is nearer to the sink than the transmitter one. If S i->j =1 the nodes selected is nearer to the sink; otherwise S i->j=0.Ψ denotes the maximum transmission bit rate.
VII.PERFORMANCE EVALUATION
In this section, the existing and the proposed methods are compared. In this existing system, in order to enhance the coverage area a Coverage-Enhancing Algorithm is used based on overlap sense ratio. By adjusting the sensing direction of the nodes, the coverage area is increased with the reduction of computational complexity. In the proposed system, a load balancing algorithm is used which ensures a fair traffic load distribution per link during the network operation and matches the values returned by the mathematical planning model for the set lifetime and throughput
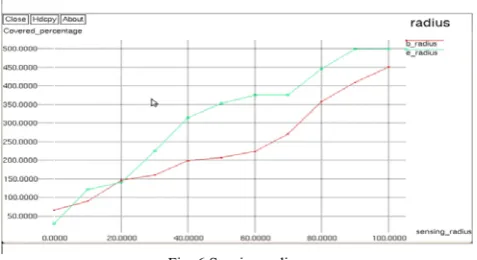
The graph shows comparison of sensing radius in OSR algorithm and Load Optimal Balancing Algorithm .In OSR the sensing radius for covered percentage is larger than 10% but in the Load Optimal Balancing Algorithm sensing radius for covered percentage is higher than 10%.This experiment shows Load Optimal balancing algorithm has larger covered percentage.
Fig 7 Increased percentage with number of sensors
When the number of sensors is more than 100, Load Optimal balancing algorithm gains more increase of coverage percentage than that of OSR. When the number of sensors is 200, the increased percentage of Load Optimal balancing algorithm is 50% higher than that of OSR. Therefore it can make a conclusion that no matter the nodes are dense or sparse the proposed algorithm can achieve more coverage enhancement.
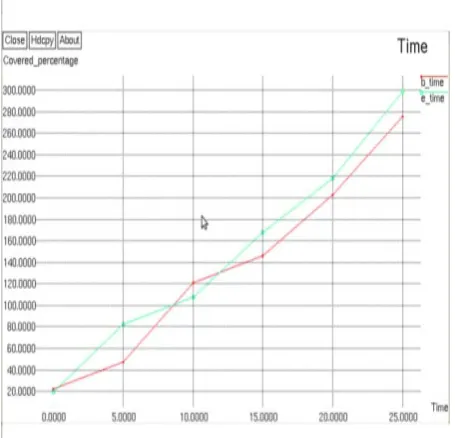
Fig 8 Comparison of convergence rate
VIII.CONCLUSION
In the Wireless multimedia sensor networks, a novel coverage-enhancing algorithm based on bi-dimensional sensing model is proposed to enhance the coverage area. The OSR (Overlap sense area) is presented to quantify the total effect of neighboring sensors. The rotation angle of node is obtained according to the OSR and the rotating direction is determined by the centriod of overlapping region. Furthermore, in order to prolong network lifetime, a modified strategy based on priority is proposed to shut off redundant sensors. To enhance the throughput the load balancing method is proposed in which that the traffic load that must be transmitted to each network link as a function of the available battery level of the nodes. It obtains, as a result throughput and network lifetime values similar to those calculated by the previous analytical planning model. For future work, to maximize the multimedia quality rate control schemes is used that is based on analytical and empirical models of video distortion consists of a new cross-layer control algorithm that jointly regulates the end-to-end data rate, the video quality, and the strength of the channel coding at the physical layer.
REFERENCES
[1] Jian Chen, Lu Zhang, and YounghongKuo, “Coverage Enhancing Algorithm Based on Overlap-Sense Ratio in Wireless Multimedia Sensor Networks”,IEEE SENSORS JOURNAL,vol. 13,no.6,june. 2013.
[2] J. Ai and A. A. Abouzeid, “Coverage by directional sensors in randomly deployed wireless sensor networks,” J. Combinat. Optim. ,
vol. 11, no. 1,pp. 21–41, Feb. 2006.
[3] T. Yan, T. He, and J. A. Stankovic, “Differentiated surveillance for sensor networks,” in Proc. 1st Int. Conf. Embedded Netw . Sensor
Syst., Oct. 2003, pp. 51–62.
[4] D. Tian and N. D. Georganas, “A coverage preserving node scheduling scheme for large wireless sensor networks,” in Proc. 1st ACM Int.
Workshop Wireless Sensor Netw. Appl., Sep. 2002, pp. 32–41.
[5] I. F. Akyildiz, T. Melodia, and K. R. Chowdhury, “Wireless multimedia sensor networks: Applications and testbeds,” IEEE
Proc., vol. 96, no. 10, pp. 1588–1605, Oct. 2008.
[6] J. Wang, C. Niu, and R. Shen, “Priority-based target coverage in directional sensor networks using a genetic algorithm,” Compu.
`Math. Appl., vol. 57, nos. 11–12, pp. 1915–1922, Jun. 2009.
[7] A. Ghosh, “Estimating coverage holes and enhancing coverage in mixed sensor networks,” in Proc. 29th Annu. IEEE Int. Conf. Local
Comput. Netw. Nov. 2004, pp. 68–76.
[8] N. Ahn and S. Park, “An optimization algorithm for the maximum lifetime coverage problems in wireless sensor network,” Int. J.
Manage. Sci., vol. 17, no. 2, pp. 1–24, Nov. 2011.
[9] H. Huang, L. Sun, R. Wang, and J. Li, “A novel coverage enhancement algorithm for image sensor networks,” Int. J. Distrib.
Sens. Netw. vol. 2012, no. 370935, pp. 1–11, Mar. 2012.
[10] N. Tezcan and W. Wang, “Self-orienting wireless multimedia sensor networks for maximizing multimedia coverage,” in Proc. IEEE Int.
Conf. Commun., May 2008, pp. 2206–2210.
[11] E. Yildiz, K. Akkya, E. Sisikoglu, and M. Sir, “An exact algorithm for providing multi-perspective event coverage in wireless multimedia sensor network,” in Proc. Int. Wireless Commun. Mobile
Comput. Conf., Aug. 2011, pp. 382–387.
[12] C. K. Liang, C. H. Tsan, and T. H. Chu, “Coverage enhancing algorithms in directional sensor networks with rotatable sensors,” in
Proc. IEEE Asia-Pacific Services Comput. Conf., Dec. 2011, pp.
377–383.
[13] B. Wang, “Coverage problems in sensor networks: A survey,” ACM