Opportunistic sensing &
Aggregation network
Using Smartphones and Sensor nodes
Author: Dennis Heuven (s1280627)
Master Thesis
Supervisor: Ir J. Scholten
Committee: Ir J. Scholten prof. dr. ing. P.J.M. Havinga ir. O. T¨urkes
Chair: Pervasive Systems Group
8.8.1 Problem analysis . . . 36
8.8.2 Existing solutions . . . 38
8.8.3 The SDSN-Aggregation . . . 42
8.8.4 Aggregation Freshness function . . . 43
9 Implementation 46 9.1 Application . . . 46
9.2 Web server . . . 49
10 Validation 50 10.1 Bluetooth Low energy testing . . . 51
10.2 Smartphone Communication-tests . . . 51
10.3 System test . . . 52
10.4 Aggregation-tests . . . 53
11 Discussion 59 11.1 Privacy of the system . . . 59
11.2 Quality of testing . . . 59
11.3 Feasibility of real use . . . 59
11.4 On the communications and portability . . . 61
12 Conclusion 63
13 Future Work 66
Appendix A: Irregularities 69
Appendix B: Bluetooth Low Energy Implementation details 71
List of Figures
1 Scenario . . . 10
2 Architecture Layering . . . 27
3 The states of the aggregation cycle . . . 31
4 Sequence diagram - Sensor node data retrieval . . . 33
5 Square with aggregation center, optimized for exactness of the location by using min/min . . . 45
6 Square with aggregation center, optimized for minimizing the ac-curacy circle by using an average . . . 45
7 Screenshots of the prototype . . . 48
8 Prototype webserver - Measurements . . . 49
9 Prototype webserver - Nodes . . . 49
10 Prototype webserver - Location map . . . 50
11 System test setup . . . 52
12 System test result . . . 53
13 Optimal trace locations The traces are indicated as red dots . . . 55
14 Location Aggregation deviation from exact location MinMax and Average estimations Average of 200 tests . . . 56
15 Location Aggregation deviation from exact location MinMax ag-gregation Average of 200 tests . . . 57
16 Location estimation, combination of 2 nodes, using 150m com-munication range Deviations are 75m and 5m . . . 57
List of Tables
can only be aggregated with other data of the same time. The external upload should accept old aggregated data.
To make sure the data is valid (and thus useful) it is important that the data is not tampered with thus the message integrity is important.
The sensor data is not confidential as everyone could retrieve the same data of the nodes.
The expected data rate of messages is low as sensor nodes only periodically generate new data and the sharing of sensor data occurs periodically.
The sensor data should be aggregated only with related sensor data of nearby nodes as the data is depended on the location.
Authenticity of messages is not very important during the aggregation however the sources are important during the upload as sensor data of corrupted / com-promised nodes should be ignored.
The availability of the sensor data is important for the aggregation, however it is not always required to upload all aggregated data as other nodes can poten-tially upload the same data as the data is shared with nodes participating in the aggregation.
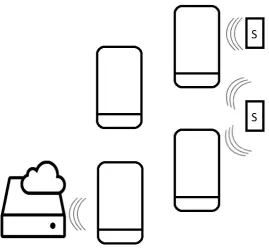
Figure 1: Scenario
1.3
Outline of the thesis
Network” technique of iOS is FireChat. Firechat lets users chat with nearby people, even if there is no phone coverage or internet connection. FireChat has recently been ported to Android [33], thereby directly competing with Cocoon. The FireChat source code (and application) was not available during most of the thesis work so it was not taken into account in the design or prototype. Firechat is available athttps://opengarden.com/firechat, the Google Play Store or the iOS App Store.
Opportunistic sensing with smartphones
The authors of [17] proposed MetroSense, a network architecture for urban-scale people-centric sensing with design goal of broad application and sensor heterogeneity support. MetroSense uses an opportunistic sensor networking approach to scale to large areas. MetroSense has been designed with regularly recharged sensors in mind like cell phones and PDAs.
Opportunistic sensing and opportunistic networking is often associated with human-centric ubiquitous systems, such as in crowd sourcing and participatory sensing applications such as [18, 22, 25, 34] which focus for example on noise pollution, air quality or are focusing on human activity recognition such as [19] in which the authors propose CrowdSense@Place (CSP) which focuses on characterizing places with opportunistic crowdsensing using smartphones. In CSP smartphones collect audio traces which are compared to a set of known traces to determine in what type of environment the user is. Other projects which use opportunistic sensing but not with smartphones are CarTel [23] which focuses on in-car computers which measure the environment, can be queried to retrieve the current status and can optionally share data with other nodes or to the internet using opportunistic wireless connectivity; The authors of [31] proposes to use opportunistic sensing in train safety systems to make a distinction between carriages from different trains.
Testing
3
Environmental sensing
Environmental sensing is the sensing of one’s environment, often using sensor networks. There are several fields of environmental monitoring, such as air quality monitoring, water quality monitoring, soil quality monitoring and so on, each field focusing on measuring and interpreting different environmental parameters. The environmental sensing in this thesis is focused on measuring an urban environment. Some characteristics that can be monitored in an urban environment are, for example, the humidity, temperature, noise (pollution), pressure or radiation of an area.
In environmental sensing it is important to have either very accurate mea-surements or a lot of correlating meamea-surements, depending on the proffered accuracy and the area of interest. Sensor networks typically consist of a lot of resource constrained devices which often have a very limited power supply. Al tough sensor nodes are typically relatively cheap it is not desired to replace the sensor nodes after they have been deployed, thus the lifetime of sensor nodes should be as long as possible.
Environmental sensing is broad term and ”environmental sensing networks” can be disseminated by some parameters:
• Where is the network deployed: Indoors/Outdoors/Oceans/In the air? • What should be measured?
• What is the area of interest?
• What should be done with the data?
The challenges in environmental sensing are often directly related to the field of the monitoring, but there are also some common challenges.The common challenges for environmental sensing can be divided into two major categories: challenges related to the collection of data and the processing (and retrieving useful data) of the collected data. The challenges for retrieving data in the context of sensor nodes is further explained in chapter 6.
The common challenges for the processing of the collected data are: 1. Correlation of data that is collected, in this thesis the challenges related
to the locations of the data.
2. Information interpretation and extraction, what does the data represent and which parts are useful or special.
3. Privacy related challenges, removing the user-details whilst keeping the data useful.
• Semantics
In opportunistic sensing there is a lot of data available but it is not clear what it represents. It is important to make sense of the data in order to use it properly.
5.2
Current Version
The current version of Android is named KitKat. The first version(4.4.0) of KitKat was released in 31 October 2013, and the current version of KitKat (4.4.3) was released on 2 June 2014. Android 4.4 provided major improvements on memory usage, battery usage and overall changes to improve performance.
5.3
Nature of Android
direc-3. The smartphone checks if the reported estimated location is within its communication range (validity check) and if the reported estimation ac-curacy is good enough.
4. When a node is classified as dynamic then the freshness of the location estimation (how long ago was it updated) is also checked to make sure it was recent enough.
5. If the checks fail then the location is estimated by the smartphone, oth-erwise the reported location of the node is used.
par-to them. When acting as a hotspot in this mode the number of clients reduces the chance that it switches to client mode.
Cocoon networks are identified by the name which equals ”Cocoon-” followed by a number from 0 up to 10. In the current version of Cocoon the smartphone will always connect to the network with the highest number available when finding available Cocoon networks.
8
Architecture
As part of the research a prototype should be designed and implemented to demonstrate the feasibility of using smartphones in environmental monitoring in the context of urban-sensing. This chapter describes the design for the pro-totype, which was also implemented. Chapter 9 provides the implementation specific details of the prototype including screenshots of the application.
8.1
Layering
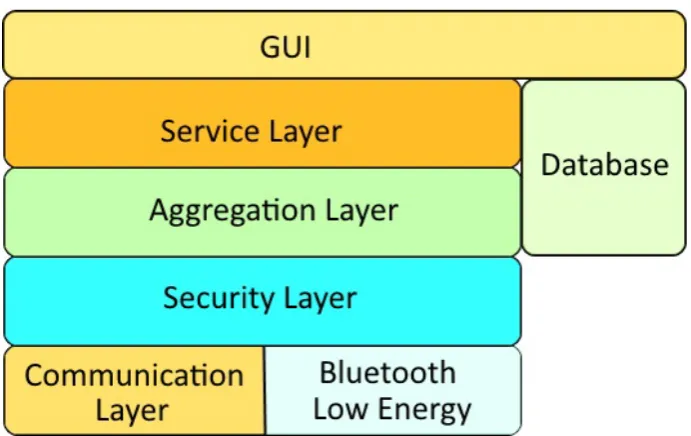
Figure 2: Architecture Layering
The functionality of the architecture is divided into multiple layers which are described in this chapter and is visualized in figure 2.
The first layer is called the”Aggregation layer”, which is responsible for aggre-gating the received sensor data and storing the data.
The second layer is called the ”Security layer”, which is responsible for all se-curity related issues like authentication of
nodes, authenticity of messages and prevention against replay attacks.
The third layer is called the ”Communication layer”, which is responsible for the network and neighbor awareness and transport & integrity of the messages to send.
The fourth layer is the ”Service” layer which is responsible for the collection of data like the node’s location, controlling Bluetooth Low Energy and managing the settings in the system.
The fifth layer is the database, which provides database access for storage of sensor data and querying of stored data.
of the location and the root mean square of the location. For the freshness of the data for the aggregation the freshness function as defined in section 8.8.4 is used.
8.3.1 Aggregation Cycle
To reduce the data set size the aggregation cycle is introduced. The aggrega-tion cycle starts as sensor data is available, initiating the sharing of the sensor data with neighbors for a specified duration. After the sharing of sensor data the aggregation is performed, followed by sharing the aggregation results for a specified duration. After the aggregation result sharing period the node will wait a specified amount of time before being able to start the aggregation cycle again.
Figure 3: The states of the aggregation cycle
The parameters used in the aggregation cycle (as shown in Figure 3) are: • The minimum number of elements required in the aggregation,
• The duration of the ’sharing sensor data’ state, • The duration of the ’sharing aggregation results’ state, • The duration of the ’cool down’ state,
• The number of broadcasts during the ’aggregation sharing’ state, • The number of broadcasts during the ’sensor data sharing’ state.
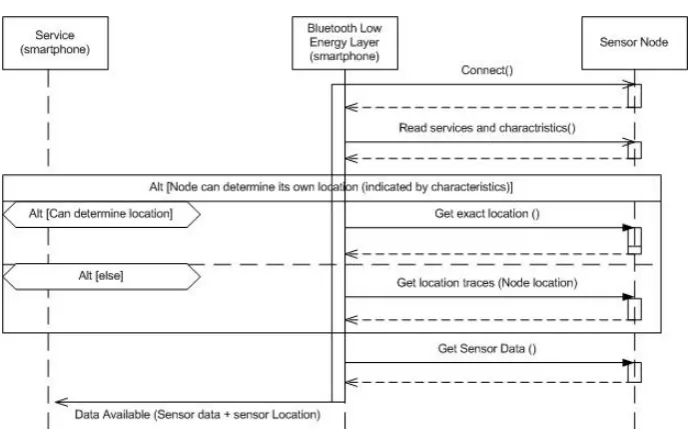
any-Figure 4: Sequence diagram - Sensor node data retrieval
8.7
Smartphone to External server
In order to use the collected informations on smartphones by other parties than the user it is required that the information is send to a server. The information that is uploaded can either be raw sensor data or aggregated data.
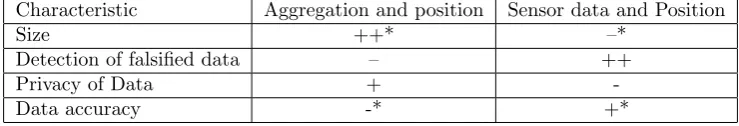
Uploading data, both aggregated and raw data, has some challenges which should be kept in mind:
1. Size: Size of the table to maintain in a node which should be stored for upload. When the size of the data to upload becomes to large then users may complain as smartphones only have a limited data storage which is filled by the application and cannot be used at the same time by other applications. A too small storage size however causes loss of data as it can no longer be stored.
2. Detection of falsified data: How easy is it for the external server to detect falsified data using the history of all uploaded sensor data. Falsified data may have huge implications for the trust in the system as false data makes the system untrustworthy and thus useless for third parties.
3. Privacy of the data: How much privacy-related content does the infor-mation contain? As the results are uploaded to an external server some privacy issues may occur as the information could be used to track the movement of participants. The aggregation will omit some of the privacy-related data like the exact sensors it came in contact with (and on what time), however some traceability will remain.
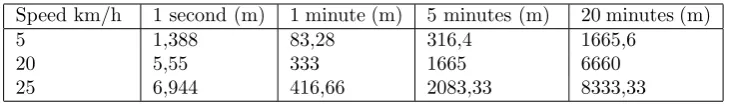
was chosen for this parameter (with a speed of 25km/h a node can traverse 416m in a minute which is 1,2 km in 3 minutes).
• Composite data (unspecified composite type): use the freshness function with the type of the first registered sensor data.
• ’Double’: Tlocation= 10 minutes. Plocation is omitted due to the different
sensor types that use this type for storage in combination with a limited communication range. It is assumed that the data is still relevant in the maximum distance a node can traverse in 10 minutes (4.1 km in 10 minutes with a speed of 25km/h).
Other types can easily be added by formulating the data type and defining relevant values for the parameters.
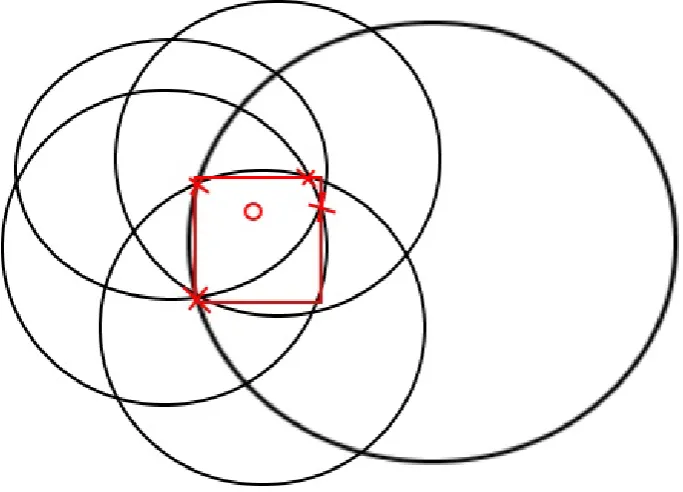
Location aggregation
Android provides locations with a center point and an accuracy factor. The center of a point is in Longitude and Latitude and the accuracy factor of a location is the radius of the center point as one standard deviation (68.2%) in meters. The location of an aggregation is the center point of the sensor locations which where aggregated. If all measured locations overlap then the center location is the center of the common overlapping area. The accuracy takes in account the inaccuracies of the locations by calculating the minimum radius using twice the inaccuracies of the sensors (two standard deviations = 95.4% chance).
To avoid the deviation caused by having a lot of measurements on one side of the node the center is calculated as the average of the min and the max point of locations.
AverageLatitude=Latitude2 min +Latitude2 max2
Averagelongitude=Longitude2 min+Longitude2 max
The solution can either be optimized to give a better location estimate or a smaller accuracy value. To optimize for a better location estimate the average of min+ max of distances is used, thereby minimizing the maximum distance from the center to the crossings. Alternately the optimization for a smaller accuracy value is achieved by using minimizing the average distance from a crossing to the center. The prototype is optimized for a better location estimate as it is expected that the deviation caused by having a lot of measurements on one side of the node might pose a problem.
Figure 5: Square with aggregation center, optimized for exactness of the location by using min/min
on several devices due to manufacturers implementation details on Android’s location services).
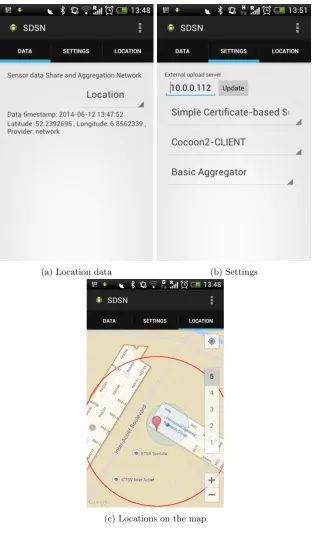
Menu options
(a) Location data (b) Settings
(c) Locations on the map
9.2
Web server
For the upload of the data from the smartphone application a web server is used. This webserver accepts uploading of data from the smartphone, acts as a trusted authority to sign certificates from the security-based security layer and provides a simple representation of the stored data in the form of a web page.
For displaying the data the web server has 3 main elements specialized for the type of data.
The first page is designed to display the measurements in the database. A screenshot of this page is Figure 8.
The second page is designed to display the information on the nodes that are registered at the trusted authority. A screenshot of this page is Figure 9. The third page is designed to visually represent the locations of the stored data using Google maps. The markers displayed have a tool tip with the timestamp of the data in the format of ”YYYY-MM-DD HH:MM:SS”. Figure 10 is a screenshot of this page which displays some location estimates where the more accurate estimations are more opaque. The user can navigate the map and even zoom in and out. In the screenshot the circles indicate the accuracy range of the measurement where a smaller circle indicates a more accurate measurement.
Figure 8: Prototype webserver - Measurements
Figure 10: Prototype webserver - Location map
10
Validation
For simulation purposes the ONE simulator (available athttp://www.netlab. tkk.fi/tutkimus/dtn/theone) [26] version 1.5.1 was used. The Opportunistic Network Environment (ONE) simulator is a simulation environment written in Java used for visualizing mobility and message passing in real-time, generating and emulating node movements and testing various routing algorithms. A few additions and changes were made to the source code to allow GPS locations to be used. Furthermore some load and save mechanics were added for easy testing of aggregation methods.
cation range increases as more nodes are in communication range, creating more sensor data to be aggregated with more (due to the increase in range) nearby nodes. In the simulation the packet loss did not pose much of a problem as long as the aggregation- sensor data sharing period was sufficient enough (typically half a minute in the simulation).
Cocoon has also been tested in the testbed where nodes were able to communi-cate over a range of approximately 100 meters indoors, in this case the network consisted of only 2 nodes (Galaxy s4 mini). The prototype could not use Co-coon on the Moto G devices properly as the hotspot functionality could not always be (reliably) enabled by the application. This appears to be a bug in the firmware and has been listed in this thesis’s list of irregularities in Appendix A: Irregularities.
10.3
System test
After testing the separate components it is desired to test the overall system. This subsection describes the test and its results.
The test uses one Moto G, one S4 mini and one SensorTag. The setup is illustrated in figure 11. The Moto G will communicate with the SensorTag via Bluetooth Low Energy and will share its results to the other smartphone using Cocoon. The Moto G is in Client mode and the S4 mini is in Cocoon-Hotspot mode as the Moto G has issues with acting as hotspot as described in Appendix A: Irregularities. It is expected and observed that the S4 mini will display the temperature sensed by the Sensortag. Figures 12a and 12b are screenshots which display the result of the test. The screenshots are of 2 different measurements though, the Moto G measurement is 2 minutes newer than the one displayed on the S4 mini. The temperature shown on the Moto G is 22,16◦C and the temperature shown on the S4 mini is 21,56◦C.
(a) Moto G (b) S4 mini
Figure 12: System test result
10.4
Aggregation-tests
All aggregation tests were only performed in the simulator due to not having enough devices to reliably provide results.
In the simulator some tests where performed regarding to the aggregation. In these tests the focus was mainly on the aggregation of location data and the effects of the parameters of the freshness function. Recall from section 8.3.1 that the aggregation cycle switches its mode depending on six parameters: Durations of (sharing sensor data, sharing aggregation results, cool down), the number of elements required in the aggregation and the number of broadcasts in the sharing periods. Recall from section 8.8.4 the maximum distance (Ptype) and
the maximum time (Ttype) parameters.
Parameter effects
It was expected that the duration parameters didn’t have much influence on the sensor data available for the aggregation, however during the simulations the effects became apparent. Ttype was set as 5 minutes, and the aggregation
Figure 14: Location Aggregation deviation from exact location MinMax and Average estimations
Average of 200 tests
should be estimated, the black dots are the estimated locations and the pink dots are recorded traces. Figure 16 shows the result of two estimations with a partially overlapping data set, the dotted lines have been added to indicate to which node the estimations belong.
Figure 15: Location Aggregation deviation from exact location MinMax aggregation
Average of 200 tests
Figure 16: Location estimation, combination of 2 nodes, using 150m communi-cation range
(a) 13m deviation
(b) 67m deviation
based techniques. It is not possible to add this technology yet to the system as it is only supported only by Apple products.
in relation to different aspects of communication. The most promising tech-niques for transmitting data between smartphones in environmental monitoring are Bluetooth, Bluetooth Low Energy and WiFi.
In order to demonstrate the usability of smartphones in environmental sens-ing a prototype was designed, implemented and tested in a testbed. Parts of the design have also been tested in a simulator.
The prototype smartphone application was able to:
• Communicate to the sensor node via Bluetooth Low Energy. • Communicate with nearby smartphones via Cocoon.
• Aggregate received sensor data and share the sensor- and aggregated data. • Visualize the aggregated sensor data (in the application).
• Upload the data to the external server.
Furthermore a website was developed to support the upload of data and visu-alizing the uploaded results.
The prototype demonstrated the feasibility of using smartphones in environ-mental sensing as it was able to act as a communication link between sensor nodes and the external server. In addition the smartphones provided additional functionality to the system as they were able to communicate with different nodes which might otherwise not be connected to the network, they add loca-tion awareness to the network as the smartphones can estimate the localoca-tion of the sensor nodes and they provide a limited amount of additional redundancy as multiple different smartphones may communicate with the node instead of a single communication link between two sensor nodes. There are also some downsides such as the price of smartphones and the required participation of a sufficient of users and the unreliable collection of data as a node may have a lot of communications or very few depending on the number of users nearby.
13
Future Work
This section lists some of the possible future work to be performed in order to improve the prototype and the quality of testing.
Larger scale testing
The tests that have been performed were only in a small setting, having only two smartphones which had Bluetooth Low Energy capabilities. It is proposed that larger scale tests are performed with multiple smartphones connected to multiple Bluetooth Low energy devices in order to test the behavior for more realistic scenarios.
More simulations
To improve the quality of testing more simulations should be run, using different simulators and different movement models. This should improve the trust in the performed simulations and indicate (undiscovered) weak points of the system. Furthermore the current simulations did not take night-time into account, in which it is expected that only smartphones are in communication range with the sensor nodes.
Different types of sensors
The prototype currently only supports one type of sensor node which should be expended to cover different types of nodes with different sensor data types.
Real deployment
The prototype should be tested in a real deployment outdoors instead of indoors. The real deployment should also contain more sensors and smartphones which can communicate via Bluetooth Low Energy.
Different operating systems
The prototype is currently only available for Android. By increasing the avail-ability of the application by expanding it to different platforms more people can participate in the network, increasing the coverage of the system.
Newer Cocoon versions
It is also recommend that more tests are run with newer versions of Cocoon as currently only an older experimental version is used. Different versions of Cocoon may have a large impact on the functioning of the system as sharing of the sensor data is strongly dependent on the availability of neighbor nodes.
Acknowledgments
I would like to thank Okan T¨urkes for providing me with an early version of Cocoon and assisting with its usage.
• Not all devices support WiFi-Direct even though the API version supports it (HTC one V). Also some devices have Bluetooth 4.0 but their OS version doesn’t support it yet.
• The web server needs write-rights to the upload directory as it has to store and save the uploaded files.
• Different Android versions sometimes require different functions to be used (for example in using Bluetooth).
• In Android there is a hard limit of 4 unique notification subscriptions for a connection in Bluetooth Low Energy, limiting the number of character-istics which are automatically updated.
• Some Android Hot-Spots will not be enabled or disabled by software, for example in the Moto G devices. Other smartphones may require a SIM-card to be installed in order to enable Hot-Spot mode.
Appendix B: Bluetooth Low Energy
Implemen-tation details
For the communication between the smartphone and the sensor board Bluetooth Low Energy is used. This appendix provides the implementation details on the usage of Bluetooth Low Energy in the prototype. The terminology used here is described in chapters 8.6 and 7.1.
The GATT service contains 2 out of 3 characteristics: SensorData (Manda-tory) and either LocationExact or LocationSet. The sensor data characteristic should be in the same fashion as between smartphones (Chapter 8.4) to ensure simplicity.
To identify GATT services, characteristics and descriptors in Bluetooth and Bluetooth Low Energy universally unique identifiers (UUIDs) are used. The following UUIDs are proposed (but not used in the prototype) for the commu-nication with the sensor node:
• ServiceName [06564499-28ba-3c92-8105-b4452f616c0e] - UUID to identify the GATT-service.
• LocationExact [f257d837-b1fd-3762-a9dd-dbfab9f22eec] - UUID to iden-tify the GATT-characteristic which indicates an exact location.
• LocationSet [a9eee3eb-13e1-3233-961c-7c992f43cd24] - UUID to identify the GATT-characteristic which indicates a set of recorded locations. • SensorData [58a77abd-1586-3139-8d34-07518b720896] - UUID to identify
the GATT-characteristic Sensor data.
The SensorTag is used as sensor node which does not support the use of custom services and characteristics. The result of this is that the services and character-istics of the SensorTag should be used. The relevant services and charactercharacter-istics of the SensorTag are:
• Service Temperature[f000aa00-0451-4000-b000-000000000000] • Service Humidity [f000aa20-0451-4000-b000-000000000000] • Service Barometer [f000aa40-0451-4000-b000-000000000000]
Appendix C: Inter-Layer packet layout
For the communication between the different layers in the prototype message packets are required. Between each layer (communication/security/aggrega-tion) there can be several different packet layouts as long as all nodes use the same inter-layer implementation. The specified packet formats (as used in the prototype) are:
Aggregation layer packet:
Sensor data type [1b] Sensor data [variable]
Security layer packet: Source [15b] Sequence
number [1b]
Aggregation packet length [4b]
Aggregation packet [variable]
Signature of packet [variable]
Communication layer packet: Application
ID [2b]
Message for-mat [1b]
Hop count
[1b]
Security layer packet [variable]
![Table 1: Android Fragmentation [2] Date: 8-1-2014](https://thumb-us.123doks.com/thumbv2/123dok_us/1051519.1131509/17.595.124.352.395.509/table-android-fragmentation-date.webp)
![Table 2: Technology suitability for current Android smartphonesOnly the most suitable methods are shown* depends on rooted/non-rooted** Exact capacity unknown [6]](https://thumb-us.123doks.com/thumbv2/123dok_us/1051519.1131509/24.595.124.551.124.334/technology-suitability-current-android-smartphonesonly-suitable-methods-capacity.webp)