Computational Linguistics and Chinese Language Processing
Vol. 12, No. 3, September 2007, pp. 255-272 255
© The Association for Computational Linguistics and Chinese Language Processing
[Received April 3, 2007; Revised August 9, 2007; Accepted August 12, 2007]
A Novel Characterization of the Alternative Hypothesis
Using Kernel Discriminant Analysis for
LLR-Based Speaker Verification
Yi-Hsiang Chao
∗+, Hsin-Min Wang
∗and Ruei-Chuan Chang
∗+Abstract
In a log-likelihood ratio (LLR)-based speaker verification system, the alternative hypothesis is usually difficult to characterize a priori, since the model should cover the space of all possible impostors. In this paper, we propose a new LLR measure in an attempt to characterize the alternative hypothesis in a more effective and robust way than conventional methods. This LLR measure can be further formulated as a non-linear discriminant classifier and solved by kernel-based techniques, such as the Kernel Fisher Discriminant (KFD) and Support Vector Machine (SVM). The results of experiments on two speaker verification tasks show that the proposed methods outperform classical LLR-based approaches.
Keywords: Kernel Fisher Discriminant, Log-likelihood Ratio, Speaker Verification, Support Vector Machine.
1.
Introduction
In essence, the speaker verification task is a hypothesis testing problem. Given an input utterance U, the goal is to determine whether U was spoken by the hypothesized speaker or not. The log-likelihood ratio (LLR)-based detector [Reynolds 1995] is one of the state-of-the-art approaches for speaker verification. Consider the following hypotheses:
H0: U is from the hypothesized speaker,
H1: U is not from the hypothesized speaker.
The LLR test is expressed as:
∗ Institute of Information Science, Academia Sinica, Taipei, Taiwan
A Novel Characterization of the Alternative Hypothesis Using 263 Kernel Discriminant Analysis for LLR-Based Speaker Verification
5.
Experiments
We evaluate the proposed approaches on two databases: the XM2VTS database [Messer 1999] and the ISCSLP2006 speaker recognition evaluation (ISCSLP2006-SRE) database [Chinese Corpus Consortium 2006].
For the performance evaluation, we adopt the Detection Error Tradeoff (DET) curve [Martin 1997]. In addition, the NIST Detection Cost Function (DCF), which reflects the performance at a single operating point on the DET curve, is also used. The DCF is defined as:
arg (1 arg )
DET Miss Miss T et FalseAlarm FalseAlarm T et
C =C ×P ×P +C ×P × −P , (32)
where PMiss and PFalseAlarm are the miss probability and the false-alarm probability, respectively, CMiss and CFalseAlarm are the respective relative costs of detection errors, and
arg T et
P is the a priori probability of the specific target speaker. A special case of the DCF is known as the Half Total Error Rate (HTER), where CMiss and CFalseAlarm are both equal to 1, and PTarget= 0.5, i.e., HTER (= PMiss+PFalseAlarm) / 2.
5.1
Evaluation on the XM2VTS Database
The first set of speaker verification experiments was conducted on speech data extracted from the XM2VTS database [Messer 1999], which is a multimodal database consisting of face images, video sequences, and speech recordings taken on 295 subjects. The raw database contained approximately 30 hours of digital video recordings, which was then manually annotated. Each subject participated in four recording sessions at approximately one-month intervals, and each recording session consisted of two shots. In a shot, every subject was prompted to read three sentences “0 1 2 3 4 5 6 7 8 9”, “5 0 6 9 2 8 1 3 7 4”, and “Joe took father’s green shoe bench out” at his/her normal pace. The speech was recorded by a microphone clipped to the subject’s shirt.
In accordance with Configuration II of the evaluation protocol described in Luettin [Luettin 1998], the XM2VTS database was divided into three subsets: “Training”, “Evaluation”, and “Test”. In our speaker verification experiments, we used the “Training” subset to build the individual client’s model and the world model1, and the “Evaluation”
subset to estimate the decision threshold θ in Eq. (1) and the parameters w, wF, and b in
1 Currently, we do not have an external resource to train the world model and the background models.
264 Yi-Hsiang Chao et al.
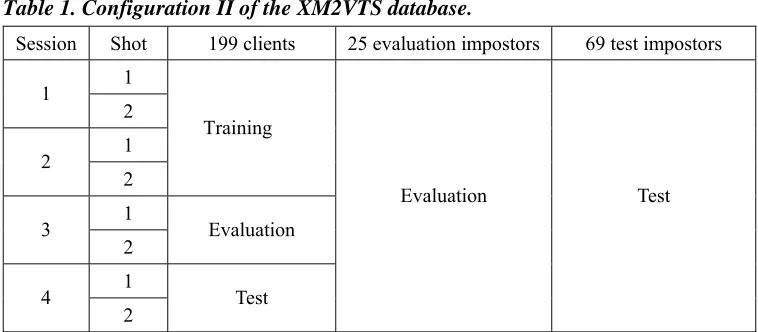
Eq. (11) or Eq. (16). The performance of speaker verification was then evaluated on the “Test” subset. As shown in Table 1, a total of 293 speakers2 in the database were divided into 199
clients, 25 “evaluation impostors”, and 69 “test impostors”.
Table 1. Configuration II of the XM2VTS database.
Session Shot 199 clients 25 evaluation impostors 69 test impostors 1
1
2 1 2
2
Training
1 3
2 Evaluation 1
4
2 Test
Evaluation Test
We used 12 (2×2×3) utterances/speaker from sessions 1 and 2 to train the individual client’s model, represented by a Gaussian Mixture Model (GMM) [Reynolds 1995] with 64 mixture components. For each client, the other 198 clients’ utterances from sessions 1 and 2 were used to generate the world model, represented by a GMM with 256 mixture components; 20 or 40 speakers were chosen from these 198 clients as the cohort. Then, we used 6 utterances/client from session 3, and 24 (4×2×3) utterances/evaluation-impostor over the four sessions, which yielded 1,194 (6×199) client samples and 119,400 (24×25×199) impostor samples, to estimate θ, w, wF , and b. However, as a kernel-based classifier can be intractable when a large number of training samples is involved, we reduced the number of impostor samples from 119,400 to 2,250 using a uniform random selection method. In the performance evaluation, we tested 6 utterances/client in session 4 and 24 utterances/test-impostor over the four sessions, which produced 1,194 (6×199) client trials and 329,544 (24×69×199) impostor trials. Table 2 summarizes all the parametric models used in each system.
Using a 32-ms Hamming-windowed frame with 10-ms shifts, each speech utterance (sampled at 32 kHz) was converted into a stream of 24-order feature vectors, each consisting of 12 Mel-scale frequency cepstral coefficients [Huang 2001] and their first time derivatives.
A Novel Characterization of the Alternative Hypothesis Using 265 Kernel Discriminant Analysis for LLR-Based Speaker Verification
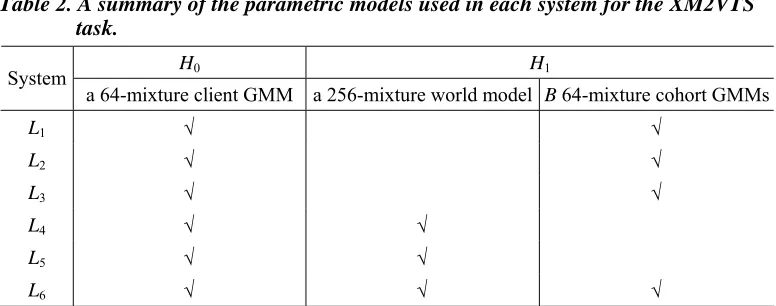
Table 2. A summary of the parametric models used in each system for the XM2VTS task.
H0 H1
System
a 64-mixture client GMM a 256-mixture world model B 64-mixture cohort GMMs
L1 √ √
L2 √ √
L3 √ √
L4 √ √
L5 √ √
L6 √ √ √
5.1.1 Experiment Results
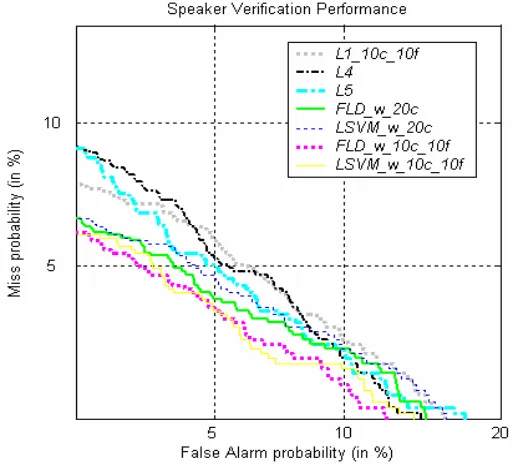
First, B was set to 20 in the experiments. We implemented the proposed LLR system based on linear-based classifiers (FLD and Linear SVM) and kernel-based classifiers (KFD and SVM) in eight ways: 1) FLD with Eq. (30) (“FLD_w_20c”), 2) FLD with Eq. (31) (“FLD_w_10c_10f”), 3) Linear SVM with Eq. (30) (“LSVM_w_20c”), 4) Linear SVM with Eq. (31) (“LSVM_w_10c_10f”), 5) KFD with Eq. (30) (“KFD_w_20c”), 6) KFD with Eq. (31) (“KFD_w_10c_10f”), 7) SVM with Eq. (30) (“SVM_w_20c”), and 8) SVM with Eq. (31) (“SVM_w_10c_10f”). Both SVM and KFD used an RBF kernel function with σ= 5. For performance comparison, we used six systems as our baselines: 1) L1(U) with the 20 closest
cohort models (“L1_20c”), 2) L1(U) with the 10 closest cohort models plus the 10 farthest
cohort models (“L1_10c_10f”), 3) L2(U) with the 20 closest cohort models (“L2_20c”), 4)
L3(U) with the 20 closest cohort models (“L3_20c”), 5) L4(U) (“L4”), and 6) L5(U) using an
RBF kernel function with σ= 10 (“L5”).
266 Yi-Hsiang Chao et al.
Figure 1. Baselines: DET curves for the XM2VTS “Test” subset (B = 20).
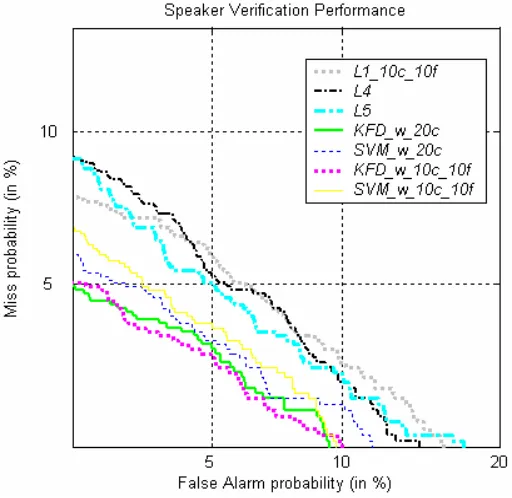
The results of our proposed LLR systems, based on linear-based classifiers and kernel-based classifiers, versus the baseline systems evaluated on the “Test” subset are shown in Figs. 2 and 3, respectively. It is clear that the proposed LLR systems based on either linear-based classifiers or kernel-based classifiers outperform the baseline systems, while KFD perform better than SVM.
A Novel Characterization of the Alternative Hypothesis Using 267 Kernel Discriminant Analysis for LLR-Based Speaker Verification
Figure 3. Best baselines vs. our proposed LLR systems based on kernel-based classifiers: DET curves for the XM2VTS “Test” subset (B = 20).
An analysis of the results based on HTER is given in Table 3. For each approach, the decision threshold, θ or b, was used to minimize HTER on the “Evaluation” subset and then applied to the “Test” subset. From Table 3, we observe that all the proposed LLR systems outperform the baseline systems and, for the “Test” subset, a 29.72% relative improvement was achieved by “KFD_w_20c”, compared to “L5” – the best baseline system. The advantage of integrating multiple background models in our methods could be the reason why the proposed LLR systems based on the linear SVM (“LSVM_w_20c” and “LSVM_w_10c_10f”) outperform “L5”, which applied the kernel-based SVM in L5(U). We also observe that, in the
268 Yi-Hsiang Chao et al.
Table 3. HTERs for the XM2VTS “Evaluation” and “Test” subsets (B = 20).
min HTER for “Evaluation” HTER for “Test”
L1_20c 0.0676 0.0535
L1_10c_10f 0.0589 0.0515 L2_20c 0.0776 0.0635 L3_20c 0.0734 0.0583
L4 0.0633 0.0519
L5 0.0590 0.0508
FLD_w_20c 0.0459 0.0433
LSVM_w_20c 0.0472 0.0495
FLD_w_10c_10f 0.0468 0.0455
LSVM_w_10c_10f 0.0453 0.0434
KFD_w_20c 0.0247 0.0357
SVM_w_20c 0.0320 0.0414
KFD_w_10c_10f 0.0232 0.0389
SVM_w_10c_10f 0.0310 0.0417
Table 4. HTERs for the XM2VTS “Evaluation” and “Test” subsets (B = 40).
min HTER for “Evaluation” HTER for “Test”
L1_40c 0.0675 0.0493
L1_20c_20f 0.0589 0.0506
L2_40c 0.0765 0.0597 L3_40c 0.0722 0.0554
KFD_w_40c 0.0074 0.0345
SVM_w_40c 0.0189 0.0386
KFD_w_20c_20f 0.0050 0.0416
SVM_w_20c_20f 0.0192 0.0403
5.2
Evaluation on the ISCSLP2006-SRE Database
A Novel Characterization of the Alternative Hypothesis Using 269 Kernel Discriminant Analysis for LLR-Based Speaker Verification
clients to imposters is approximately 1:20. The answer sheet was released after the evaluation finished.
To form the “Evaluation” subset for estimating θ, w, wF, and b, we extracted some speech from each client’s training utterance in the following way. First, we sorted the 800 clients in descending order according to the length of their training utterances. Then, for the first 100 clients, we cut two 4-second segments from the end of each client’s training utterance; however, for the remaining 700 clients, we only cut one 4-second segment from the end of each client’s training utterance. This yielded 900 (2×100+700) “Evaluation” utterances. In estimating θ, w, wF , and b, each “Evaluation” utterance served as a client sample for its associated client, but acted as an imposter sample for each of the remaining 799 clients. This yielded 900 client samples and 719,100 (900×799) impostor samples. We used all the client samples and 2,400 randomly-selected impostor samples to estimate wF of the kernel-based classifiers. To determine θ or b, we used the 900 client samples and 18,000 randomly-selected impostor samples. This follows the suggestion in the ISCSLP2006-SRE Plan that the ratio of true clients to imposters in the “Test” subset should be approximately 1:20.
The remaining portion of each client’s training utterance was used as “Training” to train that client’s model through UBM-MAP adaptation [Reynolds 2000]. This was done by first pooling all the speech in “Training” to train a UBM [Reynolds 2000] with 1,024 mixture Gaussian components, and then adapting the mean vectors of the UBM to each client’s GMM according to his/her “Training” utterance.
The signal processing front-end was same as that applied in the XM2VTS task.
5.2.1 Experiment Results
The GMM-UBM [Reynolds 2000] system is the current state-of-the-art approach for the text-independent speaker verification task. Thus, in this part, we focus on the performance improvements of our methods over the baseline GMM-UBM system.
As with the GMM-UBM system, we used the fast scoring method [Reynolds 2000] for likelihood ratio computation in the proposed methods. Both the client model λ and the B cohort models were adapted from the UBM Ω. Since the mixture indices were retained after UBM-MAP adaptation, each element of the characteristic vector x was computed approximately by only considering the C mixture components corresponding to the top C scoring mixtures in the UBM [Reynolds 2000]. In our experiments, the value of C was set to 5.
270 Yi-Hsiang Chao et al.
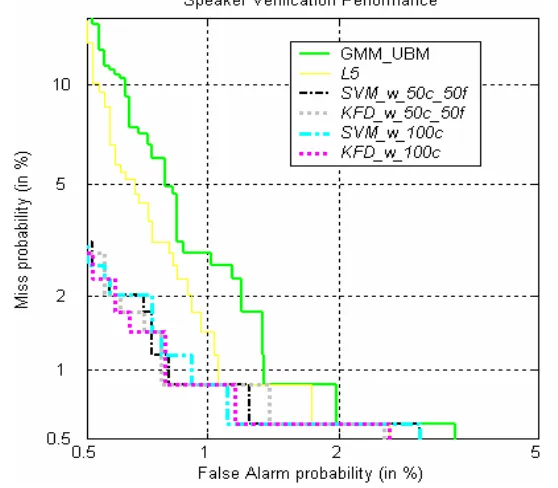
compared the proposed systems with the baseline GMM-UBM system and Bengio et al.’s system (L5). Figure 4 shows the results of experiments conducted on 5,933 “Test” utterances in DET curves. The proposed LLR systems clearly outperform the baseline GMM-UBM system and Bengio et al.’s system (L5). According to the ISCSLP2006 SRE plan, the performance is measured by the NIST DCF with CMiss =10 , CFalseAlarm=1, and
arg 0.05 T et
P = . In each system, the decision threshold, θ or b, was selected to minimize the DCF on the “Evaluation” subset, and then applied to the “Test” subset. The minimum DCFs for the “Evaluation” subset and the associated DCFs for the “Test” subset are given in Table 5. We observe that “KFD_w_50c_50f” achieved a 34.08% relative improvement over “GMM-UBM”, and a 19.73% relative improvement over “L5”.
Figure 4. DET curves for the ISCSLP2006-SRE “Test” subset.
Table 5. DCFs for the ISCSLP2006-SRE “Evaluation” and “Test” subsets.
min DCF for “Evaluation” DCF for “Test”
GMM-UBM 0.0129 0.0179
L5 0.0120 0.0147
KFD_w_50c_50f 0.0067 0.0118
SVM_w_50c_50f 0.0067 0.0123
KFD_w_100c 0.0063 0.0145
A Novel Characterization of the Alternative Hypothesis Using 271 Kernel Discriminant Analysis for LLR-Based Speaker Verification
6.
Conclusions
We have presented a new LLR measure for speaker verification that improves the characterization of the alternative hypothesis by integrating multiple background models in a more effective and robust way than conventional methods. This new LLR measure is formulated as a non-linear classification problem and solved by using kernel-based classifiers, namely, the Kernel Fisher Discriminant and Support Vector Machine, to optimally separate the LLR samples of the null hypothesis from those of the alternative hypothesis. Experiments, in which the proposed methods were applied to two speaker verification tasks, showed notable improvements in performance over classical LLR-based approaches. Finally, it is worth noting that the proposed methods can be applied to other types of data and hypothesis testing problems.
References
Bengio, S. and J. Mariéthoz, “Learning the Decision Function for Speaker Verification,” In Proceedings of the IEEE International Conference on Acoustic, Speech, and Signal Processing, 2001, Salt Lake City, USA, pp. 425-428.
Burges, C., “A Tutorial on Support Vector Machines for Pattern Recognition,” Data Mining and Knowledge Discovery, 2, 1998, pp. 121-167.
Chinese Corpus Consortium (CCC), “Evaluation Plan for ISCSLP’2006 Special Session on Speaker Recognition,” 2006.
Duda, R. O., P. E. Hart and D. G. Stork, Pattern Classification, 2nd ed., John Wiley & Sons,
New York, 2001.
Huang, X., A. Acero and H. W. Hon, Spoken Language Processing, Prentics Hall, New Jersey, 2001.
Liu, C. S., H. C. Wang and C. H. Lee, “Speaker Verification Using Normalized Log-Likelihood Score,” IEEE Trans. Speech and Audio Processing, 4, 1996, pp.56-60. Luettin, J. and G. Maitre, “Evaluation Protocol for the Extended M2VTS Database
(XM2VTSDB),” IDIAP-COM 98-05, IDIAP, 1998.
Martin, A., G. Doddington, T. Kamm, M. Ordowski and M. Przybocki, “The DET Curve in Assessment of Detection Task Performance,” In Proceedings of Eurospeech, 1997, pp. 1895-1898.
Messer, K., J. Matas, J. Kittler, J. Luettin, and G. Maitre, “XM2VTSDB: The Extended M2VTS Database,” In Proceedings of the 2nd
International Conference on Audio and Video-based Biometric Person Authentication, 1999, Washington D. C., USA, pp. 72-77.
272 Yi-Hsiang Chao et al.
Reynolds, D. A., “Speaker Identification and Verification Using Gaussian Mixture Speaker Models,” Speech Communication, 17, 1995, pp. 91-108.
Reynolds, D. A., T. F. Quatieri and R. B. Dunn, “Speaker Verification Using Adapted Gaussian Mixture Models,” Digital Signal Processing, 10, 2000, pp. 19-41.
Rosenberg, A. E., J. Delong, C. H. Lee, B. H. Juang and F. K. Soong, “The Use of Cohort Normalized Scores for Speaker Verification,” In Proceedings of International Conference on Spoken Language Processing, 1992, Banff, Canada, pp. 599-602.