CSEIT183345 | Received : 01 May 2018 | Accepted : 07 May 2018 | May-June-2018 [ (3)5 : 34-40 ]
© 2018 IJSRCSEIT | Volume 3 | Issue 5 | ISSN : 2456-3307
Comparison of Data Mining Classification Method for Predicting
Crop Water Requirement
Navtej Bhatt*1, Dr. P. V. Virparia2
*1MCA Department, Smt. V.B.Nandola MCA College, Bhacha, Gujarat, India
2 G.H.Patel Department of Computer Science, Sardar Patel University, Vallabh Vidyanagar, Gujarat, India
ABSTRACT
In this paper, we have compared different data mining classification algorithm. Out of many decision tree algorithm, we have selected J48, DecisionStump, RAPTree and RandomTree. All the information we have collected from our study area are first preprocessed and it is converted into ARFF file. We have used open source tool Weka for comparison and presented the result. Based on the result, we have concluded that RandomTree gives best performance on our Data.
Keywords: Data Mining, Decision Tree, Crop Water Requirement
I.
INTRODUCTION
Efficiency of the crop water requirement is based on the estimation methodology. Several methods are available for estimating crop water requirement like soil moisture measurement, personal calendar scheduling, and plant moisture sensing, manual assessment of soil and evotraspiration records. The problem with all the methods is, all are indirect and some assumptions need to be measured.
Accurate estimation of crop water is basic requirement to increase crop productivity. For better management of limited agriculture water it is required to understand the crop water requirement. Due to unscientific methods to calculate crop water requirement wastage or scarcity occurred in canal irrigation. Therefore, proper allocation of irrigation water for the crop with minimum loss of water is required. Efficient water management is signified by an appropriate awareness of not only the relationship between crop yield and water applied to the soil but also the mechanism for applying water in accordance with this knowledge.
The best irrigation management practice is to maintain the water level so that the crop yield and quality will not be down due to either insufficient or excess water. However, direct measurement of soil water in the field is tedious and usually requires specialized equipment.
Many water balance approaches have been used to estimate crop water availability and irrigation requirements. In order to improve water management and maximize crop productivity through efficient water allocation data mining techniques are very useful. Data mining is capable of extracting and interpreting the hidden patterns from a large amount of hydrological data. Knowledge discovery can be done from large dataset through the data mining.
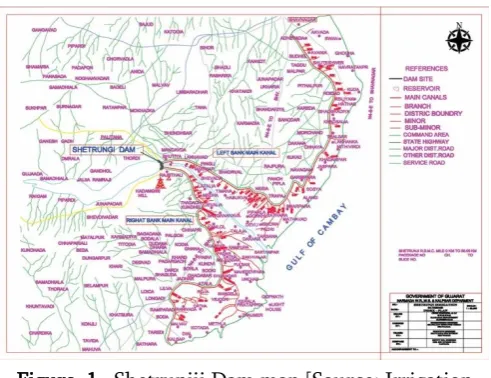
prediction against the actual crop water requirement statements obtained from the various Irrigation Offices. scheme situated on river Shetrunjii near village Nani Rajasthali of Palitana Taluka of Bhavnagar District. Total catchment area of reservoir is 4317 Sq. Km.
Figure 1. Shetrunjii Dam map [Source: Irrigation Office, Talaja]
The shetrunji irrigation scheme has two main canals as show in Figure 1. Out of which, one is shetrunjii right bank canal having length of 60 km and irrigated area is 20102.52 Ha. The shetrunji left bank canal is 96 km long and irrigation area 14700.59Ha.
III.
DATA AND METHOD DESCRIPTION
A. Data Collection and Processing
We have collected data from the irrigation Office, Bhavnagar. All the data were maintained in predefined format of Microsoft Excel Worksheet given by the government. Irrigation Office maintains the data like Crop information, Past Rainfall, Fortnightly values of Reference Evapotranspiration (ETo) and Crop Coefficient (Kc), Water availability for irrigation and water delivery statements.
First, we have prepared the dataset exactly as per the sheet provided by the government to analyse the exact method for calculating crop water requirement. As per that format crop water requirement is estimated by calculating the Crop Evapotranspiration (ETc). The standard formula to calculate ETc is ETc=Kc (Crop coefficient) * ETo (Reference evapotranspiration) define in FAO56. Irrigation Office has provided the fixed values of reference Evapotranspiration (ETo) and Crop Coefficient (Kc) values.
Crop water requirement is calculated on fortnightly bases. Based on the crop sowing and harvesting period, Evapotranspiration (ETo) and crop coefficient (Kc) values the crop water requirement (CWR) is computed. To calculate the net irrigation requirement, effective rain fall will be calculated and deducted from the CWR.
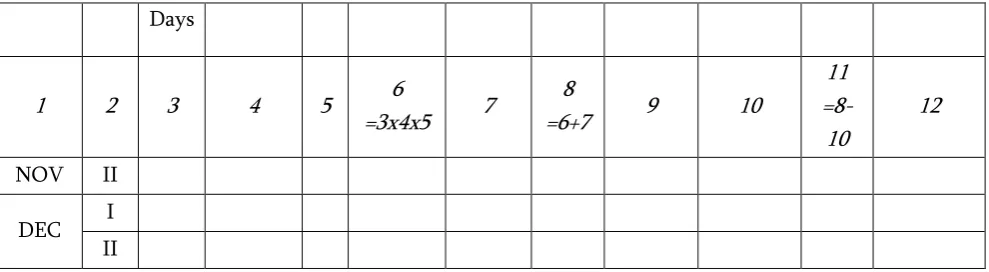
Table 1 shows the format that is used by an irrigation Office to calculate CWR.
Table 1. Calculation Of Cwr
Name of Crop : Wheat Growth Period: 15-Nov To 10-Mar (Duration
Days
1 2 3 4 5 6
=3x4x5 7
8
=6+7 9 10
11 =8-10
12
NOV II
DEC I
II
Low irrigation efficiency observed at Shetrunjii Irrigation system is due to flooded wild irrigation practice in command area and deep percolation loss below the root zone of the crops due to the soil characteristics. The irrigation system passes through mainly murrum areas that have high coefficient of permeability. At present, the irrigation efficiency is envisaged to be around 48% where as for the future the efficiency need to be increased 55% to cater the irrigation water requirements for the present and proposed cropping pattern. The discharge requirement calculation performed here after is based on the revised cropping pattern and anticipated improved efficiencies of the canal carrying capacities. Due to this factor, Shetrunjii Irrigation Scheme requires new measures for water use efficiency and increase water productivity.
Our critical task was to choose the parameters that directly affect the requirement of water to the crops. As we are going to build a model for future purpose, we cannot choose the information in our model that will be difficult to collect.
So, we have created the training dataset based on the information that can be available or calculated easily. Our training dataset contains historical data such as Crop, Season, Starting date of fortnight period, no of days water is required, end date, irrigation cut period, ETo, Kc, ETc and Past Rainfall which is actually average rainfall of last 10 year. Based on these attributes range of net crop water (NIR) requirement will be calculated (see Table 2). Attribute Range in Table 2 is termed as the “class” attribute and all others as “non-class” attributes.
Table 2. Calculation of CWR
Non-Class Attributes Class
Attributes
Crop Season St_Dt Days En_Dts IsCut ETo Kc ETc
Rainfall (mm)
Range (ML/ha/day) Bajra Kharif 16-Sep 15 30-Sep No 5.5 0.94 77.55 87 2.01-4.00 GroundNut Kharif 01-Oct 13 13-Oct Yes 5.7 0.63 46.68 31 0.00-0.00
Wheat Rabi 01-Feb 14 14-Feb No 5.2 1.17 85.18 0 6.01-8.00
Cotton T.S. 01-Jul 15 15-Jul No 5.4 0.23 18.63 131 0.00-0.00
Sugarcane Peren 16-Nov 15 15-Nov No 4.3 0.55 35.48 0 2.01-4.00
Banana Peren 01-May 15 15-May No 9.0 0.9 121.50 8 8.01-10.00
The data which we have received provide information like the date and the water delivered to the farmer. As the water is delivered fortnightly, it will take a water and use till the next delivery of
Finally we have divide the water delivered for a particular fortnight period with the total number of days to get an average water usage. Every crop has the fixed number of growing period in days. Last few days (varied from crop to crop) considered as an irrigation cut period on which there is no requirement to deliver water as the crop will be in harvesting period. Based on all this condition we have finally prepared the dataset and converted it into Attribute Relation File Format (ARFF) shown below:
@relation cropTrain
@attribute CropName {Jowar, Bajra, Maize, Paddy, Gnut_S, Gnut_E, SunFlower, Pulses, Soyabean, Vegetables, Wheat, Potatoes, Onion, OilSeeds, Maize-F, Gnut, Sesame, Melon, Cotton, Castor, SugarCane, Banana}
@attribute Season {Kharif, Rabi, HotWeather, TwoSeasonal, Perennials}
@attribute St_Dt date "dd-MMM" @attribute Days numeric
@attribute En_Dt date "dd-MMM" @attribute IsCut {Yes,No}
@attribute ETo real @attribute Kc real @attribute ETc real @attribute Rainfall real
@attribute Range {0.00-0.00, 0.01-2.00, 2.01-4.00, 4.01-6.00, 6.01-8.00, 8.01-10.00, 10.01-12.00}
@data
Jowar,Kharif,01-Jul,15,15-Jul,No,5.4,0.21,17.01,131,2.01-4.00
Jowar,Kharif,16-Jul,16,31-Jul,No,5,0.39,31.20,125,0.00-0.00
Jowar,Kharif,01-Aug,15,15-Aug,No,4.9,0.78,57.33,146,0.01-2.00
Jowar,Kharif,16-Aug,16,31-Aug,No,5.1,1.01,82.42,90,2.01-4.00
Jowar,Kharif,01-Sep,15,15-Sep,No,5.3,1.03,81.89,68,4.01-6.00
Jowar,Kharif,16-Sep,15,30-Sep,No,5.5,0.91,75.08,87,2.01-4.00
Jowar,Kharif,01-Oct,13,13-Oct,Yes,5.7,0.67,49.65,31,0.00-0.00
Bajra,Kharif,01-Jul,15,15-Jul,No,5.4,0.28,22.68,131,4.01-6.00
Bajra,Kharif,16-Jul,16,31-Jul,No,5,0.43,34.40,125,0.01-2.00
Bajra,Kharif,01-Aug,15,15-Aug,No,4.9,0.83,61.01,146,0.01-2.00
The formula for calculating the crop water usage is: Etc will be calculated by multiplying no. of days of fortnight period, ETo value during that fortnight period and Kc value of crop during the same time. If any rainfall is there, it will be deducted from the Etc value and based on that the range of water delivered for the crop on daily basis.
B. Experiment and Result
A decision tree learns the hidden relationships between the class and non-class attributes from a training dataset and applies the learned knowledge on a testing dataset. A class contains the possible labels of a record. A decision tree analyses a set of records whose class values are known.
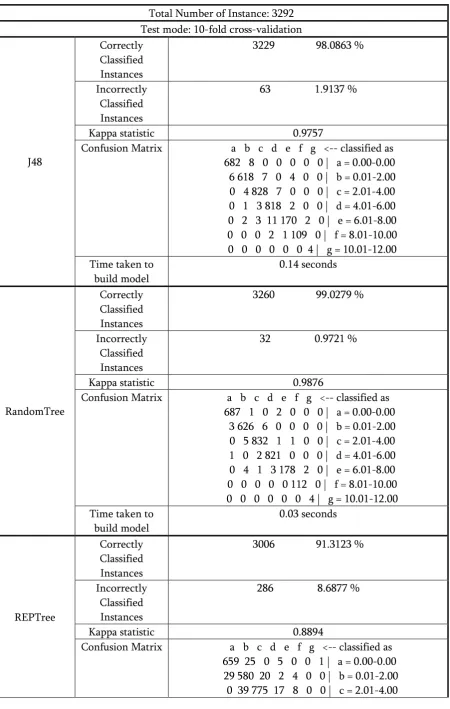
Table 3.. Comparative Analysis Of Algorithm
Total Number of Instance: 3292 Test mode: 10-fold cross-validation
J48
Correctly Classified Instances
3229 98.0863 %
Incorrectly Classified Instances
63 1.9137 %
Kappa statistic 0.9757
Confusion Matrix a b c d e f g <-- classified as 682 8 0 0 0 0 0 | a = 0.00-0.00 6 618 7 0 4 0 0 | b = 0.01-2.00 0 4 828 7 0 0 0 | c = 2.01-4.00 0 1 3 818 2 0 0 | d = 4.01-6.00 0 2 3 11 170 2 0 | e = 6.01-8.00 0 0 0 2 1 109 0 | f = 8.01-10.00 0 0 0 0 0 0 4 | g = 10.01-12.00 Time taken to
build model
0.14 seconds
RandomTree
Correctly Classified Instances
3260 99.0279 %
Incorrectly Classified Instances
32 0.9721 %
Kappa statistic 0.9876
Confusion Matrix a b c d e f g <-- classified as 687 1 0 2 0 0 0 | a = 0.00-0.00 3 626 6 0 0 0 0 | b = 0.01-2.00 0 5 832 1 1 0 0 | c = 2.01-4.00 1 0 2 821 0 0 0 | d = 4.01-6.00 0 4 1 3 178 2 0 | e = 6.01-8.00 0 0 0 0 0 112 0 | f = 8.01-10.00 0 0 0 0 0 0 4 | g = 10.01-12.00 Time taken to
build model
0.03 seconds
REPTree
Correctly Classified Instances
3006 91.3123 %
Incorrectly Classified Instances
286 8.6877 %
Kappa statistic 0.8894
3 4 56 752 8 1 0 | d = 4.01-6.00 0 17 5 26 138 2 0 | e = 6.01-8.00 0 2 0 4 6 100 0 | f = 8.01-10.00 0 0 0 2 0 0 2 | g = 10.01-12.00 Time taken to
build model
0.06 seconds
DecisionStump
Correctly Classified Instances
1333 40.4921 %
Incorrectly Classified Instances
1959 59.5079 %
Kappa statistic 0.2317
Confusion Matrix a b c d e f g <-- classified as 667 0 0 23 0 0 0 | a = 0.00-0.00 566 0 0 69 0 0 0 | b = 0.01-2.00 531 0 0 308 0 0 0 | c = 2.01-4.00 158 0 0 666 0 0 0 | d = 4.01-6.00 81 0 0 107 0 0 0 | e = 6.01-8.00 6 0 0 106 0 0 0 | f = 8.01-10.00 0 0 0 4 0 0 0 | g = 10.01-12.00 Time taken to
build model
0.02 seconds
We have also tested the dataset with all algorithm using PairedCorrectedTester experiment. Following result shows the comparative experiment for all algorithm.
Tester:
weka.experiment.PairedCorrectedTTester Analysing: Percent_correct
Datasets: 1 Resultsets: 4
Confidence: 0.05 (two tailed) Sorted by: -
Date: 28/2/18 4:49 PM
Dataset (1) trees.De | (2) trees (3) trees (4) trees
---
cropTrain (100) 40.62 | 98.00 v 99.09 v 91.15 v
---
(v/ /*) | (1/0/0) (1/0/0) (1/0/0)
Key:
(1) trees.DecisionStump '' 1618384535950391 (2) trees.J48 '-C 0.25 -M 2' -217733168393644444 (3) trees.RandomTree 'K 0 M 1.0 V 0.001 S 1' -9051119597407396024
(4) trees.REPTree '-M 2 -V 0.001 -N 3 -S 1 -L -1 -I 0.0' -
9216785998198681299
IV.
CONCLUSIONV.
REFERENCES
[1].FAO56, FAO Irrigation and Drainage Paper, https://www.kimberly.uidaho.edu/water/fao56/fa o56.pdfaccessed on 020/2/2018.
[2].IWMI (2009): Water for a food secure world. International Water management Institute (IWMI) Strategic Plan 2009-2013.
[3].Khan, M., Islam, M. Z., Hafeez, M., “Irrigation Water Demand Forecasting-A Data Pre-Processing and Data Mining Approach based on Spatio-Temporal Data”, In Proceedings of 9th Australasian Data Mining Conference (AusDm11). Ballarat, Australia. , CRPIT, 121, pp. 183-194, 2011.
[4].Khan, M., Islam, M. Z., Hafeez, M. (2012): Evaluating the Performance of Several Data Mining Methods for Predicting Irrigation Water Requirement, In Proceedings of the Tenth Australasian Data Mining Conference (AusDM 2012), Sydney, Australia. Dec 5-7, CRIPT, 134, 199-207
[5].Bhatt, N., Virparia, P. (2014): A Decision Support model for better Crop Productivity through Irrigation Water in Saurashtra Region, International Journal on Recent and Innovation Trends in Computing and Communication, 2(3): 545-548
[6].Undavia, J., Dolia P., Patel A. (2014): Comparison of Classification Algorithms to Predict Comparison of Decision Tree Classification Algorithm to Predict Student's Post Graduation Degree in Weka Environment, International Journal of Innovative and Emerging Research in Engineering, ISSN:2394-5394, Vol-1, Issue-2, pp:17-22