Vulnerability Assessment of Soils and Groundwater Resources To
Surface Induced Contamination Using Goeelectrical Methods.
Nebo, C. U1 . Udom, G. J2 and Ehirim C.N3
1.Institute of Natural Resources, Environment and Sustainable Development, University of Port Harcourt, Nigeria.
2. Department of Geology, University of Port Harcourt, Rivers State, Nigeria. 3. Department of Physics, University of Port Harcourt, Rivers State, Nigeria ABSTRACT
This study entails the vulnerability assessment of soils and groundwater resources to surface induced contamination by solid wastes from a dumpsite in Port Harcourt Metropolis, Rivers State. The objective is to evaluate soil protective capacities on the groundwater system of the area using the Dar-Zarrouk parameters.Vertical Electrical Sounding (VES) and 2-D Electrical Resistivity Tomography (ERT) were integrated in the study. A total of four (VES) and two (ERT) were occupied with the use of the Schlumberger and Wenner electrode configurations respectively for subsurface characterization. Results of the VES reveal the lithology to be mainly of lateritic sand to sands of varying grain sizes and thicknesses. The VES show 4 to 5 geo-electric layers with different type curves. Leachate plume were delineated in the 2ndlayers of VES 1, 2,3 and
4 and 3rd layers of VES 1and 3 with resistivities range of (24.83–85.66) Ωm and depth range of (4.58–20.07) m. The 2-D resistivity tomography identified contaminants within and around the dumpsite. Contaminant leachate plume with low resistivities between (3.7and 98.8)Ωm occur at the surface points (0.469m) and depths of over 16m, in the entire area. The
transmissivity of the aquifer varies from 5.84x10²Ωm2 to 8.40x 10³Ωm2 while the protective capacity of the overburden layers ranged from 9.98 x 10⁻²to 1.56 x 10
-1Siemens. The high transmissivities and the
low values of protective capacity will make the aquifers highly vulnerable to seepage and migration of contaminants. These findings imply that the soil and groundwater resources have been contaminated and highly vulnerable to surface induced contamination in the study area.
Keywords: Contamination, Protective
Capacity, Dar-Zarrouk parameters,
Overburden soil, Vulnerability.
INTRODUCTION
Groundwater is an indispensable resource that serves as one of the source of potable water and is utilized for agricultural, domestic and industrial purposes. This resource has been under threat due to pollution (Ehirim and Ofor 2011).
generated as the end product of human activities and may be solid, liquid or gaseous. Port Harcourt like all growing cities of the world has witnessed rapid population growth and their attendant waste generation hence solid wastes at dumpsite are common in the area.
These dumpsites lack any engineering specification and therefore the quality and safety of soil and groundwater resources in the area are not guaranteed. The protection and preservation of these resources is of paramount interest due to the fact that these open dumps are sited indiscriminately without regard to the nature of the soil, hydrology and closeness to living quarters. Poor management of waste has become an issue that has generated a lot of environmental concerns with regards to the availability of potable water supply.
Groundwater pollution is mainly due to the process of industrialization and urbanization that has progressively developed over time without any regard for environmental consequences (Balogun 2010). Leachates generation in dumpsite and the release of pollutants from sediments (under certain conditions) pose a high risk to the groundwater resources if not adequately managed (Ikem etal. 2002). In recent times, the impact of leachate on groundwater and other water resources has attracted a lot of attention because of its overwhelming environmental significance (Akinbile, 2012).
Leachate is produced in dumpsites as rainwater percolates through the solid waste
and transported down to the groundwater system. Leachates contain ions that are highly conductive and usually have sufficient high contrast in physical properties against the surrounding media due to the increased dissolved salts in the groundwater and the resulting decrease in pore water resistivity. Hence, the employment of electrical resistivity techniques in the detection of the leachate
contamination has become
popular.(Bernstone and Dahlin 1999)
Electrical resistivity geophysical method has
been widely used for groundwater
contamination studies by various workers such as Abiola et al(2009): Ehirim and Nwankwo (2010); Ehirim and Ofor,(2011); and Oborie and Udom. (2014).The vertical electrical sounding (VES)and the electrical resistivity tomography( ERT) imaging are useful techniques employed due to their various capabilities.VES gives information concerning the vertical distribution of subsurface electrical properties which makes them relevant in the determination of hydrological conditions such as depths to bedrocks, depth to water table and thickness of soil layers (Zohdy, 1964: Rosqvist et al,,
The aim of this study is to assess the vulnerability of soil and groundwater resources to surface induced contamination with the objective to evaluate aquifer characteristics in terms of Dar- Zarrouk parameters for the characterization of the aquifer and overburden layers.
STUDY AREA DESCRIPTION
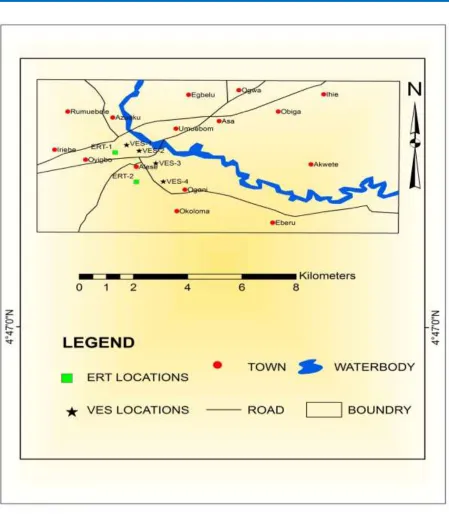
The study area is centered aroundthe dumpsite in Oyigbo,in Oyigbo Local Government Area (LGA) of Rivers State, Nigeria.It is delineated by latitude N04o 52’ 35.8’’ and longitude E007o 09’ 19.9’’ (Fig 1).The dumpsite is one of the oldest
dumpsites in Oyigbo Community,
characterized by domestic and industrial waste arising from various economic activities in the area. Oyigbo lies within the Niger Delta Sedimentary Basin which has the Benin Formation as its youngest lithostratigraphic unit (Short and Stauble, 1967). The Benin Formation consists of unconsolidated highly porous and permeable freshwater bearing continental sands and gravels with occasional shale intercalations (Reyment 1965). The Formation is the main aquiferous layer which acts as the source of potable water supply in the study area. The study area is characterized by dry and wet season with the wet season having a peak in July. Annual rainfall is about 240cmwith an average temperature of 25oC (Iloeje. 1992). The topography is generally flat with thick vegetation, typical of the tropical rain forest.
The groundwater flow direction is in the NW-SE toward the coast in line with the regional trend in the Niger Delta. (Ehirim and Ebeniro, 2006).
METHODOLOGY
3.1 VES Data Acquisition
The ABEM Terrameter (SAS) Signal
Averaging System (300C) and its
accessories were utilized for the VES surveys in the study area. A total of four (4) vertical electrical sounding using the Schlumberger Electrode Configuration were employed in this survey. This was conducted for the determination of the depth of aquifer contamination, evaluation of the aquifer properties such as resistivity, depths, thickness ,transmissivity and the protective capacity of the over burden soil materials.
1 2 2 2 2 V MN MN AB pa
………… (1)
MN MN AB k 2 2 2 2
Where K: the geoelectric factor
∆V/ I = R = Field Resistance
In evaluation of aquifer properties such as transmissivity and protective capacity of the overburden materials, the combination of the thickness and resistivity of the geoelectric layers were used to determine the Dar-Zarrouk parameters of Transverse Resistance (R)and Longitudinal Conductance (S).
The longitudinal conductance (Sl) was calculated using equation (2)
Sl = Σ (hi/ρi) = hi/ρi+ h2/ρ2 +...+ hn/ρn……….(2)
whereSl = Longitudinal Conductance
hi = thickness of the ith layer
ρ
i = resistivity of the ith layerThe transverse resistance (R) for the aquifer is calculated from Equation 3.
R = Σρi Xhi………. (3)
Where hi = thickness of the ith layer in m
ρi = resistivity of the ith layer in Ohm m
(Kelly, 1977; Mbonu et al, 1991). In a condition where there is no pump test data, the aquifer hydraulic conductivity K can be equated to the true resistivity of the aquifer that is derived from the geoelectric data. Based on the above,
T = kh=𝜌h
(4)
It should be noted that the transverse resistance (R) in eqn. (3) is numerically equal to the Transmissivity T (Ward, 1990).
T = R
(5)
3.2 2D Data Acquisition
The 2-D electrical resistivity tomography was engaged also using the digital ABEM Terrameter. Two (2) profile lines (A-B)parallel to each other were carried out using the Wenner electrode configuration.Profile lines of 100m each were occupied with electrode spacing (a) increasing from 5m to a maximum of 30m.The apparent resistivity was calculated by multiplying themeasured field resistance (R) and the geoelectric factor (K) using equation 6
ρ
a =2𝜋aR (6)Where AM = MN = NB = a
a: electrode spacing
R = field resistance, and
K = 2𝜋a (7)
The calculated apparent resistivity values were recorded and inputed using the RES2DINV computer programme (Loke, 2004).
PRESENTATION OF RESULTS.
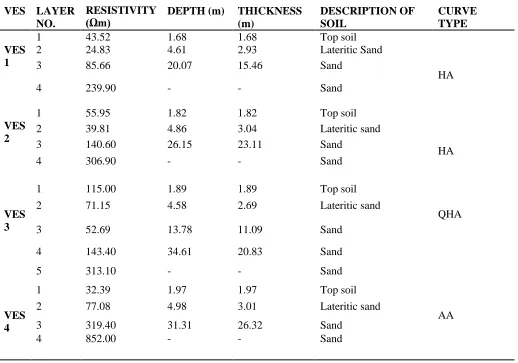
The values of the apparent resistivity (ρa) were processed using the IP12WIN automatic software. The results of the VES data are presented in terms of true resistivity, depths and thickness of the subsurface layers (Table 1). The results reveal a four to five geo-electric layers
Table 1: LAYER PARAMETERS OF GEOELECTRIC SECTION FOR VES (1 - 4)
VES LAYER NO.
RESISTIVITY
(Ωm) DEPTH (m) THICKNESS (m)
DESCRIPTION OF SOIL
CURVE TYPE
VES 1
1 43.52 1.68 1.68 Top soil
HA
2 24.83 4.61 2.93 Lateritic Sand
3 85.66 20.07 15.46 Sand
4 239.90 - - Sand
VES 2
1 55.95 1.82 1.82 Top soil
HA
2 39.81 4.86 3.04 Lateritic sand
3 140.60 26.15 23.11 Sand
4 306.90 - - Sand
VES 3
1 115.00 1.89 1.89 Top soil
QHA
2 71.15 4.58 2.69 Lateritic sand
3 52.69 13.78 11.09 Sand
4 143.40 34.61 20.83 Sand
5 313.10 - - Sand
VES 4
1 32.39 1.97 1.97 Top soil
AA
2 77.08 4.98 3.01 Lateritic sand
3 319.40 31.31 26.32 Sand
with the following type curves: HA, QHA, AA (Fig 2). The geo-electric sections consist of a first layer of top soil to lateritic sand and sand of various thicknesses. VES 1 and 2 shows a typical HA type curves characterized by a 4 layer geo-electric section while VES 3 is a 5 layer geo-electric section with a QHA curve type. VES 4 shows an AA type curve. The 2nd and 3rd layers of VES 1, 2nd layer of VES 2 and 3rd layer of VES 3 have low resistivities at depth range of 4.58m – 13.78m. The 2nd layer of VES 1, VES 2 and 3rd layer of VES 3 are interpreted as contaminant leachate plume indicating contamination of the soil and groundwater in the study area.VES 4 show resistivities (32.39-852.0) Ωm increasing with depth. The average water table depth in the study area from the VES data is 4.76m.
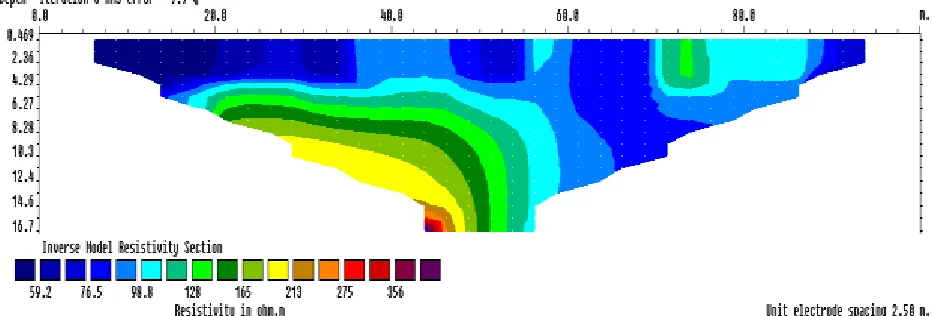
These results are in line with the result of the 2-D ERT. The 2-D ERT (Fig 3and 4) along profile 1 delineated low resistivity zones (3.71- 53.9) Ωm at surface points (5 – 40m and 52.5- 95m) with depths range of (0.469 – 8.28)m. These zones are indicative of contamination of the surrounding soil and groundwater. Beneath the low resistivity zones are zones of high resistivity (285- 481) Ωm at surface points(5.0- 92.5)m with a depth range of (6.27 – 14.6)m. These are mapped and identified as porous and permeable sandy layers of varying sizes and moisture contents.
ERT along profile 2 also delineated low resistivity zones of (< 98.8Ωm) at surface
point of (5-92.5m) to a depth of over 16m, spreading over the entire area. This indicates contaminant leachate plume. The low resistivities are suggestive that the fluid within the earth materials (soil and groundwater) are highly conductive and thus are contaminated. This is an indication that the soil and groundwater have been contaminated beyond the investigated area. Zones of intermediate resistivity (165 to 213 Ωm) are sand of varying grain sizes and thickness.
Evaluation of Aquifer properties
VES 1 HA VES 3 QHA
VES 2 HA VES 4 AA
Fig. 3; Inverted resistivity section of profile 1
Table 2: Computed Aquifer and Dar- Zarrouk parameters of the geoelectric section.
VES NO
Aquifer Resistivity ρa (Ωm)
Aquifer depth (m)
Aquifer thickness (m)
Transmissivity T(Ωm2)
Protective capacity Pc
(siemens)
1 85.66 20.07 15.46 1.32 x 10³ 1.56 x 10
-1
2 140.60 26.15 23.11 3.24 x 10³ 1.08 x 10
-1
3 52.69 13.78 11.09 5.84 x 10² 5.42 x 10
-2
4 319.4 31.31 26.32 8.40 x 10³ 9.98 x 10
-2
DISCUSSION OF RESULTS
The vulnerability assessment of soil and groundwater resources to surface induced contamination was conducted using VES and 2-D ERT techniques. A total of four (4) VES locations and two (2) 2-D profile lines were occupied in this study. The VES data exhibits HA, QHA and AA type curves and generally a four to five geoelectric section comprising of top soil, lateritic sand and sands of varying thicknesses and moisture content in the area. The depth to the water table was estimated to be 4.76m from the VES data, which indicates the proximity of the groundwater system to the surface.
Results of VES analysis shows that the 2nd layers of VES 1, 2, 3and 4 and 3rd layers of VES 1 and 3exhibit low resistivities (24.83– 85.66)Ωm indicating the presence of contaminant leachate plume and at depth range of (4.58–20.07)m in the study area.
Results show that the effect of
contamination decreases with depths in the investigated sites and more pronouncedin VES locations closer to the dumpsite.
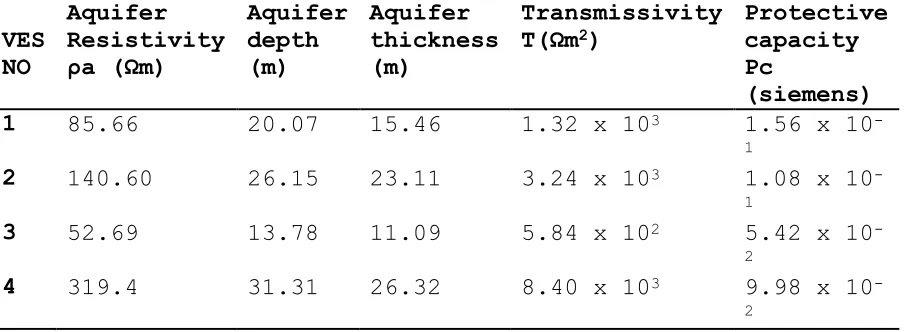
Evaluation of the aquifer properties shows high transmissivity values. These high values suggest that the aquifer materials are highly permeable to the movement of fluids. This indicates that the soil and groundwater has a high tendency of being contaminated at the introduction of waste materials on the surface. Results also show low values of the aquifer protective capacity in the study. The low protective capacities of the overburden rock materials delineated in the study are attributed to the absence of impermeable rock materials which retards contaminant infiltration. Areas with values less than 1Siemens are referred to as poor (Henriet, 1976)and the values obtained in the study reveal that aquifer protective capacity is poor. This indicates potential risks to soil and groundwater, thus making the soil and groundwater vulnerable to surface induced contamination.
CONCLUSION
The result of the VES and the 2-D electrical resistivity tomography are in agreement. The
contaminant leachate plumes were
delineated in both the VES and the 2-D resistivity sections as low resistivity zones. The result reveals that the soiland groundwater around the dumpsite area havebeen contaminated to depths beyond 16.7m within the aquifer. The transmissivity of the aquifers vary from 5.84x10² to 8.40x 10³Ωm2. This high value of transmissivities indicates fast seepage of fluid into the underlying formations. This implies that any contaminant that migrates towards the aquifer will be transported very fast thus
making the aquifer vulnerable to surface contamination.
The protective capacity values ranges from 9.98 x 10⁻²to 1.56 x 10⁻¹Siemens. The protective capacity of the area is less than 1Siemens which are indicative of poor protection of the over burden layers to the groundwater system, thus rendering the soil and groundwater vulnerable to surface contamination.
REFERENCES
[1]. Abiola, O., Enikanselu P. A.and
Oladapo M. I.,(2009): Groundwater
potential and aquifer protective capacity of
overburden units in Ado-Ekiti,
southwestern Nigeria.International Journal of Physical Sciences. 4 (3), 120-132.
[2]. Allen, A.R., (2001): Containment landfills: the Myth of sustainability.
Engineering Geology, 60: 13-19.
[3]. Akinbile, C. O., (2012):
Environmental Impact of Landfill on Groundwater Quality and Agricultural Soils in Nigeria. Soil & Water Res., 7(1): 18–26. [4]. Balogun M.R. (2010): Groundwater quality assessment near a municipal landfill, Lagos, Nigeria. Research Journal of Applied Sciences, Engineering and Technology, 2: 39–44
[6]. Ehirim, C.N. and Ebeniro, J.O., (2006): Tectonic trends delineated from drainage lineament analysis and azimuthal resistivity survey: A case study of SE Nigeria gully erosion belt. Global Journal of Geol. Science. 4:21-28.
[7]. Ehirim, C. N. and Nwankwo C. N.,
(2010): Evaluation of aquifer
characteristics and groundwater quality using geoelectric method in Choba, Port Harcourt. Archives of Applied Science Research, 2(2), 396-403.
[8]. Ehirim, C. N. and Ofor, W., (2011): Assessing aquifer vulnerability to contaminants near solid waste landfill sites in a coastal environment, Port Harcourt, Nigeria. Trends in Applied Sciences Research 6 (2): 165-173.
[9]. Griffiths, D. H., and Barkers, R. D. (1993): Two-Dimensional resistivity imaging and modeling of complex geology.
Journal of Applied Geophysics 29:211-226. [10]. Henriet J.P., (1976): Direct application of Dar Zarrouk parameters in groundwater survey. Geophys Prospect
24:344–353.
[11]. Ikem A., Osibanjo O., Sridhar M.K.C., Sobande A. (2002): Evaluation of groundwater quality characteristics near two waste sites in Ibadan and Lagos, Nigeria. Water, Air, and Soil Pollution,
140: 307–333.
[12]. Iloeje. N. P., (1992): A New Geography of West Africa (Longman Group Ltd, Nigeria.
[13]. Kelly, W.E., (1997): Groundwater, 15 (6): 420-425.
[14]. Loke, M.H., (2004): Tutorial: 2-D and 3-D electrical imaging surveys .Course
Notes for USGS Workshop 2-D and 3-D Inversion and Modeling of Surface and Borehole Resistivity Data, Torrs, CT.
[15]. Mbonu, P.D.C, Ebeniro,
J.O.,Ofoegbu, C.O and. Ekine. A.S. (1991): Geophysics . 56:.284-292
[16]. Mailet,R., (1947): Geophysics, 12(4): 529-531
[17]. Oborie E 1, and Udom G J. (2014): Determination of aquifer transmissivity using geoelectrical sounding and pumping test in parts of Bayelsa State, Nigeria. Peak Journal of Physical and Environmental Science Research; 2(2):32-40.
[18]. Reyment, R. A.,(1965): Aspects of the geology of Nigeria. University of Ibadan press, Nigeria,51-55
[19]. Rosqvist, H., Dahlin, T. , Fourier, A., Rohrs, L. , Bengtsson, A. , and Lasson, M. , (2003): mapping of leachate plumes at two landfill sites in South Africa using geoelectrical imaging techniques . Proceeding of the 9th International Waste Management and Landfill Symposium, Oct. 6-10, Caghani, Italy, 1-10.
[20]. Short, K.C. and Stauble, A.J. (1967): Outline Geology of Nigeria. Ibadan University Press, Nigeria.
[21]. Ward, S. H., (1990): Resistivity and
induced polarization methods: in
Geotechnical and Environmental