Collaborative Learning: Social Network Analysis Approach
Noor Irliana Mohd Rahim
1 e-mail: [email protected]Noorminshah A. Iahad
2 e-mail: [email protected]Azizah Abd. Rahman
3 e-mail: [email protected]Author(s) Contact Details: 1,2,3
Faculty of Computer Science and Information System, University Technology Malaysia, 81310 Skudai, Johor, Malaysia
Abstract — In an organization, the community itself needs a knowledge sharing (KS) practices among themselves. In order to have a good collaborative working environment, the organization must have an effective method or solution to ensure the community is able to share their knowledge and skills in a proper way. In order to provide a KS platform to the community, a few factor need to study such as what is the appropriate knowledge tools for support collaborative knowledge sharing environment in the organization. Despite on the challenges of using tools to create a collaborative environment in work place, it has been stated in other journal that we need to know whether the environment has been adapted into community after starts using tools. In this case, to study the collaborative KS practices in organization, researcher has chosen a logistic sector in Johor, Tiong Nam Logistic Group (TNLG) to be a case study. The problem faced by TNLG is that they currently do not have any specific platform that can capture and share all the knowledge especially in computer based problems and this will limit the KS among workers. Because of this, TNLG do not know the specific knowledge that they have and they do not know which knowledge that may be important for them to share with colleague. Several methods have been introduced to TNLG in order to resolve the issues. A KS tool will be provided to the communities in TNLG as a platform to share and transfer their knowledge. Methods such as Social Network Analysis, Knowledge Worker Characteristics and questionnaire will be used in this case study. The expected result is divided into two areas which are related to KS network in organization and knowledge worker contribution. The good contributor is expected to have a good knowledge in which this study found that; good knowledge worker has been created after they start to practice the KS collaborative environment by using the KS tool.
Keywords – social network analysis; knowledge sharing; knowledge sharing network; knowledge worker
1. INTRODUCTION
This paper will discuss in details regarding the analysis and conclusion from initial questionnaire that has been distributed to community of knowledge sharing. In order to have small contributors towards this study, we will choose a group from logistic organization. They will start using the knowledge sharing tool which is portal. It has been provided by researcher in order to test whether there is a collaborative knowledge sharing practices in organization after using the portal. After 8 months of portal usage by 80 employees, the questionnaire will be distribute during the evaluation period of the portal. The purpose of distributing the questionnaire is to gather the data as well as to investigate the knowledge sharing in collaborative environment after using the portal. Basically, the questionnaire has been distributed to 80 employees from different departments in the organization. The answers will be analyzed based on SNA network chart. The result should be tally with both network chart and also the answer given. The main expecting results of this analysis is - the result will contribute to identification of the active community or individual who share knowledge among colleagues whether in same department or not.
Van Duijn and Vermunt define SNA aims at “understanding the network structure by description, visualisation and (statistical) modelling” [1]. Wasserman and Faust state that the data used in social network analysis is viewed as a social relational system characterized by a set of actors and their social ties. Additional information in the form of actor attribute variables or multiple relations can be part of this social relational system [2]. However, there are limitations of using SNA approach in order to measure the knowledge sharing networks. One major limitation is the restricted ability to know what is the knowledge that they have shared among the communities [3]. In SNA, we can have two level of result, which are knowledge network among communities and also the performance for each person.
2. LITERATURE REVIEW
A. Social Network Analysis
SNA is interactive approach to conducting knowledge network analysis and individual performance in organization [4]. It happens when a knowledge sharing occur in organization involving few community of practice. Based on the scenario, higher level in organization can get an overall picture by diagramming three types of relationship networks which are advice networks (who depends on whom for solving problems), trust networks (who trusts in whom, who shares delicate information and supports others in a crisis) and communication networks (who talks frequently to whom about work-related matters) [5]. To foster participation and content sharing, several SNA activities are being considered in this research. The activities were chosen according to their appropriation in this case study. Table 1 describes some SNA activities.
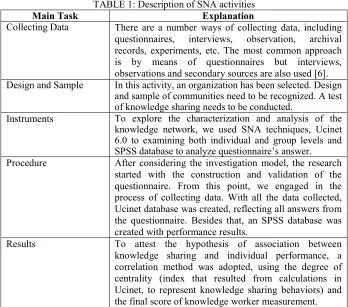
TABLE 1: Description of SNA activities
Main Task Explanation
Collecting Data There are a number ways of collecting data, including questionnaires, interviews, observation, archival records, experiments, etc. The most common approach is by means of questionnaires but interviews, observations and secondary sources are also used [6]. Design and Sample In this activity, an organization has been selected. Design
and sample of communities need to be recognized. A test of knowledge sharing needs to be conducted.
Instruments To explore the characterization and analysis of the knowledge network, we used SNA techniques, Ucinet 6.0 to examining both individual and group levels and SPSS database to analyze questionnaire’s answer. Procedure After considering the investigation model, the research
started with the construction and validation of the questionnaire. From this point, we engaged in the process of collecting data. With all the data collected, Ucinet database was created, reflecting all answers from the questionnaire. Besides that, an SPSS database was created with performance results.
Results To attest the hypothesis of association between knowledge sharing and individual performance, a correlation method was adopted, using the degree of centrality (index that resulted from calculations in Ucinet, to represent knowledge sharing behaviors) and the final score of knowledge worker measurement.
B. Criteria of Knowledge Worker
Reference to knowledge workers was first made in 1959 by Peter Drucker, a noted expert in leadership and management in organizations [7]. According to him, a knowledge worker is different from other industry workers as he is someone whose main work in the organization is related to information or to the development of knowledge that will be useful in the workplace [8]. He is involved not only in acquiring and analyzing knowledge, but also in the storing, programming, distributing and marketing of knowledge products. Knowledge workers use a variety of skills and tools to analyze problems and develop viable options to solve these problems. They are typically insightful and experts in logic. Their main role in business organizations is to provide guidance and influence decision-making, priorities and business strategies.
• Ability to apply information
• Communication skills
The original prototype was from Peter Drucker in mid 1990s, introducing a measurement of knowledge worker by using above characteristic. From the characteristic, he creates a set of questionnaire to distribute to respondents to capture the individual productivity of knowledge worker. We will distribute a set of questionnaire related to the knowledge worker characteristic after they start using KS portal and we also will analyze the data from user respondents, and the data collected will be inserted into the equation. Below table are the results after analyzing the questionnaires from respondents.
3. RESEARCH METHOD
After let all collaborators use the KS portal, researcher need to do a testing and verification whether the tools are helping them in terms of knowledge worker, knowledge sharing session and also help to collaborate among the colleagues. So, below steps are the things that researcher should follow in order to use SNA method as a tool for measure knowledge sharing in TNLG.
• Do a sampling technique (Stratified Sampling) to find the respondents. 80 samples are to be selected from various department and level. 20% of the respondents are managers from department involved, 20% are IT staffs, 20% are Operation staffs and 20% are Warehouse staffs and 20% are HR staffs then 8 managers, 8 IT staffs, 8 Operation staffs, 8 warehouse staffs, 8 HR staffs would be randomly selected. The statistic was divided by each collaborator that is involved in this testing also the managers from higher level.
• Methodological procedure in getting data are by using questionnaire.
• After 8 months using the portal, questionnaire will be distributed to 80 respondents based on previous sampling method. This question is based on the experience after start using portal and based on 4 characteristics of knowledge worker that has been discussed in earlier chapter in order to measure the knowledge worker.
• After a while, data are collected and researcher will start to analyze the data by using SPSS database. Ucinet database will be use to include centrality measures, subgroup identification, role analysis, elementary graph theory, and permutation-based statistical analysis. At the end, a conclusion can be made from this Ucinet results, whether the knowledge sharing are happened in organization and the individual can perform well by using the KS portal.
• Result must be in graphical representation nodes, with explanation attached to it.
• Discussion and conclusion can be made at the final stage of analysis.
3. SOCIAL NETWORK ANALYSIS IN ORGANIZATION
This paper is based on one main investigation problem. The question is “Is knowledge sharing present in the collaborative environment in organization?” Thus, we aim to discover if the people who score higher in SNA, they are assumed to have a better knowledge to be shared among collaborators. Following the literature review and our own expectations, we propose the subsequent investigation hypothesis:
H1 – “There is a positive correlation between Knowledge Sharing Behaviours and the collaborators in the collaborative environment”.
A. Design and Sample
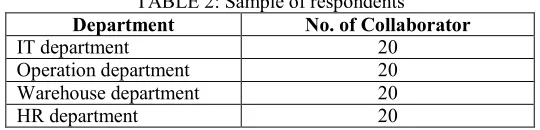
TABLE 2: Sample of respondents
Department No. of Collaborator
IT department 20 Operation department 20 Warehouse department 20 HR department 20
B. Instruments
An exploratory analysis of the main concepts of the network (centrality of the nodes and density of the network) was performed, using Ucinet 6.0 (Borgatti, Everett & Freeman, 2002) [10], examining both individual and group levels. For this, we used a questionnaire devised by us, based on several examples used by authors of reference [6]. The chosen question, although complex, was the best way we found to assure that the subjects assumed we were talking about knowledge (not information), forcing them to give the name of the people who actually shared knowledge with them (referring to the people who taught them something they previously did not know, in a way that they did not have to go to those people again for that matter). A common question was used to prevent possible difficulties for the reader, not only because of the complexity of the question, but also because the knowledge sharing concept is not particularly clear (it could lead to misinterpretation) but the meaning still leads to measuring knowledge sharing.
C. Procedure
After explaining the theoretical assumptions, the questionnaire was presented and analyzed by the researcher and this member of the sampled organization. From this point, we engaged in the process of collecting data. The researcher went in person to the department to deliver and collect the data. With all the data collected, Ucinet database was created, reflecting all answers from the questionnaire. Besides that, an SPSS database was created with performance results. To attest the hypothesis of association between knowledge sharing and knowledge worker measurement, a correlation method was adopted, using the degree of centrality (index that resulted from calculations in Ucinet, to represent knowledge sharing behaviors) and the final score of knowledge worker measurement.
D. Results
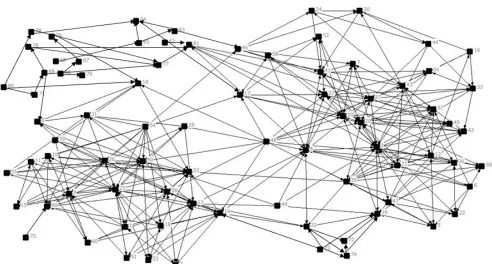
In Figure 1, we can get a global image of the organizational knowledge sharing network, observing that, although this seems a very intricate network, the density index tells us something very different. In such a large sample, and comparing the possible contacts, these subjects do not connect very much. Analyzing each nodes in the figure, we can see that some of them have higher functional positions, such as manager of Operation Department, manager of IT Department, Director of Operation, IT staffs and Operation staffs.
After plotting all data into Ucinet database, the output has been composed in nodes and ties. Figure 1 shows the graphic representation of knowledge sharing network in organization by using KSS portal. By observing the nodes and ties, although this seems a very intricate network, the density index tells something very different. In such a small sample, and comparing the possible contacts, these subjects tells a good communication between communities. If we refer to each subjects (nodes 1 until 80), it shows that some of them have high density of ties.
FIGURE 1: Graphic representation of Knowledge Sharing Network (KSN) from KS portal for related departments.
4. RELATIONSHIP BETWEEN KS NETWORK AND CONTRIBUTION INDEX FROM COLLABORATORS
Regarding analysis of the other two main variables within this research study, knowledge sharing and contribution score, the researcher has discovered if there is an association between them. This study is to measure the higher density of knowledge network the higher performance they will get [12]. The main measure to be used for this analysis was the contribution index, which is defined as:
Contribution score = messages sent – messages received
messages sent + messages received (1)
After conducting knowledge network analysis by using SNA approach, it continuously can contribute to a table of collaborator’s contribution score. By inserting all data into above formula, the researcher comes out with a table that lists those subjects that were involved in previous research. Based on Table 3, a calculation of the contribution index has been conducted. The score for whole involved collaborators are shown in Table 1.
For initial hypothesis that we have been explored at initial stage, it is proven that there is a relationship between knowledge sharing behaviours and the contribution from collaborators to the portal. The data has shown that the collaborators exist, and the contribution score has been measured by using the simple formula given. This finding has led us to infer that people with more sharing behaviours are expected to have higher contribution scores.
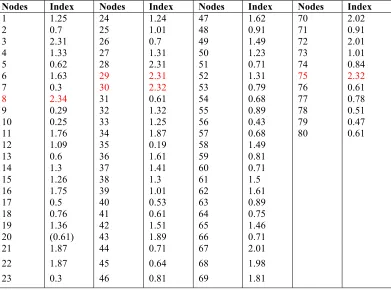
TABLE 3: Contribution score of TNLG collaborator from KSN
Nodes Index Nodes Index Nodes Index Nodes Index
1 2 3 4 5 6 7 8 9 10 11 12 13 14 15 16 17 18 19 20 1.25 0.7 2.31 1.33 0.62 1.63 0.3 2.34 0.29 0.25 1.76 1.09 0.6 1.3 1.26 1.75 0.5 0.76 1.36 (0.61) 24 25 26 27 28 29 30 31 32 33 34 35 36 37 38 39 40 41 42 43 1.24 1.01 0.7 1.31 2.31 2.31 2.32 0.61 1.32 1.25 1.87 0.19 1.61 1.41 1.3 1.01 0.53 0.61 1.51 1.89 47 48 49 50 51 52 53 54 55 56 57 58 59 60 61 62 63 64 65 66 1.62 0.91 1.49 1.23 0.71 1.31 0.79 0.68 0.89 0.43 0.68 1.49 0.81 0.71 1.5 1.61 0.89 0.75 1.46 0.71 70 71 72 73 74 75 76 77 78 79 80 2.02 0.91 2.01 1.01 0.84 2.32 0.61 0.78 0.51 0.47 0.61
21 1.87 44 0.71 67 2.01 22 1.87 45 0.64 68 1.98 23 0.3 46 0.81 69 1.81
In order to know whether the highest score in contribution index is a good knowledge worker, a set of questionnaire related to characteristics of knowledge worker has been distributed to the same group off collaborators. The result will be examined by comparing the value within contribution score of KSN and value of characteristic of knowledge worker questionnaire. From the analysis, we can conclude that:
• There is a collaborative environment of knowledge sharing happened in organization and there is successful knowledge worker will be created.
• To identify a good knowledge worker, the higher input nodes are expected to have more knowledge compared to others.
5. CONCLUSION
From the research that has been done for this paper, we can say that the correlation between collaborators are highly correlated. This can be seen in the KSN graphic presentation which has been discussed earlier. From the picture (Figure 1), we can see there are almost all collaborators participate in this KS collaboration testing. However, only few collaborators are having high contribution index score. The more collaborators share their knowledge, they are assumed as a good knowledge worker. In this case, we can accept the initial hypothesis because it means we have evidence that we found a true correlation among the collaborators and we know that there is collaborative knowledge sharing environment and practices happened in the case study. The result has been enhanced to a creation of knowledge worker. This is to ensure all collaborators can get the benefits after using the KS tool as a platform to have collaboration among colleagues in TNLG. The result of SPSS has shown that there is the correlation between knowledge sharing network and knowledge worker. The more they can share knowledge the more chances to become a successful knowledge worker in future.
REFERENCES
[1] Van Duijn, M. A. J., & Vermunt, J. K. (2006). What is special about social network analysis? Methodology, 2 (1), 2-6.
[2] Small, C. T., & Sage, A. P. (2005/2006). Knowledge management and knowledge sharing: a review. Information
Knowledge Systems Management, 5, 153-169.
[3] Van Duijn, M. A. J., & Vermunt, J. K. (2006). What is special about social network analysis? Methodology, 2 (1), 2-6.
[4 Du, R., Ai, S., & Ren, Y. (2007). Relationship between knowledge sharing and performance: a survey in Xi’an, China. Expert Systems with Applications, 32, 38-46.
[5] Coleman, D. (1999). Groupware: Collaboration and Knowledge Sharing. In Liebowitz (Ed.), Knowledge
management handbook. New York: CRC.
[6] Wasserman, S., & Faust, K. (1994). Social network analysis: Methods and applications. Cambridge, MA: Cambridge University Press.
[7] Drucker P.F. (1999) Management Challenges for the 21st Century, Butterworth-Heinemann, Oxford. Druker P.F. (1995) Managing in a Time of Great Change, Butterworth-Heinemann, Oxford Druker P.F. (1992) Managing for the Future, Butterworth-Heinemann, Oxford.
[8] Naomi Stanford (2011). Knowledge Worker Productivity: challenges, issues, solutions.
[9] Thomas W. Valente, Robert K. Foreman. Integration and Radiality: Measuring the Extent of an Individual'sConnectedness And Reachability in a Network. Social Networks 20 (1998) 89-105.
[10] Borgatti, S.P., Everett, M.G. and Freeman, L.C. 2002. Ucinet 6 for Windows. Harvard: Analytic Technologies. [11] John P. Boyd, William J. Fitzgerald, and Robert J. Beck. Computing Core/Periphery Structures and Permutation