ABSTRACT
KANDIAH, VENU KANTHAN. Agent-Based Modeling for Simulating the Effects of Demand Reduction on Urban Water Resources and Infrastructure Systems. (Under the direction of Emily Zechman Berglund).
availability and system performance in a water system as homeowners adopt lot-level rainwater harvesting is developed. An ABM of consumers is coupled with water supply and distribution system models. The modeling framework is applied to a case study and demonstrates how an ABM framework can simulate the transition of water infrastructure performance and water resources availability based on homeowner water use behavior.
Subsequent work focuses on reclaimed water as an alternative water source. Social factors play an important role in consumer perception and attitudes towards the use of reclaimed water, and theory from the social sciences are used for model development. A modeling framework using a CA approach is developed to simulate consumer adoption of reclaimed water. The model is developed using diffusion of innovations theory, and simulates a diffusion process driven by the neighborhood effect. The CA model of consumers is coupled with distribution system models of the potable and reclaimed water networks and is applied for the Town of Cary, North Carolina. The model simulates the co-evolution of emergent distribution system hydraulics in the dual water system as consumers adopt reclaimed water.
Risk and benefit perceptions also play an important role in the adoption on new technologies. An ABM framework, based on the concept of “risk publics”, is developed to
Agent-Based Modeling for Simulating the Effects of Demand Reduction on Urban Water Resources and Infrastructure Systems
by
Venu Kanthan Kandiah
A dissertation submitted to the Graduate Faculty of North Carolina State University
in partial fulfillment of the requirements for the Degree of
Doctor of Philosophy
Civil, Construction and Environmental Engineering
Raleigh, North Carolina 2015
APPROVED BY:
BIOGRAPHY
TABLE OF CONTENTS
LIST OF TABLES…..………. viii
LIST OF FIGURES….……… x
CHAPTER 1 Introduction………..……… 1
CHAPTER 2 Agent-based Modeling to Simulate the Decentralization of an Urban Water Supply System and Assess Infrastructure Performance Impacts... 7
2.1 Abstract……….. 7
2.2 Introduction………... 8
2.3 Decentralization of Urban Water Resources Through Adoption of Rainwater Harvesting………... 11
2.4 Modeling a Decentralizing Urban Water System: An Agent-Based Modeling Approach……… 14
2.4.1 Agent-based Model of Consumers………. 18
2.4.2 Purpose………. 18
2.4.3 State variables and scales………... 18
2.4.4 Process overview and scheduling………... 19
2.4.5 Sub-models………... 19
2.4.5.1 Agent Sub-models……….. 19
2.4.5.4 Water Distribution Sub-model………... 23
2.4.6 Initialization and Input………... 24
2.4.7 Design concepts……… 24
2.5 Illustrative Case Study: D-Town………... 26
2.6 Simulation Results……… 30
2.6.1 Effects on Infrastructure Performance………... 33
2.6.2 Stochasticity in Simulation………. 39
2.7 Sensitivity Analysis………... 41
2.7.1 Cistern Size………... 41
2.7.2 Adoption Rate……….. 44
2.8 Discussion………... 46
2.9 Conclusions……… 49
CHAPTER 3 A Cellular Automata Modeling Framework for Urban Water Reuse Planning and Management……….. 52
3.1 Abstract………. 52
3.2 Introduction………... 53
3.3 Diffusion of Innovation for the Adoption of Non-Potable Water Reuse for Residential Application……… 55
3.4 A Cellular Automata Modeling Framework to Simulate Water Reuse Adoption………... 58
3.4.2 Model elements……….... 60
3.4.3 Process overview and scheduling………... 61
3.4.3.1 Step 1: Pass messages and evaluate transition rule……… 61
3.4.3.2 Step 2: Update demand………... 64
3.4.3.3 Step 3: Calculate hydraulic conditions………... 64
3.4.4 Initialization and Input………... 65
3.4.5 Design Concepts………... 65
3.5 Case Study: Town of Cary, North Carolina………... 68
3.6 Calibration of the CA Model………... 72
3.6.1 Observed Data………... 72
3.6.2 Parameter calibration………. 74
3.7 Projections………. 80
3.7.1 Projection of adoption of reclaimed water services…………... 80
3.7.2 Hydraulic simulation results……….. 81
3.7.2.1 Effects on Reclaimed Water Infrastructure Performance……... 82
3.7.2.2 Effects on Potable Water Infrastructure Performance……….. 84
3.8 Sensitivity Analysis………... 89
3.9 Conclusions……… 92
4.1 Abstract……….. 95
4.2 Introduction………... 96
4.3 Background………... 98
4.3.1 Water Reuse and its Benefits and Risks……… 98
4.3.2. Risk Perception and Risk Publics………. 101
4.4 Empirical Acceptance-Resistance Agent-based Model………. 104
4.4.1 Development of Risk Publics Model Parameters using Analysis of Water Reuse Survey Data ………... 105
4.4.1.1 Cluster Analysis……….……... 106
4.4.1.2 Communication Parameters………... 112
4.4.2 Rules for Communication and Changing Perceptions………... 115
4.5 Results……… 119
4.5.1 Theoretical Model – Impact of varying starting population proportions……… 119
4.5.2 Theoretical Model – Impact of varying communication frequencies…. 127 4.5.3 Empirical Model……….. 132
4.6 Regional Analysis……….. 135
4.7 Conclusions……… 141
4.8 Acknowledgments………. 145
5.2 Calibration of the Risk Publics Model for Cary………... 148
5.2.1 Description of Model Parameters……….. 148
5.2.2 Calibration Data……….. 150
5.2.3 Calibration of Communication Parameters………... 151
5.2.4 Calibration of Population Proportion Parameters………... 154
5.3 Adoption Projections for Cary………... 159
5.4 Comparison Between the Agent-Based Modeling and Cellular Automata Approaches………... 164
5.5 Effect of Expansion Schedule on Adoption………... 166
5.6 Limitations and Model Extensions……….. 179
5.6.1 Limitations of the Unitary Approach……… 179
5.6.2 Incorporating External Factors in the Risk Publics Model………. 181
5.7 Discussion………... 183
5.8 Acknowledgments………. 186
CHAPTER 6 Conclusions………... 187
LIST OF TABLES
Table 2.1 Impact of adoption rates………. 45 Table 3.1 Average day demand (ADD) and maximum day demand (MDD)
assignments……….…... 71
Table 3.2 Subdivision characteristics………. 73 Table 3.3 Summary of parameter values that were tested for calibration……….. 75 Table 3.4 Parameter settings for selected models……….. 76 Table 3.5 Parameter settings for sensitivity analysis evaluations……….. 90 Table 4.1 Risk and benefits perception statement/questions used in survey……. 106 Table 4.2 Risk and benefit perception by belief clusters………... 109 Table 4.3 Characteristics of additional belief clusters defined for modeling…… 112 Table 4.4 Survey questions used to determine communication behavior……….. 114 Table 4.5 Communication frequency by cluster……… 114 Table 4.6 Relative frequency of communication within and between clusters….. 115 Table 4.7 Regional population proportions as determined from survey analysis.. 136 Table 5.1 Population proportions used for modeling Town of Cary………. 149 Table 5.2 Summary of parameter values……… 152 Table 5.3 Parameter settings for optimal models………... 152 Table 5.4 Population proportion limits obtained from reclaimed water survey
Table 5.5 Summary of parameter values……… 156 Table 5.6 Parameter settings for selected models……….. 157 Table 5.7 Capacity expansion schedules. Shown as fractional equivalents of
total expansion capacity of 16,500 homes for four 5-year planning
LIST OF FIGURES
Figure 2.1 Causal loop diagram of feedbacks in a decentralizing urban water supply system. Performance of the water distribution system is
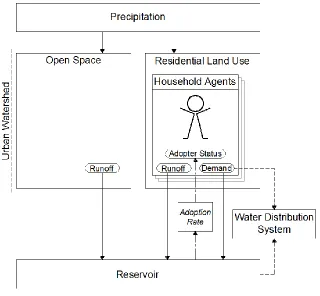
affected by the volume of water withdrawals and reservoir levels…… 14 Figure 2.2 ABM framework couples household agents with hydrologic and
water distribution system models. Arrows indicate information that
is passed between models……….. 17 Figure 2.3 Monthly rainfall and landscape water requirements for households in
D-Town……….. 27
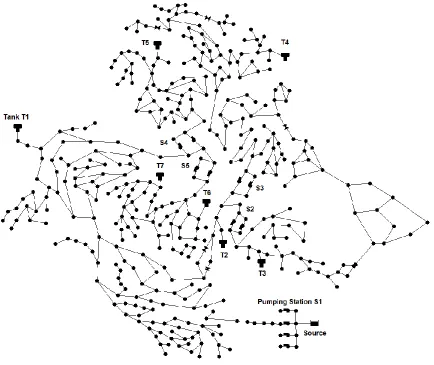
Figure 2.4 D-Town Water Distribution System. Dark circles represent nodes;
Tanks are labeled T#; pump stations are labeled S#... 29 Figure 2.5 Pump operations are controlled by water levels in corresponding
tanks. Boxes represent tanks, and shaded bands represent the relative tank levels at which pumps are activated, using rules shown in the legend. Tanks dimensions are normalized, and band of pump
operation is shown to scale, with respect to tank dimensions………… 30 Figure 2.6 Dynamics of the water resources system over a 20-year planning
horizon: (a) average annual reservoir storage, and (b) fraction of
Figure 2.7 Total demand exerted on the water distribution system is calculated
as the sum of all demands over a 144-hour period in July………. 34 Figure 2.8 Sum of outflows over 144-hour period in July at Pump Stations S1,
S2, S3, S4, and S5……….. 36 Figure 2.9 Comparison of tank behavior, shown as (a) the range of tank level
fluctuations, (b) total outflows, and (c) average water age. Values are calculated for a 144-hour period in July……… 37 Figure 2.10 Number of pump starts during a 144-hour period in July……….. 38 Figure 2.11 Tank T4 behavior for five simulation trials. Each line represents
output from one simulation, which is a 144-hour period simulation in the month of July: (a) range of tank level fluctuations, (b) total
outflows, and (c) average water age………... 40 Figure 2.12 Pump P6 and P7 and Pump Station S3 flows for five simulation trials.
Each line represents output from one simulation, which is a 144-hour
period simulation in the month of July……….. 41 Figure 2.13 Total demand of households exerted on the D-Town water
distribution system for cistern sizes (cistern volumes in gallons stored per month)…... 43 Figure 2.14 Runoff from D-Town watershed to the reservoir for cistern sizes
Figure 3.1 Overview of modeling framework. CA model of dual system
adoption coupled with water and reclaimed water distribution system
models……… 59
Figure 3.2 Proposed Cary reclaimed water distribution network system
expansion by phase. Cary/Apex Water Treatment Plant (WTP) show for reference purpose only, actual location of facility is outside figure area. Locations shown for Reclaimed Water (RW) Tanks 1 and 2; Reclaimed Water Pump Station (PS) 1; and Carpenter Tank, which is
a tank in the potable water system………. 70 Figure 3.3 Central, South, Mid, and West Subdivisions adopt reclaimed water
from 2001-2012………. 73
Figure 3.4 Performance of Models 1, 2, 3, and 4 is compared to observed data. (a) Number of new adopter households per year. (b) Total number of
adopter households………. 79
Figure 3.5 Projected number of adopter households and planned capacity.
Average of 25 simulations for each Model is reported……….. 81 Figure 3.6 Maximum total one-week flow per year from the water reclamation
facility, projected using Model 1 and Model 3……….. 82 Figure 3.7 Reclaimed Water Tank behavior projected by Model 1: (a) outflows
Figure 3.8 Reclaimed Water Tank behavior projected by Model 3: (a) outflows
(b) range of tank level fluctuations, (c) average water age……… 84 Figure 3.9 Total one-week average water flows from Cary/Apex WTP, projected
using Model 1 and Model 3………... 85 Figure 3.10 Carpenter Tank behavior projected by Model 1: (a) outflows (b)
range of tank level fluctuations, and (c) average water age…………... 86 Figure 3.11 Carpenter Tank behavior projected by Model 3: (a) outflows (b)
range of tank level fluctuations, and (c) average water age…………... 86 Figure 3.12 Carpenter Tank emergency storage projected by Model 1……… 88 Figure 3.13 Carpenter Tank emergency storage projected by Model 3……… 88 Figure 3.14 Evaluation of varying weighting factors on simulated diffusion
process……… 90
Figure 3.15 Differences in diffusion among subdivisions with varying number of
neighbors – Model R3……… 91
Figure 4.1 Water reuse perceptions by cluster mapped along dimensions of risk
and benefit perception……… 110 Figure 4.2 Theoretical risk publics cluster definitions……… 120 Figure 4.3 Observed population states in Year 10 of simulation as a function of
initial population. (a) Optimistic; (b) Disengaged; (c) Alarmed; (d)
Figure 4.4 Observed population states in Year 30 of simulation as a function of initial population. (a) Optimistic; (b) Disengaged; (c) Alarmed; (d)
Conflicted………... 122
Figure 4.5 Time required for population to become 90% optimistic or alarmed as a function of risk-to-benefit values……… 126 Figure 4.6 Observed year 30 optimistic and alarmed populations in all
simulation runs as a function of risk-to-benefit values……….. 126 Figure 4.7 Observed population states in Year 10 of simulation as a function of
communication frequency. (a) Optimistic; (b) Disengaged; (c)
Alarmed; (d) Conflicted………. 129 Figure 4.8 Time required for population to become 90% optimistic or alarmed as
a function of risk-to-benefit values……… 130 Figure 4.9 Observed year 30 optimistic and alarmed populations in all
simulation runs as a function of risk-to-benefit values……….. 131 Figure 4.10 Observed year 30 alarmed populations in all simulation runs as a
function of risk-to-benefit values coded by communication
frequency……… 132
Figure 4.11 Observed year 30 optimistic population in all simulation runs as a function of risk-to-benefit values coded by communication
Figure 4.12 Observed year 30 alarmed population in all simulation runs as a function of risk-to-benefit values coded by communication
frequency……… 134
Figure 4.13 Overview of regions, based on US Census Bureau Divisions [114]…. 137 Figure 4.14 Population changes in 10-year increments………. 138 Figure 4.15 Annual simulated population in (a) Mountain Region; (b) East South
Central Region; and (c) Nation; [OP – Optimistic; DE – Disengaged;
AL – Alarmed; CO – Conflicted]……….. 139 Figure 4.16 Optimistic population milestones by region……….. 140 Figure 5.1 Performance of Models S1, S2, M1 and M2 compared to observe
data. (a) Number of new adopter households per year. (b) Total
number of adopter households………... 153 Figure 5.2 Performance of Models S1, S2, M1 and M2 compared to observe
data. (a) Number of new adopter households per year. (b) Total
number of adopter households………... 158 Figure 5.3 Projected number of adopter households. Model 1, Model 2, Model 3
and Model 4 curves are obtained using the risk publics framework; CA1 and CA3 are obtained using the cellular automata diffusion of innovations model (refer to Section 6 in Chapter 3); and the Capacity
Figure 5.4 Projected number of adopter households for Scenario: (a) F0; (b) Q1;
CHAPTER 1
Introduction
The integration of alternative water sources, such as rainwater and reclaimed water, into urban water supply systems is a potentially efficient and sustainable strategy that can reduce demands on limited freshwater supplies, and help maintain and expand urban water services. The large scale integration of alternative water sources within an existing urban water system is a complex socio-technical process involving transition in the engineering infrastructure, water use culture (i.e. perceptions, behaviors and practices of water users), and the planning, development, management and operations of water and interconnected infrastructure systems. Decision-makers and utilities may better enable the transition through an improved understanding of: (1) the interconnections and interactions between social and technical components; (2) the underlying emergent system dynamics; and (3) evolutionary pathways for the transition.
and organizational scales. Existing models consider the technical and social components of urban water systems as disparate systems, and are limited in simulating the interconnections, feedback, and dynamics between the consumers and engineering systems and the complex emergent behavior.
Community and individual household acceptance and use of alternative water sources and practices (for example rainwater harvesting, water reuse, etc.) is essential for these demand reduction strategies to be viable and successful on a large scale. The required transition in water use culture within the community is a social process, and social science theory can provide useful insight on how this process evolves. Diffusion of innovations theory [92] which explains the spread of new products, ideas and practices within a community over time offers one possible explanation of how new water use practices can spread. Models, assumptions, and insight drawn from the fields of risk perceptions, and risk communication research, can be used to develop an understanding on how community perceptions may evolve, and the likelihood of community acceptance or rejection of new water sources, in instances where risk factors are associated with the adoption of new and alternative water sources.
as community-wide behavior, that emerges due to the interaction of the individuals; and (3) model information exchange between agents, environmental systems, and technical systems, to facilitate a coupled socio-technical modeling approach. The goal of the research described here is to (1) develop and demonstrate ABM and CA based approaches for simulating the interconnections, interactions, and emergent dynamics between consumers and water infrastructure systems as a water supply systems transition from conventional sources to a more sustainable mix of conventional and alternative sources; (2) develop models using assumptions drawn from social science theory to simulate the process of consumer adoption of alternative sources of water.
Initial research effort focuses on developing a coupled ABM-engineering model framework around a conceptual case study. The initial model serves as a proof of concept and demonstrates the capabilities of the proposed socio-technical framework to simulate the community-wide adoption of alternate sources of water. A set of more realistic and advanced coupled framework are developed subsequently, and applied to a real case study. The second framework incorporates an established empirical diffusion model. Lastly, a new model to simulate adoption based on risk and benefits perceptions is developed. A detailed summary of the research effort, by chapter, is provided below.
water supply and distribution systems to simulate the transition of hydraulic conditions in the existing urban water infrastructure system as homeowners adopt rainwater harvesting systems, which supplement water delivered through municipal mains. Consumer agents use simplified behavioral rules to respond to water shortages by adopting rainwater harvesting. The modeling framework is applied to a conceptual case study to provide insight about the transition of urban water systems as they incorporate a distributed and wide-scale alternative source and about the effects of the transition on existing infrastructure systems. Results demonstrate the use of a tightly coupled agent-based model of households with a watershed model and a water distribution system to simulate dynamic and non-linear interactions between consumers and engineering infrastructure and to generate dynamic system performance data.
models of the drinking and reclaimed water systems. Emergent distribution hydraulics are simulated as consumers adopt water reuse. The coupled model is applied to a real case study, the Town of Cary, North Carolina. Model parameters are calibrated using historical data of adoption. The model is used to predict alternative adoption scenarios and associated water infrastructure system impacts. The coupled simulation framework allows exploration of the interconnections among water reuse strategies and drinking water infrastructure as water reuse is integrated in water supply management.
Chapter 4 describes the development of an ABM to simulate adoption and rejection of water reuse within a community using an alternate social scientific model, the “risk publics” model. The risk publics model is an empirical based approach that uses the concept
of belief clusters, defined on a basis of shared risk and benefit perceptions, to explain the adoption of new technology. Social influence and emergent community opinion dynamics are simulated through interpersonal communications between households. Survey data of the US population, measuring their attitudes, knowledge, attributes, and behavioral intentions for recycled water were analyzed to determine model parameters including the presence of social groups, relationships among individuals, and communicative variables governing individual use of reclaimed water. Model behavior and sensitivity are explored using a theoretical cases study. Data obtained from the water reuse survey is also applied to simulate water reuse adoption behavior in different regions of the US.
CHAPTER 2
Agent-Based Modeling to Simulate the Decentralization of an Urban Water Supply System and Assess Infrastructure Performance Impacts
2.1 Abstract
interactions between the consumers and the water infrastructure system as a water system transitions to a decentralized system. An agent-based model of consumers is coupled with engineering models of the water system to simulate households as they adopt rainwater harvesting as a decentralized water supply source to supplement water delivered through municipal mains. The agent-based model is described using the Overview, Design concepts, and Details protocol. The modeling framework is applied to a test case study to gain insights into the transition of urban water systems from centralized to decentralized systems and to analyze the impacts of the transition on existing infrastructure systems.
Keywords: urban water infrastructure, decentralization, rainwater harvesting systems, sociotechnical systems, agent-based modeling.
2.2 Introduction
water and energy consumption is through reusing, rather than discharging, rainwater or wastewater, by placing decentralized technologies at households or neighborhoods. Decentralized technologies augment centralized water supply sources by recycling water near the point of consumption. As a result, demands on freshwater supplies decrease and the efficient use of other resources is promoted, by saving chemicals and energy that would be needed to treat and distribute potable water [68].
the population adopts rainwater harvesting, the reduction of average and peak flow volumes can influence infrastructure performance [60, 107]. As demands are reduced continuously over a period of adoption, pumps, tanks and other infrastructure components may operate outside of design loading conditions. Decentralized technologies, such as rainwater harvesting, provide an unreliable source due to the variability of precipitation, and lead to increased variability in demands on the centralized supply system. Infrastructure maintenance and expansion plans may be re-evaluated and adapted, based on changes in operations and evolving demand requirements.
2.3 Decentralization of Urban Water Resources through Adoption of Rainwater Harvesting
Decentralized water resources can reduce the need for continuous expansion of water infrastructure and identification of new sources, thereby increasing the sustainability of existing water resources. A portfolio of both centralized and decentralized sources can reduce the vulnerability of water supply to water shortages [75, 124], due to redundancy in resources, multiple scales of resources, multiple scales of infrastructure, and the capability of systems to operate both autonomously and in combination with other resources [127]. Decentralization of water supply systems may also generate gains in energy efficiency [64]. Centralized systems convey large volumes of water over long distances through energy-intensive pumping, while decentralized water sources are located near users and reduce energy demands for conveyance. Additional energy may be wasted in a centralized water distribution system for treatment: water supplied through a distribution system is treated to drinking water quality standards, though some end uses, such as landscape irrigation and toilet flushing, do not have high water quality requirements. In a decentralized system, water generated at the lot-level can be treated as needed for specific end uses, and a centralized system can treat and provide a smaller volume of water for high-contact end uses, such as drinking, bathing, cleaning, and cooking [101].
no treatment as an alternate source of water for domestic end uses, including landscape irrigation and toilet flushing, which do not require water quality at potable standards. Rainwater harvesting systems may also assist stormwater management by reducing the volume of runoff [120]. While demand management through rainwater harvesting has many benefits, stakeholders acknowledge that barriers to the adoption of decentralized water technologies including economic, social, and political aspects, may be present [120].
The decentralization of a water supply system is a dynamic phenomenon that is driven by feedbacks, based on interactions among consumers, utility mangers, public officials, water resources, and water infrastructure [27]. Households may adopt conservation and water-efficient technologies based on their perception of water shortages, water use restrictions, and technology rebates implemented by the local government [120, 89, 76]. Consumer decisions directly affect the availability of water resources, which can drive the decision-making process of utilities and the development of policy regulating water use. The feedback process creates a dynamic system, which transitions from a purely centralized to a decentralized system. The transition is a non-linear process, exhibiting path dependency, where decisions made by consumers and utility managers influence and may limit options that are available at later time steps.
adoption of rainwater harvesting influences water availability by influencing both water demands and the rainfall-runoff process.
The adoption of rainwater harvesting impacts reservoir withdrawals. As water availability decreases, adoption of rainwater harvesting increases, due to messages about water shortages from a utility, increases in prices, or perceptions of water shortages. As the number of households adopting rainwater harvesting systems increases, more demands are met by rainwater, requiring less water supplies from the reservoir. Withdrawals from the reservoir decrease, which stabilizes the reservoir levels and reduces the incentives to adopt rainwater harvesting. This process is shown as a negative feedback loop (right-hand feedback loop in Fig. 2.1), in which the adoption of rainwater harvesting systems balances the system and reduces the need to adopt rainwater harvesting systems.
Rainwater harvesting adoption also interacts with the rainfall-runoff process in a feedback relationship (left-hand feedback loop in Fig. 2.1). A decrease in reservoir levels influences higher adoption rates of rainwater harvesting systems, as described above. The adoption of rainwater harvesting systems decreases the water stored in a reservoir, as more water is captured for reuse and does not runoff to the receiving water body, which decreases water availability. This creates a positive feedback loop, where the initial reaction of adopting rainwater harvesting leads to a set of effects that reinforce the need to continue to implement rainwater harvesting systems at more households.
transport it uphill to the community. Shifts in demands have non-linear effects on the pipe network hydraulics, and new flow patterns, pressures, and tank utilization may emerge. Management challenges may arise as performance and operating metrics vary outside of expected design ranges.
Figure 2.1 Causal loop diagram of feedbacks in a decentralizing urban water supply system. Performance of the water distribution system is affected by the volume of water withdrawals and reservoir levels.
2.4 Modeling a Decentralizing Urban Water System: An Agent-Based Modeling Framework
stages in a transition, but provide limited insight to the emerging dynamics between infrastructure performance and technology adoption.
ABM is a computational modeling approach used to simulate the interactions among individual agents and a shared environment to study dynamic processes [7, 73, 48]. Agents follow simple mathematical rules to represent behavioral choices and decision-making. System-level properties emerge based on the interactions among the agents and the environment. ABM has been applied as a methodology for simulating large-scale sociotechnical systems [83], in which the interactions of technical and social sub-systems drive emergent macro-level properties.
decentralized wastewater technologies. As households adopted water reuse technologies, loss of flows in the sewer system forced the utility to discharge potable water into sewers to continue maintaining adequate flushing velocities. Kotz and Hiessl [56] modeled these interactions by using an ABM approach to simulate consumers that adopt water reuse based on the fees for wastewater disposal and a sewage system operator that adjusts fees to recover the cost of operation.
An ABM framework is developed in this research to simulate the adoption of rainwater harvesting and its effect on water resources sustainability and water infrastructure. Use of an ABM framework allows for spatially explicit and heterogeneous representation of each household, by simulating individual households as agents. While the adoption of consumers is shown as one step in the decentralization of a water supply system in Fig. 2.1, adoption is a complex process that occurs at the individual household level, rather than at a system or macro level. Household adoption exhibits complex behavior that is influenced by reservoir levels, which fluctuates as total system demand and runoff change. Households are located spatially with respect to the water distribution network and assigned to specific nodes for calculating network hydraulics and reflect spatially changing demands as household adopt rainwater harvesting systems.
is a visual simulation software development environment for agent-based, system dynamics, and discrete event modeling.
2.4.1 Agent-Based Model of Consumers
The household ABM is described here using elements of the Overview, Design concepts, and Details (ODD) protocol [43]. The ODD protocol facilitates description of the equations, rules, and scheduling used in an ABM by formalizing the model description as six components: model purpose; state variables and scales; process overview and scheduling; sub-models; initialization and input; and design concepts.
2.4.2 Purpose
The purpose of the ABM framework is to explore the relationships among the adoption of rainwater harvesting systems in a community, water availability, and the performance of water infrastructure systems.
2.4.3 State variables and scales
State variables characterize low-level entities, or agents, of the model. Each household is represented as an agent and has parameters that define its attributes: number of members in a household (M), monthly indoor demand (Din), monthly outdoor irrigation
demand (Dirr), monthly demand exerted on the centralized water distribution system (De),
runoff (Rlot), roof area (Aroof), lawn area (Alawn), cistern size (C), and volume of water in the
cistern (Vc). A household agent can transition between two states: centralized consumer and
adopter. Centralized consumers are households that have not installed rainwater harvesting systems and depend on the centralized water distribution system for water. For centralized consumers, C and Vc are equal to 0.0, until it adopts a rainwater harvesting system. An
2.4.4 Process overview and scheduling
Model processes describe the procedures for updating state variables, sequencing of processes, and modeling time steps. Each agent exerts indoor and outdoor demands on the distribution system, generates runoff, and determines to adopt a rainwater harvesting system at each discrete time step, which is modeled as a month. The order of operations is: demand values are calculated for each agent based on monthly precipitation (Eqns. 2.1-2.2); volume in the cistern is calculated (Eqn. 2.6); demand that is exerted on the system is calculated (Eqn. 2.7); runoff from lots is calculated (Eqns. 2.3-2.5); the external models are executed (watershed, reservoir, and water distribution models); adoption rates are updated, and each agent determines to adopt a rainwater harvesting system, which is installed for the next time step.
2.4.5 Sub-models
Sub-models include those developed to implement the rules that an agent uses to adopt rainwater harvesting, use water for indoor and outdoor purposes, and generate runoff and the external models used to calculate watershed hydrology, reservoir storage and water distribution system hydraulics.
2.4.5.1 Agent Sub-models
generated number compared to the adoption rate, and determines if it becomes an adopter agent and installs a rainwater harvesting system.
Indoor Demand. Indoor demand is simulated as 70 gpcd, based on the “Residential End Uses of Water Report” [71], which reports a national average of 69.3 gpcd. The demand per capita is multiplied by the number of residents in a household to determine the household indoor demand. Indoor demand ( ) is met by the centralized system, and the adoption of rainwater harvesting does not reduce indoor demand. Indoor demand is calculated in gallons per month (gal/mo.):
(gal/mo.) (2.1)
Irrigation Demand. While indoor demands remain constant, outdoor demands vary monthly, based on the depth of precipitation and the landscape requirements. Outdoor demands are calculated using Eqn. 2.2, which is based on evapotranspiration modeling and water use calculations for landscaped areas [1, 23].
(gal/mo) (2.2) where Dirr,m is the outdoor demand for irrigation during month m; Cplant is a
dimensionless plant coefficient, ranging from 0.1 to 1.2, that corresponds to the amount of water (very low, low, medium, high, and very high) that is required by landscape plants; ETm
is evapotranspiration (inches/month) during month m, which can be calculated using, for example, the Penman-Montieth equation. The product of Cplant and ETm is the calculation of
plant water needs, and when the value is greater than the precipitation (
Runoff. Each household agent generates runoff, based on the roof area and the lawn area. When an agent becomes an adopter, the runoff area is reduced to the lawn area. When a cistern overflows, the overflow is added to the lot runoff. A water balance equation is used to calculate total monthly runoff volume at each lot for adopter consumers using Eqns. 2.3-2.4:
{
(gal/mo)
( (2.3)
( ( ) ) (gal/mo) (2.4)
For centralized consumers, the runoff is calculated as:
{
(gal/mo)
( (2.5)
where Rlot,m is the volume of runoff from each lot in month m; Closs is a dimensionless loss
coefficient, similar to the runoff coefficient used in the Rational Method and representing the rainfall excess minus losses; ORHS,m is the volume of overflow from the cistern in month m; C
is the size of the cistern; and Vc,m is the volume of water in the cistern at month m (gal). The
volume is assumed as loss; Closs is a factor used to adjust for the loss. In residential areas,
roof areas contribute as part of the drainage area for households without rainwater harvesting. For households with rainwater harvesting, runoff from the roof area is stored in the cistern, up to the capacity of the cistern, and the roof area does not contribute directly to the runoff flow. Overflow volumes from the rainwater cistern that are in excess of the storage capacity are assumed as routed through a storm sewer system and added as inflows to the reservoir.
Exerted Demand. The demand that a household agent exerts on the centralized water supply system is reduced if the agent uses water from the rainwater harvesting system for irrigation demands. The volume of water that is available in the cistern for meeting irrigation demands in the current month is equal to the storage available at the previous month, less the water that was used to irrigate the lawn in the previous month, in addition to the rainfall from the roof area for the current month:
{ ( ( ) )
( )
}
(gal) (2.6)
Therefore, the volume of demand, De,m that is exerted on the centralized water supply
system each month m is:
( ) (gal/mo) (2.7)
2.4.5.2 Watershed Sub-model
{
(gal/mo) (2.8)
where Rlanduse,m is the volume of runoff from a vegetated area in month m; Alanduse is
the land area; and other variables are defined above. The watershed model aggregates runoff from centralized consumers, adopter agents, and a vegetated area to calculate the total monthly runoff. Other land uses, such as industrial and impervious surfaces can be represented using the same approach and will not include the term for plant water needs. 2.4.5.3 Reservoir Sub-model
Reservoir storage is calculated on a monthly time-step using the continuity equation:
∑ ( ) (gal) (2.9)
where SR,m is the volume of water stored in the reservoir at month m; Rlot,m,i and De,m,i are the
runoff and demand exerted on the water distribution system during month m for agent i; N is the number of household agents in the community; and OR,m is the reservoir outflow for
month m. Reservoir overflows occur when the water level within the reservoir exceeds a pre-defined control elevation. At each month, excess capacity is released from storage to return the reservoir level to the control elevation.
2.4.5.4 Water Distribution Sub-model
to model fluctuation in the diurnal time series. At each time step, nodal demands are updated using a demand factor that accounts for reduction in demand as agents adopt rainwater harvesting systems. The demand factor is calculated for each month as:
∑
∑ ( )
(2.10)
where is the demand factor for node n at time step m, and is the set of all
agents that exert demand at node n. is the indoor demand of agent i at time step m;
and is the total outdoor demand of agent i at time step m; is the volume of the
demand of agent i at time step m that is exerted on the water supply system; and is the
lawn area for an agent i. The demand at each node is updated as the product of the demand factor and the base demand at the node, at each time step.
2.4.6 Initialization and Input
All household agents are initialized as centralized consumer agents and assigned values for lot size, cistern size, and roof area.
2.4.7 Design concepts
households adopt rainwater harvesting. Total runoff and demand volumes determine reservoir volumes, which in turn, influences household adoption rates. Water distribution system hydraulics also exhibit emergent properties based on adoption decisions made by households and the associated changes in demands they exert on the distribution system and their spatial location with respect to the network. Furthermore, water distribution system hydraulics is non-linear due to the governing physical equations of pipe flows and the presence of pumping and storage, which introduce discontinuous and discrete operations.
Consumer agents do not interact directly through word-of-mouth communication or passing messages, but they interact indirectly through a shared resource. Specifically, agents that adopt rainwater harvesting can reduce or increase the need for other agents to change their water use. This is an instance of the tragedy of the commons [45], where incremental decisions of individuals affect resource availability of successive decisions. Agents are located spatially to specify their interactions with the water distribution network at nodes.
the number of homes that adopt rainwater harvesting systems, the reservoir surface level, and water distribution system metrics are recorded.
2.5 Illustrative Case Study: D-Town
A case study is built using data that describes a virtual city, D-Town [97, 65], and is used to demonstrate the ABM framework. Salomons et al. [97] provide the drinking water distribution data and model, and the hydrologic and population data are constructed here. D-Town is placed near Houston, TX, to generate necessary water demand and climate parameters. Each household agent is initialized with three residents per household, based on the average U.S. household size of 2.6 residents [115]. The resulting indoor demand per household is 210 gallons per day, or 6,300 gallons per month. Each household occupies a lot of 8,700 ft2. The roof area is 2000 ft2, and the outdoor area (6,700 ft2) is landscaped using vegetation that requires high irrigation (Cplant = 0.8). Average monthly rainfall depths for the
Houston area and outdoor irrigation demands were obtained from the Texas Water
Development Board Rainwater Harvesting Calculator
Figure 2.3 Monthly rainfall and landscape water requirements for households in D-Town
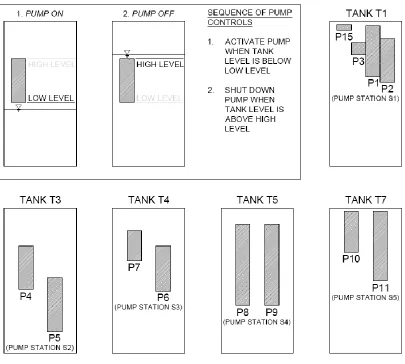
Figure 2.5 Pump operations are controlled by water levels in corresponding tanks. Boxes represent tanks, and shaded bands represent the relative tank levels at which pumps are activated, using rules shown in the legend. Tanks dimensions are normalized, and band of pump operation is shown to scale, with respect to tank dimensions.
2.6 Simulation Results
begin as centralized consumers. An adoption rate of 0.1% is used if the reservoir level is above the control elevation. This means that each month on average 0.1% of the centralized households adopt rainwater harvesting. The adoption rate increases to 2% if the reservoir drops below the control elevation.
2.6.1 Effects on Infrastructure Performance
As centralized consumer agents become adopter agents, the change in demand affects the water distribution system infrastructure, and the impacts are evaluated through hydraulic simulations. Demands show seasonal variability, and demands peak during the month of July due to outdoor demands. The EPANET water distribution model is executed using demands from the month of July to evaluate changes in water distribution network conditions under peak demand conditions. Each simulation is executed using the default simulation duration provided in the model input file of one-week (168 hour). The first 24 simulated hours are used as a warm-up period to allow the system to reach equilibrium, and results are shown based on hydraulics during the last 144 hours of the week (hours 24-168). Demands in July reduce to 65% of the original value by year 20 of simulation (Fig. 2.7), because 78% of the population has adopted rainwater harvesting (shown in Fig. 2.6b).
Figure 2.7 Total demand exerted on the water distribution system is calculated as the sum of all demands over a 144-hour period in July.
range activates both Pumps P6 and P7. In later stages of the simulation, Tank T4 levels transition and fluctuate in a reduced range with a new low level of 3m and a high level of 4m. This operational range uses Pump P7, while Pump P6 remains inactive (Fig. 2.10).
2.6.2 Stochasticity in Simulation
The ABM framework includes a stochastic component, as each agent evaluates the decision to install a rainwater harvesting system based on a random number. The model was executed for five random simulations to evaluate the variation in results, based on the random component. The final state of the system for each of the trials is similar: across the seven tanks, the variation in average water age during the last 144-hour simulation for year 20 is less than 7%, and the variation in the total outflows from each tank is less than 11%. The total outflow from each pump varies less than 5%, except for Pumps P1 and P2, where total outflow among the five trials varies up to 60%. These two pumps interact tightly because the tank levels that activate the two pumps overlap; additionally, these pumps contribute only a small percentage of the volume of water that is pumped at Pump Station S1. The variation in total pumping volume at year 20 for Pump Station S1 is 2.5%, across the five trials.
interconnected to Tank T4, and the pumps and pump station show very little variation in the change of operations across the five simulations (Fig. 2.12). The stochasticity that is inherent in the adoption of rainwater harvesting systems leads to stochasticity in the demands that are exerted over time, but significant variations between simulations are not seen at the level of network pressure zones (represented at tank-pump station combinations). For the simulation runs here, agents have homogeneous attributes and adopt rainwater harvesting systems uniformly, which may generate similar paths among simulation trials. Including realistic values to represent heterogeneity in individual attitudes, behaviors, lot sizes, and roof sizes may create a larger amount of variance among a set of independent simulations.
Figure 2.12 Pump P6 and P7 and Pump Station S3 flows for five simulation trials. Each line represents output from one simulation, which is a 144-hour period simulation in the month of July.
2.7 Sensitivity Analysis 2.7.1 Cistern Size
highest monthly outdoor demand occurs in July and has a value of close to 8,500 gallons. Therefore, a 9,000 gallon cistern provides near-optimal storage volume for this particular maximum monthly outdoor demand, and larger volumes stored by cisterns are not needed in any month.
2.7.2 Adoption Rate
Adoption rates also play a significant role in the dynamics of the recovery of reservoir storage. There are few studies available that report adoption rates for rainwater harvesting systems. Data about the penetration of rainwater harvesting in South East Queensland, Australia reports an increase from 8% of households in 2004 to 40% of households in 2008 [120], corresponding to a 3% monthly adoption rate. Adoption was encouraged through demand management programs and water restrictions initiated in a drought-prone region.
Table 2.1 Impact of adoption rates Run Low Adoption
Rate (%)
High Adoption Rate (%)
Ratio of Increase in Rate between
Low and High values
Effect on Reservoir Levels
1 (Base Case)
0.1 2 20 Stabilize
2 0.1 1 10 Stabilize
3 0.1 0.75 7.5 Stabilize
4 0.1 0.50 5 Decline
5 0.01 2 200 Stabilize
6 0.01 1 100 Stabilize
7 0.01 0.75 75 Decline
Figure 2.15 Change in demands for runs that stabilize reservoir levels.
2.8 Discussion
utilized. An increase in pump starts can increase the required pump maintenance, effecting infrastructure life cycles and maintenance costs. In evaluating the performance of pumps and tanks under changing loading patterns, no modifications were made to component parameters or to operation strategies. As utility managers observe that a system is functioning sub-optimally, they adapt pump and tank operation controls. The ABM framework developed here does not simulate updated control strategies that operators may take, but provides an approach to quantify the change to infrastructure performance that may occur due to consumer decision-making. The framework can be extended to include ABM of utility managers as they adapt operational control strategies, and the framework can be used to assess and optimize infrastructure designs for potential future scenarios where decentralization is expected and new control strategies will be implemented.
Modeling assumptions that have been used can limit the accuracy of the model results. Time-varying demands are represented in the hydraulic water distribution system model using a typical diurnal pattern. The diurnal pattern is retained for households that adopt rainwater harvesting, and the base demand is reduced. Diurnal patterns, however, may change with the adoption of rainwater harvesting systems [60]. More accurate representation of diurnal demands from homes that have adopted rainwater harvesting systems can be developed by adjusting demand multipliers for the periods of a day when outdoor watering is prevalent. Agents are simulated as homogenous; extensions and applications of the framework can explore heterogeneity in household parameters, such as residential density (number of residents per household), socio-economic factors, demographics, water consumption, lot area, roof area, and cistern sizes, based on data about a specific case study to characterize the system more realistically. The population is assumed to remain constant for the duration of the simulation. More accurate representations of population dynamics can be used; the ABM framework provides the capability to dynamically add, or remove, agents during simulation to reflect changes in population and associated changes in number of households. Finally, total household water use is assumed to remain constant. This assumption can be revised by incorporating case-specific data on changes in water use over time due to updating appliances, for example, and by incorporating water use forecast models in the calculation of demands.
and do not possess social ability, proactivity, or intentionality. Social ability describes the ability of agents to communicate and interact with each other; proactivity describes the ability of agents to take the initiative and not only act in a reactive manner; and intentionality refers to having agents simulate aspects of human intentions such as belief, desire and motives [123, 40]. These properties can be added to make the agent decision-making process and behaviors more realistic. To develop agents that can realistically simulate the decision-making process involved in the adoption process requires knowledge and understanding of socio-economic characteristics of the actual community members being simulated, and an understanding of social networks and communication within the community [92]. ABM frameworks described by Panebianco and Pahl-Wostl [87] and Schwarz and Ernst [100] provide examples of developing more realistic social agents to simulate adoption of water savings technology.
2.9 Conclusions
provide in-depth analysis of interactions and their relationship with system-level, or macro, properties. ABM is a natural framework for simulation of emergent properties, which are generated from a bottom-up process.
The ABM framework developed here couples agent-based simulation of household-level adoption of rainwater harvesting systems with engineering models to simulate the dynamic and non-linear interactions between consumers and engineering infrastructure as urban water system transition from centralized to decentralized systems. This research demonstrates the use of ABM to simulate sociotechnical transitions in the water use culture and infrastructure of a community. The application of the framework to a case study demonstrates the ability of the proposed approach to simulate the transition of water system infrastructure systems based on changing household water use behavior. The model serves as a conceptual and explanatory tool that demonstrates an approach to explore the dynamics of water supply. New insight is generated through simulations about possible infrastructure impacts as urban water systems transition towards decentralized systems. The framework provides the basis for further computational modeling to evaluate the performance of management strategies such as operational changes, technological improvements, new directives, and rate changes. The ABM framework can be applied to design operational plans that allow centralized infrastructure to continue to deliver acceptable water services that continue to meet required performance criteria, even during periods of transition.
CHAPTER 3
A Cellular Automata Modeling Framework for Urban Water Reuse Planning and Management
3.1 Abstract
Keywords: complex adaptive system, diffusion of innovation, dual system, sociotechnical transition, urban water management, water reuse
3.2 Introduction
Urban water demands are typically met through withdrawals from nearby freshwater bodies or imported water from neighboring basins. During the 20th century, the growth of the U.S. urban population placed increasing levels of stress on local freshwater supplies, and projections of continued population growth and climate change indicate that pressure on water resources will continue to increase [81]. Tension between urban water supplies and demands necessitates a reexamination of conventional water management strategies, and water reuse may provide an effective alternative to manage demands [4, 96]. Programs that treat and reuse wastewater (also called reclaimed water) typically have one of two purposes: (1) creating a new source of water and reducing demands on freshwater resources and (2) reducing the discharge of nutrient-rich effluent to receiving bodies.
projects, however, pose greater challenges than projects that serve a small number of industrial and governmental customers, as large water reuse projects rely heavily on public acceptance and participation [88, 63], which have been historically negative [95]. In addition, wide-scale projects require an integrated water management approach to coordinate new infrastructure with plans for maintaining and expanding the existing drinking water, storm water, and wastewater infrastructure systems [74], [33].
Transitions in both the existing engineered infrastructure and the water use culture are needed to integrate water reuse in an existing water supply system. The adoption of water reuse technologies and behaviors in a community and the integration of a reclaimed water system within a water supply system are interdependent processes in a sociotechnical transition [38]. Though consumers may be wary of recycled water, studies of reclamation systems in Australia, Florida, and California, which are leaders in implementing water reuse programs, reveal that consumer perceptions towards water reuse can change over time based on increased familiarity, interactions, and experience [13, 31]. As reclamation infrastructure is constructed and reclaimed water services are adopted, hydraulics and flows in drinking and wastewater systems are impacted by reductions in potable demands. Significant changes in these demands can lead to changes in the operation and performance of water distributions systems. Operational settings, maintenance schedules, and capacity expansion plans should be reassessed, since those identified during the design and planning phase might not be optimal anymore due to changed operations [60, 107].
reclamation dual system. This modeling approach simulates consumer reclaimed water adoption and the associated demand changes and emergent hydraulics in both drinking and reclaimed water systems to provide insight for the planning process. A cellular-automata (CA) based model is developed to simulate the dynamic and adaptive process of household adoption of reclaimed water. Development of the CA model draws on theory from the diffusion of innovations [92], which posits that innovations spread through a social system due to both mass media or news coverage and conversations between consumers. As households adopt water reuse, demands that they exert on the potable and reclaimed water systems are updated. The CA model of households is coupled with distribution system models to simulate the expansion of the reclaimed water system and changing hydraulics in the potable water distribution system. The framework is applied to simulate the adoption and establishment of household reclaimed water services within the dual distribution system, in the Town of Cary, North Carolina. Historical data from Cary is used in developing and calibrating the CA model. The CA modeling framework is applied to evaluate water reuse service expansion scenarios and evaluate the associated impacts on existing drinking water and planned reclaimed water infrastructure.
3.3 Diffusion of Innovation for the Adoption of Non-Potable Water Reuse for Residential Application
such as favorable pricing compared to potable water, rebates, and public information campaigns that highlight the environmental and sustainability benefits of water reuse to encourage adoption of water reuse [4]. Social factors play a key role in determining consumer perceptions and attitudes regarding water reuse [13, 31].
The theory of diffusion of innovation [92] provides a framework to study the spread of water reuse within a community and aid in planning for expansion of reclaimed water systems. Diffusion of innovation refers to the wide-spread adoption of new products, ideas, or practices within a community over time. The process of diffusion is characterized as a contagious process that depends on external and internal factors. The external factor is independent of the number of adopters (and potential adopters) and represents the influence of advertising, mass media and public information campaigns. The internal influence factor is a function of the number of adopters and represents the positive influence that adopters have on potential adopters through word-of-mouth communication [10, 55]. The process of diffusion is initially driven by external factors, and, after a certain percentage of the potential adopter population has adopted, internal factors drive the process of adoption. Peer networks are activated, and both positive and negative information is exchanged through social networks. As the number of adopters increases, knowledge about the innovation and the rate of adoption increases cumulatively within the system. Complete diffusion, or saturation, occurs when all of the potential adopters adopt the innovation [19].
more flexible model structure to describe the diffusion process based on the actions and interactions of individual adopters. Individual-based models, such as agent-based models (ABM) and cellular automata (CA) models, can explicitly represent heterogeneity in the adopter population, social structure, and communication networks [55, 37]. CA models are dynamic spatial models for simulating complex adaptive systems, by representing a landscape as a grid of cells [121]. Cells represent the fundamental unit that is used to divide the system space or landscape, and cells are the unit at which computation occurs [32]. A cell is characterized by its state and transitions among states at discrete time steps using a transition rule that is based on state of the cell and the state of its neighboring cells [85]. CA models can simulate the emergence of complex global patterns based on local interactions among neighboring cells [12] and have been used extensively in urban planning because of their ability to represent spatial and temporal processes through a relatively simple and intuitive model structure [98, 102, 11, 119, 12].
agent-agent-based model framework to explore impacts on wastewater conveyance systems with diffusion of decentralized water technologies. Athanasiadis et al. [6] developed an agent-based social model that incorporates an influence diffusion mechanism, integrated with econometric models to simulate residential water use under different policy scenarios. Finally, Berger [14] developed a CA approach to simulate the diffusion of agricultural technology and its impact on irrigation water use. Based on this growing body of research, we have chosen to develop a CA model for the diffusion of water reclamation technology for two reasons. First, it is likely to follow the same kinds of aggregate and individual patterns as other diffused innovations. Second, it matches up well with how utility managers, city planners, and engineers envision the longitudinal process by which water reclamation could be introduced into a municipal water supply system.
distribution systems, and changes in water demands by a household are translated to the assigned node in each distribution system. Cells are assigned attributes to characterize the CA model and to interface with the water distribution system models.
Figure 3.1 Overview of modeling framework. CA model of dual system adoption coupled with water and reclaimed water distribution system models
Design concepts, and Details (ODD) protocol [43], which is a standardized protocol for publishing descriptions of individual-based models. The components of the ODD description are purpose, model elements, process overview, details, and design concepts.
3.4.1 Purpose
The purpose of the CA modeling framework is to simulate (1) the household adoption of reclaimed water and (2) the hydraulics and performance of a dual distribution system that emerge as water users change demands through water reuse.
3.4.2 Model elements
The components of the model are the set of cells, which represent households, and collectively represent a set of neighborhoods that are served by the utility; the potable water distribution system; and the reclaimed water distribution system. Each cell is characterized by its state, as an adopter or potential adopter; a list of neighboring cells; house construction year; year that the lot was connected to the reclaimed water system; household type (single-family residential or multi-(single-family residential); indoor demand; outdoor demand; and corresponding nodes for the potable and reclaimed water distribution systems.
improvements, including new pipes and storage tanks, are added to the pipe network to provide reclaimed water services to additional cells. Each design stage is characterized by the capacity (number of new accounts that can be initiated), the year that the design state is implemented, and a model of the improved distribution system that is used as input for EPANET.
3.4.3 Process overview and scheduling
The model proceeds in annual time steps and executes three steps iteratively, as follows.
3.4.3.1 Step 1: Pass messages and evaluate transition rule
Transition rules are applied at each time step to simulate a cell’s transition from potential adopter to adopter. The transition rules are based on a threshold model [19, 20], which uses the fundamental rule that a potential adopter becomes an adopter once the number of adopter cells, or proportion of adopter cells, within its network reach a minimum level.
Before a cell can transition from a potential adopter to an adopter state, the house should be built, and the reclaimed water network should be available at that cell, or lot, based on the expansion of the reclaimed water distribution system. These conditions are represented mathematically in the model as


![Table 3.1 Average day demand (ADD) and maximum day demand (MDD) assignments [18].](https://thumb-us.123doks.com/thumbv2/123dok_us/1208464.1151768/91.612.87.543.353.588/table-average-demand-add-maximum-demand-mdd-assignments.webp)

