Modification of fractal algorithm for oil spill detection from RADARSAT-1 SAR data
Maged Marghany
*
, Arthur P. Cracknell, Mazlan Hashim
Department of Remote Sensing, Faculty of Geoinformation Science and Engineering, Universiti Teknologi Malaysia, 81310 UTM, Skudai, Johore Bahru, Malaysia
1. Introduction
Synthetic aperture radar (SAR) has been recognized as a powerful tool for oil spill detection. Several algorithms have been introduced to automatically detect oil spills from SAR images. These algorithms involve three steps: (i) dark spot detection, (ii) dark spot feature extraction, and (iii) dark spot classification. Various classification algorithms for oil spill detection have been utilized, including pattern recognition algorithms (Fukunaga, 1990), spatial frequency spectrum gradient algorithm (Lombardini et al., 1989; Teivero et al., 1998) and fuzzy and neural networks based algorithms (Mohamed et al., 1999; Calaberesi et al., 1999). Dark spot detection is done by adaptive thresholding. This step is controlled by wind conditions and the specific type of SAR sensors. In doing so, the sea surface appears dark in SAR images when the wind speeds range between 0 and 2–3 m s1. This allows a probable oil spill detection under low wind speeds. In fact, wind-generated waves are barely developed and oil spill appears as dark features on a dark SAR background. According to Solberg and Volden (1997), the ideal detection of oil spill in SAR images requires moderate wind speeds not exceeding 6 m s1. In these circumstances, sea surface roughness develops and oil slicks appear as dark patches on a bright background in SAR images. In regions of higher wind speeds ranging between 10 and 12 m s1, however, slick disappears from the sea surface and also from the
SAR imagery, because of the redistribution of oil slicks by surface waves and wind-induced mixing in the upper ocean layer.Gade and Redondo (1999) suggested that the highest wind speed threshold for spill detection in SAR images is between 10 and 14 m s1
. Hence oil spill monitoring is limited to the 3–10 m s1 wind speed range (Lu et al., 2000). Threshold procedures, however, have failed to detect thin and linear slicks. Available in situ wind measurements can be used to determine the threshold, whereas local homogeneity can be used to determine the threshold in the absence of in situ wind measurements. In fact, oil spills detection from SAR images is still a major challenge, as other physical phenomena can generate similar dark patches, whereas SAR images are also affected by multiplicative noise known as speckle. In this context, dark patches not related to oil spill are known as look-alikes. They can be due to low wind speed areas, internal waves, biogenic films, grease ice, wind front areas, areas sheltered by land, rain cells, current shear zones, and up-welling zones (Lombardini et al., 1989; Teivero et al., 1998; Calaberesi et al., 1999).
The surrounding sea water around dark spots will appear fairly homogenous under high or medium wind speed. This explains the low possibilities of the presence of oil spill and look-alikes in SAR scenes. Utilization of homogeneity is a function of wind conditions. A large number of oil spill and look-alikes, however, could emerge in SAR imagery with a wind speed below 3 m s1(Teivero et al.,
1998). Detection of oil spill and look-alike features in SAR scenes can be obtained by mean ratio values. The power-to-mean ratio being a general measure of homogeneity is used to adjust the threshold. Various authors (Solberg and Solberg, 1996; Solberg and Volden, 1997; Kanna et al., 2003; Nirchio et al., 2005) A R T I C L E I N F O
Article history:
Received 6 September 2007 Accepted 22 September 2008
Keywords: RADARSAT-1 SAR S2 mode data W1 mode data Oil spill Look-alike Low wind zone Fractal dimension
A B S T R A C T
This paper introduces a modified formula for the fractal box counting dimension. The method is based on utilization of the probability distribution formula in the fractal box count. The purpose of this method is to use it for the discrimination of oil spill areas from the surrounding features, e.g., sea surface and look-alikes in RADARSAT-1 SAR Wide beam mode (W1) and Standard beam mode (S2) data have been collected under different wind speeds. The results show that the new formula of the fractal box counting dimension is able to discriminate between oil spills, look-alike areas and pixels of the size of a single ship. The W1 mode data illustrate an error standard deviation of 0.05, thus performing a better discrimination of oil spills as compared to S2 mode data. We conclude that automatic detection and discrimination of oil spill and other sea surface features can be opertionalized by using the new formula for fractal box counting.
ß2008 Elsevier B.V. All rights reserved.
* Corresponding author.
E-mail addresses:[email protected],[email protected](M. Marghany), [email protected](A.P. Cracknell),[email protected](M. Hashim).
Contents lists available atScienceDirect
International Journal of Applied Earth Observation and
Geoinformation
j o u r n a l h o m e p a g e : w w w . e l s e v i e r . c o m / l o c a t e / j a g
have reported that for RADARSAT-1 SAR thresholding is done at three different scales. Using three different scales, however, did not work well for ENVISAT due to its larger pixel size.
A new approach has been introduced by Maged (2001) to detect thin and linear slicks by using the Lee algorithm (Touzi, 2002). The Lee filter is primarily used on radar data to remove high frequency speckles without removing edges or sharp features from the images. Maged and van Genderen (2001)
reported that the Lee algorithm operates well to determine linear slick features. According to Maged (2001), the Lee algorithm avoids a decreasing resolution by making a weighted combination of a running average with neighbour pixels. This reduces the noise in the edge areas of slicks without sacrificing edge sharpness. Recently, Huang et al. (2005) explored segmentation of oil slicks using a partial differential equation (PDE)-based level set method with ERS-2 SAR data. They concluded that the level set method allows an extraction of smooth and ideal boundaries rather than a number of zigzag edges. This method, however, failed to distinguish between oil slicks and dark spot areas that were located close to the coastline, due to low wind speed. In fact this method produced automatic snake contours around the presence of dark spot areas in SAR imagery. Furthermore,Maged and van Genderen (2001)introduced a new approach by using texture algorithms for automatic detection of oil spills in a RADARSAT-1 SAR image. In fact, grey-tone spatial-dependence or co-occurrence matrices provide the basis for a number of measures including range, variance, standard deviation, entropy, or uniformity within a moving kernel window (Tricot, 1993). Computing the texture features from a co-occurrence matrix, however, may become critical due to multiplicative noise impacts. Different approaches to texture identification have been introduced that involve exploiting the fractal algorithm that can be applied to a multi-resolution representation of SAR images. Fractal analysis provides tools for measuring how the geometric complexity of objects on images such as the number of discrete objects, the perimeter to area ratio, and the degree of spatial auto-correlation changes when the image resolution is altered. The main question that we address in this paper is how the fractal algorithm can be used to discriminate between oil spills and look-alikes in RADARSAT-1 SAR data.
2. Fractal analysis and SAR data
According toRedondo (1996)fractal geometry can be used to discriminate between different textures. A fractal refers to entities, especially sets of pixels that display a degree of self-similarity at different scales. Self-similarity is the foundation for fractal analysis, which is applied to a group of pixels intensities with the same trend of variation. It is defined as a property of a curve or surface where each part is indistinguishable from the whole, or where the form of the curve or surface is invariant with respect to scales. In this case, the curve or surface consists of copies of itself at different scales.
The best known procedures for estimating the fractal dimension of SAR images are box counting, fractal Brownian motion (Falconer, 1990; Gade and Redondo, 1999; Benelli and Garzelli, 1999a,b) and the fractal interpolation function for system dimension of images (Aiazzi et al., 2001). Initially,
Falconer (1990) introduced the fractional Brownian motion model with SAR image intensity variation, which has shown promise in the SAR data textures. In fact, both the sea surface and its backscattered signal in the SAR data can be modeled as fractals (Wornell and Oppenheim, 1992; Maragos and Sun, 1993; Benelli and Garzelli, 1999a,b; Aiazzi et al., 2001).
By contrast, Gade and Redondo (1999) found that a box counting fractal dimension model provided excellent discrimina-tion between oil spills and look-alikes, although they did not consider the backscatter information, which could allow a first robust localization of the oil spills.Benelli and Garzelli (1999a,b)
used a multi-resolution algorithm, which was based on the fractal geometry for texture analysis. They found that the sea surface is characterized by an approximately steady value of the fractal dimension, whereas oil spills have a different average fractal dimension compared to look-alikes.
This main hypothesis is the fact of modelling as fractals the SAR backscattered signal from dark spot areas, being either oil spill or look-alike pixels, and their surrounding sea environment. In this context, a box-counting fractal estimator can be used as a semiautomatic tool to discriminate between oil spills, look-alikes and surrounding sea surface waters. In addition, utilization of a probability density formula in the box-counting equation can improve the accuracy of discrimination between oil slick pixels and surrounding feature pixels such as ocean surface and look-alikes. In doing so, this study extends the previous theory of fractal dimension by implementing a probability density formula. In addition, it uses two different RADARSAT-1 SAR beam mode data, i.e. the Wide beam mode (W1) and the Standard beam mode (S2).
3. Methodology
3.1. Data set
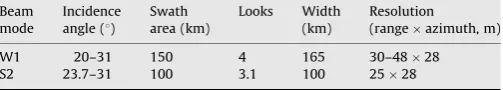
SAR data acquired in this study were derived from the RADARSAT-1 images that involve Wide beam mode (W1) and Standard beam mode (S2) images, respectively. Both images are C-band and have a lower signal-to-noise ratio due to their HH polarization with a wavelength of 5.6 cm and a frequency of 5.3 GHz. RADARSAT-1 W1 mode data have four independent looks and cover incidence angles of 20–318 (RADARSAT International, 2006), whereas S2 mode data have 3.1 looks and cover an incidence angle of 23.7–31.08 (RADARSAT International, 2006). Further, W1 data and S2 mode data cover a swath width of 165 and 100 km, respectively, and have different azimuth and ground range resolution (Table 1). Both
Mohamed et al. (1999) andHashim et al. (2006)reported the occurrence of oil spill pollution on 15 December 1997 and 20 December 1999, respectively, along the coastal water of the Malacca Straits.
3.2. Fractal algorithm for the oil spill identification
The oil slick detection tool uses fractal algorithms to detect self-similarity characteristics. A box-counting algorithm introduced by
Benelli and Garzelli (1999a,b)divided a convoluted line of slick embedded in the RADARSAT-1 SAR image plane (i,j), into smaller boxes. This was done by dividing the initial length of the convoluted slick line at backscatter level
b
s by the recurrence level of the iteration (Gade and Redondo, 1999). We define a decreasing sequence of backscatteringb
s tending fromb
0, theTable 1
RADARSAT-1 SAR Wide beam mode (W1) and Standard beam mode (S2) characteristics.
Beam mode
Incidence angle (8)
Swath area (km)
Looks Width
(km)
Resolution (rangeazimuth, m)
W1 20–31 150 4 165 30–4828
largest value, to less than or equal to zero. The fractal dimensionD
(bs) as a function of the RADARSAT-1 SAR image intensity
b
sis given byDð
bs
Þ ¼DB¼lim s! 1logMð
bs
Þ logðb
sÞ(1)
whereM(bs) denotes the number of boxes needed to cover the various slick areas with different backscatter intensitybs in the RADARSAT-1 SAR images. The number of boxes of side lengthls needed to cover a fractal profile, varies as
b
Ds , where Dis the fractal dimension that is to be estimated. If the sampled profile is a fractal object, then M(bs) is proportional tob
D
s . Therefore, the following relation, adopted fromMilan et al. (1993), should be satisfied:
Mð
b
sÞ ¼Cb
Ds (2)
whereCis a positive constant, derived from a linear regression analysis between logM(bs) and log(bs). For different box sizes
b
s, points are plotted in the log-log plane. The dimensionD(bs) =DB can then be estimated (Milan et al., 1993).According to Sarkar and Chaudhuri (1994), a complication occurs when computingD(bs) with Eq. (1), due to the discrete RADARSAT-1 SAR images surfaces. Therefore, approximations to this relationship are employed. First, the RADARSAT-1 SAR intensity image is treated as a two-dimensional matrix (b
b).
Thisb
b
intensity image matrix is then divided into overlapping or abutted windows of sizelsls. For each window, there is a column of accumulated boxes, each of size ofl2sl. The backscatter values
b
0are stored at each intersection of the columniand rowj of the various slick areas. Then l is calculated by using the differential box counting proposed by Sarkar and Chaudhuri (1994):bs
l ¼
b
ls
(3)
Let the minimum and maximum (bs) in the (i,j) window fall into boxes numberednandm. The total number of boxes needed to cover the various slick pixels in the RADARSAT-1 SAR image with the box sizels2lequals:
Mð
bs
Þ ¼X li;j
nð
b0
Þ mðbs
Þ þ1 (4)LetP[M(bs),ls] be the probability of the total number of box M(bs) with box sizes ls. This probability should be directly proportional to the number of boxes Pli;jnð
b
0Þ mðb
sÞ þ1 spanned on the (i, j) windows. By using Eq. (4) the expected number of boxes with sizelsneeded to cover the slick pixels can be calculated asMð
b
sÞ ¼X
i;j 1
nP½Mð
b
sÞ;ls (5)According toFiscella et al. (2000), the probability distribution of the dark area belonging to slick pixels can be calculated as
P½Mð
bs
Þ ¼1þQ
nqnðMð
bs
ÞÞ pnðMðbs
ÞÞ(6)
Letn¼Pli;jnð
b0
Þ mðbs
Þ þ1, and letqandpbe the probability distribution functions for look-alike and oil spill pixel areas, respectively. From Eqs.(5), (6) and (1), one obtains a new formula for estimating the fractal dimensionDB:Dð
bs
Þ ¼DB¼lim s! 1logPi;jn1½1þQ
nqnðMð
bs
ÞÞ=pnðMðbs
ÞÞlogð
bs
Þ (7)In practice, the limit forMgoing to zero cannot be taken as it does not produce a texture image for oil spills or look-alikes in SAR data. Using fractal dimensions to quantify texture for segmentation, we divide the slick’s pixel areas into overlapping sub-images. Each sub-image is centred on the pixel of interest. We then estimate the fractal dimension D(bs) within each sub-image, and assign the fractal dimension value to the central pixel of each sub-image. This produces a texture image that may be used as an additional feature in a slick pixel classification.
Prior to the fractal application to the amplitude RADARSAT-1 SAR data, a radiometric correction has been performed. The radiometric correction establishes a constant correlation between intensity in the SAR data and backscatter from the oil spill pixels. This results into the oil spill pixel targets with the same intensity, regardless of their position within the RADARSAT-1 SAR image swath (Maged and Mazlan, 2005). The digital number is then converted into the normalized radar cross-section
s
8and incident angle to determine the spatial variation of oil spill pixels, being a function ofs
8and the incident angle. ENVI software was used in estimatings
8and the incident angle.4. Results
The RADARSAT-1 SAR images contain the confirmed oil-spills which occurred near the west coast of Peninsular Malaysia on 26 December 1997 and 20 December 1999, respectively (Fig. 1). The RADARSAT-1 W1 mode data covered an area located in between 102803009.700E to 103835023.600E and 1810030.200N to 2820.23030.200N while S2 mode data covered an area located between 101818023.700E to 101836027.800E and 2832046.200N to 2850050.500N.
Fig. 2 shows the variation of the average backscatter intensity along the azimuth direction in the oil-covered area as a function of the incidence angle for the W1 and S1 mode data. The back-scattered intensity is damped by8 to18 dB in W1 and10 to
18 dB in S2 mode data. Both backscatter intensities are above the RADARSAT-1 noise floor value of nominally20 dB.
The wind speed conditions acquired from the Malaysian Meteorological Survey Department showed a maximum offshore wind speed velocity of 4.11 m s1during the W1 data overpass and of 7 m s1during the acquisition of the S2 data. In addition, the oil spill in W1 data with steeper incidence angle is between 268and 308(Fig. 2), whereas in the S2 mode data the oil spill is portrayed by shallower incidence angle, between 258
and 278.
The proposed method to estimate the fractal dimension has been applied to the amplitude RADARSAT-1 SAR data by using a 1010 block at full resolution (Fig. 3). The fractal dimension maps show a good discrimination between different textures on the RADARSAT-1 SAR images and correlate well with image texture regions. The oil spill pixels are dominated by lower fractal values than look-alikes and surrounding environment (Fig. 3). In Fig. 3a, the fractal values of oil spill regions vary between 1.48 and 2. In Fig. 3b, however, a reduction in the maximum fractal dimension of oil spill at area C in S2 data occurs as compared to W1 data where the fractal dimension value is 1.57. This is probably caused by the short span of oil spill in the S2 mode data and could attributed to the spatial variation of S2 mode data reflectivity as a function of shallower incidence angle (Fig. 2) and smaller swath area compared to the W1 mode data (Table 1). In contrast to the W1 mode data, the fractal dimension values of look-alikes in the S2 mode data are higher. In the S2 mode data, areas F and E are represented the occurrence of look-alikes.Table 2shows that area F corresponds to a fractal dimension value equal to 3.0, whereas area E corresponds to a fractal dimension equal to 2.6. In both modes, the highest fractal dimension values of 3.9 and 4.0 in areas I and G, respectively, are represented by the presence of a ship, whereas ship waves have lower fractal dimension values between 2.4 and 3.6 in area H in both S2 and W1 mode data, respectively (Table 2). Furthermore, the occurrence of shear current flow can be seen in areas J, K and L, respectively. In both modes, area L corresponds to the maximum fractal value of 3.9 (Table 2).
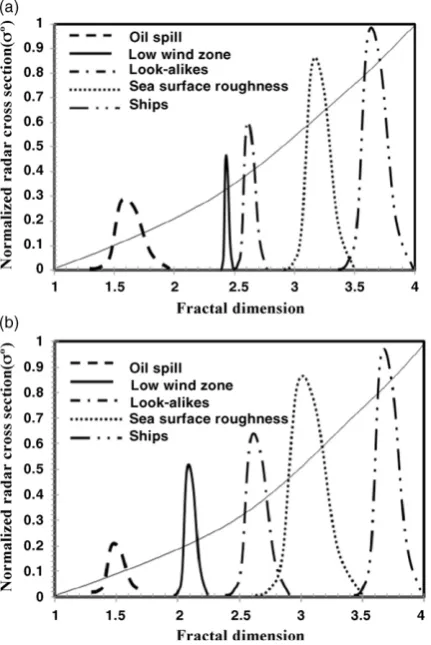
Both modes further show that low wind zones in areas M, N and O occur close to the coastline with a maximum fractal values equal to 2.34 and 2.5 in area O in S2 and W1 mode data, respectively (Fig. 3). Look-alikes occupy narrow areas parallel to the coastline (Fig. 3b). Further, in W1 mode data, the sea surface roughness has a fractal value of 3.2 and a normalized radar cross-section of 0.85 whereas the oil spill pixels have fractal dimension values between
1.5 and 1.56 and a normalized radar cross-section 0.2 and 0.29 in S2 and W1 mode data, respectively (Fig. 4).
The receiver–operator-characteristics (ROC) curve in Fig. 5
indicates significant differences in the discrimination between oil Fig. 2.Radar cross-section intensity along oil slick locations (dash lines were drawn
in figure) and wind speed distribution during date of acquisitions.
Fig. 3.Fractal map for RADARSAT-1 SAR (a) W1 mode data and (b) S2 mode data.
Table 2
Fractal values for different features in RADARSAT-1 SAR Wide (W1) and Standard (S2).
Area Fractal dimension
RADARSAT-1 SAR (W1) RADARSAT-1 SAR (S2)
Oil spill
A 1.48 1.49
B 1.52 1.52
C 2.0 1.57
Look-alike
D 2.5 2.4
E 2.6 2.6
F 2.8 3.0
Ship
G 4.0 4.0
H 3.6 2.4
I 3.9 3.9
Shear current
J 3.7 3.8
K 3.8 3.9
L 3.9 3.9
Low wind zone
M 2.4 1.57
N 2.4 2.00
spill, look-alikes and sea surface roughness pixels. For the ROC curve, this evidence is provided by an area difference of 15% for oil spill and 45% for the sea roughness and a p value below 0.05. Further,Fig. 6shows an exponential relationship between fractal dimension and the standard deviation of the estimation error for the fractal dimension. The maximum error standard deviation is 0.45, corresponding to the fractal dimension value of 2.9 which is found in S2 mode data. For oil spill detection, the minimum error standard deviation of 0.05 (Fig. 6) occurs in a region of fractal dimension of 1.49 in W1 mode data.
5. Discussion
The results show the potential of RADARSAT-1 SAR data for oil spill detection where RADARSAT-1 SAR C-band HH-polarized backscatter depression across oil spill pixels agrees satisfactorily with previously published results (Mohamed et al., 1999; Lu et al., 2000; Maged and van Genderen, 2001; Maged and Mazlan, 2005; RADARSAT International, 2006). In fact, RADARSAT-1 SAR is a C band instrument with a variable acquisition swath, presenting a large variety of possible incidence angles, swath width, and resolution (RADARSAT International, 2006). Oil slicks can be detected with a contrast as small as 4 dB (Kotova et al., 1998; Farahiday et al., 1998; Lu et al., 2000). This suggests that a large part of the RADARSAT-1 SAR swath could be useful for oil slick detection. Nevertheless,Ivanov et al. (2002)reported that the RADARSAT-1 SAR in its ScanSAR Narrow mode with swath width above 300 km, is attractive for marine oil pollution detection.
In both modes fractal dimension values of look-alikes are different. This could be attributed to the long span of look-alikes in S2 mode data. Furthermore, area L corresponds to maximum fractal value of 3.9 in both modes (Table 2). This could be attributed to strong current occurrence (Maged and Mazlan, 2005). It is interesting to discover that the fractal dimension algorithm based probability is able to extract ship wake information in area H with highest value of 3.6 in W1 mode data. This suggests that the corresponding value of the fractal dimension for different categories allows a multi-fractal characterization of different features in different RADARSAT-1 SAR modes. These results confirm the study ofMaged and Mazlan (2005).
It is interesting to note that the new fractal dimension formula is able to detect oil spill spreading. According toMaged and Mazlan (2005), the oil spill becomes thinner when the fractal dimension value increases. This can be noticed in areas A to C (Fig. 3). In fact, a thick oil spill dampens small-scale waves and therefore there is no Bragg resonance, which reduced the roughness of sea surface as compared to a thin oil spill (Bern et al., 1993). In this context, the fractal dimension is a function of sea surface level intensities over the RADARSAT-1 SAR images which express the self-similarity (Benelli and Garzelli, 1999a,b).
The maximum fractal value of 4.0 is observed for the group of ship pixels. This suggests that the strong amplitude of variation in RADARSAT-1 SAR images can be mapped as fractal discontinuities and that small objects like ships can be detected. This confirms the study ofMaged and Mazlan (2005). In fact, the sea surface can be considered as a fractal object. According toFalconer (1990), the Fig. 4.Fractal dimension curve for different features in RADARSAT-1 SAR (a) W1
mode data and (b) S2 mode data.
Fig. 5.ROC Curve for different feature detection in both RADARSAT-1 SAR data.
slope measure of fractal objects corresponds to the complexity of the objects, with the natural implication that the sea surface would have a steady value (Figs. 3 and 4). There appears to be a reduction in the maximum fractal dimension of the oil slick compared to that of the look-alikes. This could be due to the short spatial extent of the oil spill as shown in S2 mode data. Also a large difference of 2.6 in fractal values occurs between the maximum peaks of look-alike and oil spill, in both modes (Fig. 5). Therefore, oil spills have lower normalized radar cross-section in both RADARSAT-1 SAR mode data as compared to the surrounding sea surface environments, sea surface roughness, low wind zone and look-alikes (Fig. 4). This could be attributed to an exponential relationship between fractal surface and normalized radar backscatter cross-section (Fig. 4) (Bertacca et al., 2005). Further, in both modes the wide distribution of dark zone pixels represents the natural slick in low wind areas (Henschel et al., 1997), which is aligned with what could be a current shear or convergence zone.
The validation of the new fractal formula can be discussed by ROC and error standard deviation results. ROC suggests best discrimination between oil spill and surrounding sea environ-ments which confirms the study ofMaged and Mazlan (2005). The reason is that the fractal dimension can be viewed as a measure of the scale of the self-similarity of the object. Also the interference is statistically similar if the scale is reduced, which is similar to the result ofBertacca et al. (2005). This suggests that a fractal analysis is a good method to discriminate regions of oil slick from surrounding water features.
Using this new approach, we have reached a lowest error standard deviation in W1 mode data as compared to S2 mode data. This means that W1 mode data perform better for detection of oil spill as compared to S2 mode data. In fact, W1 mode data show steeper incident angle of 308than S2 mode data. According to
Maged and Mazlan (2005), steeper incidence angles are preferred for oil spill detection since they tend to maximize the signal from the ocean surface. The offshore wind speed during W1 mode data overpass was 4.11 m s1
whereas the offshore wind speed was 7 m s1during S2 mode data overpass. In fact, wind speeds bellow 6 m s1 are appropriate for detection of oil spill in SAR data (Solberg and Volden, 1997). Therefore, steep incidence angles are preferable for applications that require imaging of the ocean surface as there is a greater contrast of backscatter manifested at the ocean surface.
The fractal-modified formula leads to a good discrimination between oil spill, look-alike, low wind zone and sea surface roughness when the error standard deviation is situated between 0.05 and 0.45. The reason is that the fractal dimension is a measure of the scale of the self-similarity of the object. The low standard deviation error value of 0.05 for fractal area value equal to 1.49 dominated by the oil spill is lower than that for the surrounding sea. This is thus an excellent indicator for the validation of the fractal formula modification by implementing a probability distribution function (PDF).
Use of the fractal dimension based on the probability distribution function (PDF) improves the discrimination between oil spill, look-alikes, sea roughness and low wind zones. In fact, involving the PDF formula into the fractal dimension map directly relates textures at different scales to the fractal dimension. Such modification of the fractal equation reduces the problems of speckle and sea clutter and assists in the accurate classification of different textures for SAR images.
6. Conclusions
This work has demonstrated a new method to utilize RADARSAT-1 SAR imagery for oil slick detection. Two different
RADARSAT-1 SAR beam modes are used: Wide beam mode data (W1) and Standard beam mode data (S2). A fractal dimension algorithm was used as an automatic tool to discriminate between an oil slick and other surface features such as slick look-alikes and variability of surface roughness. The oil spill has fractal dimension values between 1.49 and 1.57 in both modes. The sea surface roughness has a fractal dimension value of 3.5. Oil spill, look-alikes and sea surface roughness are discriminated well based on the ROC curve. W1 mode data have a lower standard deviation error of 0.05 for oil spill detection than S2 mode data due to the steeper incidence angle of 26–308and a moderate offshore wind speed of 4.11 m s1during the satellite overpass. In conclusion, the modified formula of the fractal box counting dimension has improved distinction of oil spill from the surrounding sea surface feature. This new approach can be used as an automatic tool to distinguish oil spill from other sea surface features.
References
Aiazzi, B., Alparone, L., Baronti, S., Garzelli, A., 2001. Multiresolution estimation of fractal dimension from noisy images. SPIE-IS&T Journal of Electronic Imaging 10, 339–348.
Benelli, G., Garzelli, A., 1999a. A multi-resolution approach to oil-spills detection in ERS-1 SAR images. Image and Signal Processing for Remote Sensing 4, 145– 156.
Benelli, G., Garzelli, A., 1999b. Oil-spill detection in SAR images by fractal dimension Estimation. In: Proceedings of Geoscience and Remote Sensing Symposium, 1999, IGARSS’99. Hamburg, Germany, 28 June–2 July 1999. IEEE Geoscience and Remote Sensing Society, USA, vol. 2, pp. 1123–1126.
Bern, T.I., Wahl, T., Anderssen, T., Olsen, R., 1993. Oil spill detection using satellite based SAR; experience from a field experiment. Photogrammetric Engineering and Remote Sensing 59, 423–428.
Bertacca, M., Berizzi, F., Mese, E.D., 2005. A FARIMA-based technique for oil slick and low-wind areas discrimination in sea SAR imagery. IEEE Transactions on Geosciences and Remote Sensing 43, 2439–2484.
Calaberesi, G., Del Frate, F., Lightenegger, J., Petrocchi, A., Trivero, P., 1999. Neural networks for the oil spill detection using ERS-SAR data. In: Proceedings of Geoscience and Remote Sensing Symposium, 1999, IGARSS’99. Hamburg, Germany, 28 June–2 July 1999. IEEE Geoscience and Remote Sensing Society, USA, vol. 1, pp. 215–217.
Farahiday, I., Suryono, G.F., Arvelyna, Y., 1998. Utilization of RADARSAT SAR data for oil slick detection and vessel ship monitoring application: ADRO 630 Project. In: GIS and Remote Sensing Year Book, Academic press, New York, BPPT 97/98. Fiscella, B., Giancaspro, A., Nirchio, F., Pavese, P., Trivero, P., 2000. Oil spill detecting
using marine SAR images. International Journal of Remote Sensing 12 (18), 3561–3566.
Falconer, K., 1990. Fractal Geometry. John Wiley & Sons, New York.
Fukunaga, K., 1990. Introduction to Statistical Pattern Recognition, 2nd ed. Aca-demic Press, New York.
Gade, M., Redondo, J.M., 1999. Marine pollution in European coastal waters mon-itored by the ERS-2 SAR: a comprehensive statistical analysis. In: Proceedings of Geoscience and Remote Sensing Symposium, 1999, IGARSS’99. Hamburg, Germany, 28 June–2 July 1999. IEEE Geoscience and Remote Sensing Society, USA, vol. 2, pp. 1375–1377.
Hashim, M., Ibrahim, A.L., Ahmad, S., 2006. Mapping and identifying oil spill occurrences in Malaysian Water (Straits of Malacca and South China Sea) using 2000–2005 archived Radarsat-1 SAR. In: Evaluation Report. Department of Remote Sensing, Universiti Teknologi Malaysia, Skudai, Malaysia, 20 pp., unpublished.
Henschel, M.H., Olsen, R.B., Hoyt, P., Vachon, P.W., 1997. The ocean monitoring workstation: experience gained with RADARSAT. In: Proceedings of Geo-matics in the Era of RADARSAT, Canadian Center of Remote Sensing. Canadian Center of Remote Sensing, Ottawa, Canada, 25–30 May CD-ROM proceedings (1997).
Huang, B., Li, H., Huang, X., 2005. A level set method for oil slick segmentation in SAR images. International Journal of Remote Sensing 26, 1145–1156.
Kanna, T., Tonye, E., Mercier, G., Onana, V.P., Ngono, J.M., Frison, P.L., Rudant, J.P., Garello, R., 2003. Detection of oil slick signatures in SAR images by fusion of hysteresis thresholding responses. In: Proceedings of Geosciences and Remote Sensing Symposium, 2003, IGARSS’03. Toulous, France, 8 June–12 June. IEEE Geosciences and Remote Sensing Society, USA, vol. 3, pp. 2750– 2752.
Kotova, L., Espedal, H.A., Johannessen, O.M., 1998. Oil spill detection using space-borne SAR: a brief review. In: Proceedings of 27th International Symposium on Remote Sensing Environmental, Norwegian Defence Research Establishment, Tromsø, Norway, 8–12 June, pp. 791–794.
characterization with microwave probe. Journal of Atmospheric and Oceanic Technology 6, 882–890.
Lu, J., Kwoh, L.K., Lim, H., 2000. Mapping oil pollution from space. Backscatter (February), 23–26.
Ivanov, A., He, M., Fang, M.Q., 2002. Oil spill detection with the RADARSAT SAR in the waters of the Yellow and East Sea. In: A case study CD of 23rd Asian Conference on Remote Sensing. Nepal, 13–17 November. Asian Remote Sensing Society, Japan, vol. 1, pp. 1–8.
Maragos, P., Sun, F.K., 1993. Measuring the fractal dimension of signals: morpho-logical covers and iterative optimization. IEEE Transactions Signal Processing 41, 108–121.
Maged, M., 2001. RADARSAT automatic algorithms for detecting coastal oil spill pollution. International Journal of Applied Earth Observation and Geoinforma-tion 3, 191–196.
Maged, M., van Genderen, J., 2001. Texture algorithms for oil pollution detection and tidal current effects on oil spill spreading. Asian Journal of Geoinformatics 1, 33–44.
Maged, M., Mazlan, H., 2005. Simulation of oil slick trajectory movements from the RADARSAT-1 SAR. Asian Journal of Geoinformatics 5, 17–27.
Mohamed, I.S., Salleh, A.M., Tze, L.C., 1999. Detection of oil spills in Malaysian waters from RADARSAT Synthetic Aperture Radar data and prediction of oil spill movement. In: Proceeding of 19th Asian Conference on Remote Sensing. Hong Kong, China, 23–27 November. Asian Remote Sensing Society, Japan, vol. 2, pp. 980–987.
Milan, S., Vachav, H., Roger, B., 1993. Image Processing Analysis and Machine Vision. Chapman and Hall Computing, New York.
Nirchio, F., Sorgente, M., Giancastro, A., Biaminos, W., Parisatos, E., Raveras, R., Trivero, P., 2005. Automatic detection of oil spill from SAR images. International Journal of Remote Sensing 26, 1157–1174.
Sarkar, N., Chaudhuri, B.B., 1994. An efficient differential box-counting approach to compute fractal dimension of image. IEEE Transactions on Systems Man and Cybernetics 24, 115–120.
Solberg, A.H.S., Solberg, R., 1996. A large-scale evaluation of features for automatic detection of oil spills in ERS SAR images. In: International Geoscience and Remote Sensing Symposium’96. Lincoln, Nebraska, 27–31 May. IEEE Geoscience and Remote Sensing Society, USA, vol. 3, pp. 1484–1486. Solberg, A.H.S., Volden, E., 1997. Incorporation of prior knowledge in automatic
classification of oil spills in ERS SAR images. In: International Geoscience and Remote Sensing Symposium’97. Singapore, 3–8 August. IEEE Geoscience and Remote Sensing Society, USA, vol. 1, pp. 157–159.
Redondo, J.M., 1996. Fractal description of density interfaces. Journal of Mathe-matics and its Applications 5, 210–218.
RADARSAT International, 2006. RADARSAT Applications (http://www.rsi.ca/March 3, 2006).
Teivero, P., Fiscella, B., Gomez, F., Pavese, P., 1998. SAR detection and cheracterisa-tion of sea surface slicks. Internacheracterisa-tional Journal of Remote Sensing 19, 543–548. Tricot, C., 1993. Curves and Fractal Dimension. Springer Verlag.
Touzi, R., 2002. A review of speckle filtering in the context of estimation theory. IEEE Transactions on Geoscience and Remote Sensing 40, 2392–2404.