KRIPAKARAN, PRAKASH. COMPUTATIONAL APPROACHES FOR DECISION SUP-PORT IN STRUCTURAL DESIGN AND PERFORMANCE EVALUATION. (Under the di-rection of Dr. Abhinav Gupta).
Structural design and performance evaluation involves complex decision-making tasks that
are both time and cost intensive. Decision Support Systems (DSS) that combine engineer
inter-action with computer-based tools to provide a joint-cognitive decision-making environment can
significantly help engineers. In this study, three different computational approaches that can
become part of such a DSS are proposed. Two of these approaches use simulation-based design
to assist engineers with the design of (1) bridge trusses and (2) moment-resisting steel frames,
and the third is intended for internet-enabled remote control and observation of experimental
facilities. A hybrid optimization approach that is composed of two algorithms - an algorithm
that generates a good starting solution and a local search, is proposed for truss optimization.
The performance of the approach is compared with existing optimization approaches. Then, a
GA-based optimization approach is presented for the design of moment-resisting steel frames
with rigid connections. The GA uses a unique crossover scheme to perform trade-off study
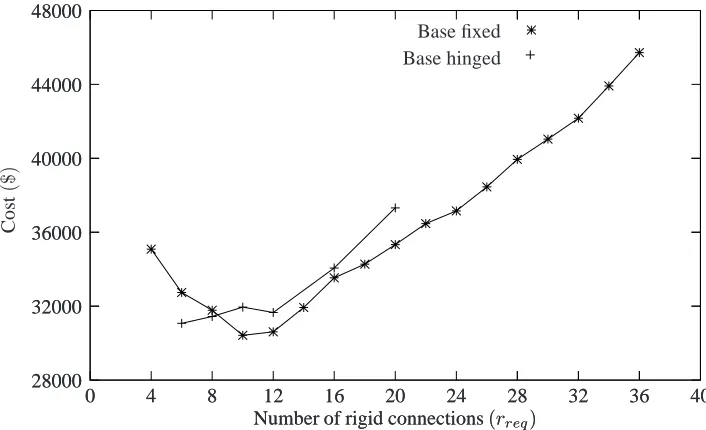
between the number of rigid connections and the total cost. It is observed from the trade-off
study that the total cost of the frame is minimum when using only a few rigid connections if
they are placed at certain locations in the frame. “Modeling to Generate Alternatives - MGA” is
used to generate good design alternatives that may be more suitable for design than the optimal
solution. A generic computational framework for internet-enabled remote control and
obser-vation of laboratory experiments is proposed. The framework is illustrated for a shaketable
Biography
Acknowledgments
I would like to thank my advisor, Prof. Abhinav Gupta, for giving me the opportunity to perform graduate research at North Carolina State University. His guidance and support played a significant role in the successful completion of my study. I would like to thank Prof. J. W. Baugh Jr., Prof. G. M. Kumar and Prof. E. D. Brill Jr. for serving on my graduate committee and for their valuable comments and suggestions on the research. I would like to thank Dr. Vernon Matzen with whom I interacted on several occasions during the work on remote control and observation of laboratory experiments. I would also like to thank Brian Hall for his help during the study on moment-resisting steel frames.
I would like to express my gratitude to the helpful staff of the department of civil engineer-ing. I have made many friends during my time at NCSU. I have enjoyed their company and appreciate all their help.
Table of Contents
List of Tables vii
List of Figures ix
I
INTRODUCTION
1
1 Introduction . . . 2
2 Design of Bridge Trusses . . . 3
3 Design of Moment-Resisting Steel Frames . . . 3
4 Remote Operation of Laboratory Experiments . . . 4
5 Objectives and Proposed Research . . . 5
5.1 Design of Bridge Trusses . . . 5
5.2 Design of Moment-Resisting Steel Frames . . . 6
5.3 Remote Operation of Laboratory Experiments . . . 7
6 Organization . . . 8
References . . . 9
II
NOVEL OPTIMIZATION APPROACHES FOR TRUSS
MOD-ELS WITH REAL-WORLD COST FUNCTIONS
12
1 Introduction . . . 142 Definition of Truss Optimization Problem . . . 15
3 Sizing Algorithm . . . 17
3.1 Clustering . . . 18
3.2 Algorithm 1 - Clustering to Generate Starting Solution . . . 18
3.3 Algorithm 2 - Local Search . . . 20
4 Sizing Algorithm Validation . . . 21
4.1 Real-World Truss Problem: 21-Bar Truss Example . . . 21
5 Minimum-Weight Truss Problem: 10-Bar Truss Example . . . 24
6 Geometry Optimization Algorithm . . . 25
7 Performance of Geometry Optimization Algorithm . . . 26
8 Summary and Conclusions . . . 28
III
GENETIC ALGORITHMS FOR DESIGN OF
MOMENT-RESISTING STEEL FRAMES
45
1 Introduction . . . 47
2 Problem Definition . . . 49
3 Optimization Approach . . . 51
4 Algorithm for Least-Weight Frame . . . 52
5 GA Implementation . . . 53
5.1 Fitness Evaluation . . . 53
5.2 Seeding in GA . . . 55
5.3 GA Operators . . . 55
6 Plane Frame Example - Description . . . 56
7 Results . . . 57
8 Generating Design Alternatives . . . 59
9 MGA for Moment Frame Design . . . 60
10 Summary and Conclusions . . . 62
References . . . 64
IV
COMPUTATIONAL FRAMEWORK FOR REMOTELY
OPER-ABLE LABORATORIES
86
1 Introduction . . . 882 Shaketable Experiment . . . 90
3 Hardware Setup of Framework . . . 92
4 Software Architecture . . . 93
4.1 Data Acquisition and Control . . . 93
4.2 Video Acquisition . . . 95
5 Web Architecture . . . 97
5.1 User Authentication . . . 98
5.2 Experiment Scheduling . . . 99
5.3 Single-User Control . . . 100
5.4 Multi-User Observation . . . 101
5.5 Experiment Administration . . . 102
6 Summary and Conclusions . . . 102
References . . . 104
V
SUMMARY, CONCLUSIONS AND RECOMMENDATIONS FOR
FUTURE RESEARCH
114
1 Summary and Conclusions . . . 1151.1 Design of Bridge Trusses . . . 115
1.2 Design of Moment-Resisting Steel Frames . . . 116
1.3 Remote Operation of Laboratory Experiments . . . 116
2 Recommendations for Future Research . . . 117
2.1 Design of Bridge Trusses . . . 117
List of Tables
PART II - OPTIMIZATION APPROACHES FOR TRUSS MODELS
WITH REAL-WORLD COST FUNCTIONS
1 Product details: 21-bar truss . . . 32
2 Material properties - 21-bar truss . . . 33
3 Dead load details - 21-bar truss . . . 33
4 Live load details - 21-bar truss . . . 33
5 Optimal solution for the 21-bar truss shown in Figure 2 . . . 33
6 Details of the GA runs for the 21-bar truss shown in Figure 2 . . . 34
7 Problem details for 10-bar truss in Figure 6 . . . 34
8 Minimum weight values for the 10-bar truss shown in Figure 6 over 10 different runs . . . 34
9 Sizing results for the 10-bar truss shown in Figure 6 . . . 35
10 Node locations of the geometry solutions for the 18-bar cantilever truss given in Figure 8 . . . 35
11 Member areas of the geometry solutions for the 18-bar cantilever truss given in Figure 8 . . . 36
12 Node locations in the geometry solution for 21-bar truss . . . 36
13 Products in the geometry solution for 21-bar truss . . . 36
PART III - GENETIC ALGORITHMS FOR DESIGN OF
MOMENT-RESISTING STEEL FRAMES
1 Horizontal loads (x-direction) for frame given in Figure 4 . . . 662 Vertical distributed loads (y-direction) for frame given in Figure 4 . . . 66
3 Vertical concentrated loads (y-direction) for frame given in Figure 4 . . . 66
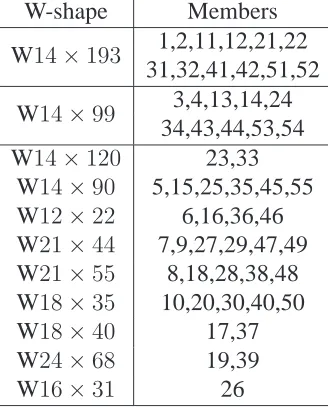
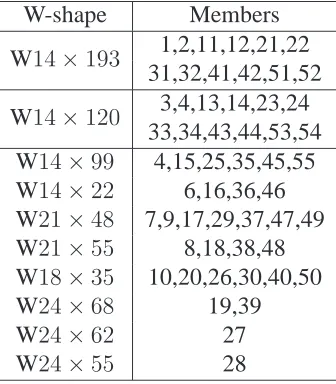
4 Product set for the beams in frame shown in Figure 4 . . . 67
5 Product set for the columns in frame shown in Figure 4 . . . 67
6 Least weight solution for fully rigid frame shown in Figure 4 . . . 67
7 pj for optimal solution shown in Figure 6, when base is fixed andrreq = 10 . . 68
8 pj for optimal solution shown in Figure 7, when base is hinged andrreq = 6 . . 68
10 pj for optimal solution shown in Figure 10, when base is fixed andrreq = 12 . . 69 11 pj forM GA1solution shown in Figure 11, when base is fixed andrreq = 12 . . 69 12 pj forM GA2solution shown in Figure 12, when base is fixed andrreq = 12 . . 70
PART IV - COMPUTATIONAL FRAMEWORK FOR REMOTELY
OPERABLE LABORATORIES
List of Figures
PART II - OPTIMIZATION APPROACHES FOR TRUSS MODELS
WITH REAL-WORLD COST FUNCTIONS
1 Formation of clusters in the optimal solution for the 21-bar truss shown in
Figure 2. The members belonging to each cluster are given in Table 5 . . . 37
2 Topology of the 21-bar truss . . . 37
3 Flowchart for algorithm that forces solution to satisfy stress constraints . . . 38
4 Flowchart for algorithm that forces solution to satisfy displacement constraints 39 5 Flowchart for algorithm 2 . . . 40
6 Topology of 10-bar truss . . . 41
7 Flowchart of geometry optimization algorithm . . . 42
8 18-bar truss . . . 43
9 Solution for 18-bar truss evaluated by Rajeev and Krishnamoorthy [15] . . . . 43
10 Solution for 18-bar truss obtained using the proposed approach - Case A . . . . 43
11 Solution for the 18-bar truss obtained using the proposed approach - Case B . . 44
PART III - GENETIC ALGORITHMS FOR DESIGN OF
MOMENT-RESISTING STEEL FRAMES
1 Algorithm for correcting solutions that violate equation 4 and 5 . . . 712 Algorithm for correcting solutions that violate sway constraints . . . 72
3 Illustration of the crossover operator . . . 73
4 Elevation of 5-bay 5-story frame . . . 73
5 Trade-off curve betweenrreqandCfor frame shown in Figure 4 . . . 74
6 Rigid connection locations in cost optimal solution for 5-bay 5-story frame with fixed base . . . 74
7 Column member types and rigid connection locations in cost optimal solution for 5-bay 5-story frame with hinged base . . . 75
8 Plot showing trade-off curve for different values of CR=Cr/Cs . . . 75
9 Illustration of MGA . . . 76
11 Design equation values for increased wind loads and rigid connection locations
inM GA1when all supports are fixed andrreq = 12 . . . 78
12 Design equation values for increased wind loads and rigid connection locations inM GA2when all supports are fixed andrreq = 12 . . . 79
13 Column member types and rigid connection locations inM GA1when all sup-ports are hinged andrreq = 6 . . . 80
14 Column member types and rigid connection locations inM GA2when all sup-ports are hinged andrreq = 6 . . . 81
PART IV - COMPUTATIONAL FRAMEWORK FOR REMOTELY
OPERABLE LABORATORIES
1 Laboratory setup of shaketable experiment . . . 1062 Network setup of the computers . . . 106
3 Software architecture . . . 107
4 Wirgau et al.’s framework for shaketable control . . . 107
5 Wirgau et al.’s framework for data acquisition . . . 108
6 LabVIEW components for data acquisition . . . 108
7 Front panel of remote user’s data display VI . . . 109
8 LabVIEW components for video acquisition . . . 109
9 Flowchart showing remote user actions to access the experiment . . . 110
10 Snapshot of control timetable . . . 111
11 Flowchart showing proxy server actions for enabling remote access . . . 112
12 Sequence diagram of actions in giving remote user access to control the exper-iment . . . 112
Part I
1
Introduction
Like any decision-making problem, structural engineering design poses a variety of chal-lenges to the decision-maker. Typically, engineers face the following tasks during design - (1) Search for alternatives, (2) Evaluation of the alternatives and (3) Selection of a desired alter-native. Engineers iteratively perform these time- and computation-intensive tasks to arrive at a good and feasible solution. Simulation-based approaches that combine optimization with recent advances in computing can formalize and expedite the design process [16, 12]. Re-searchers have made great strides in structural optimization with both traditional mathematical optimization [8] and modern heuristic optimization, e.g., using genetic algorithms [25]. In spite of all the progress, optimization approaches have made little impact in structural engineering practice because of the way in which existing optimization methodologies have been applied for decision support.
The premise of simulation-based design is that existing knowledge is sufficient to accu-rately represent the behavior of the structure using a mathematical model. In the absence of such knowledge, engineers resort to experimental validation for evaluating the design. The time taken for experimental validation can be significant, since large-scale laboratories that support these experiments are geographically distributed. Advances in internet and informa-tion technology have generated tremendous interest towards networking experimental research laboratories that are geographically far apart so as to make them available for engineering re-search and decision-making. While the internet provides the infrastructure for communication, computational approaches consistent with hardware are required for data acquisition, control, security and safety.
The proposed research focuses on developing computational approaches that can become part of structural engineering Decision Support Systems (DSS) for simulation-based design and internet-enabled experimental testing. This study can be broadly categorized into three parts:
1. Simulation-based design of bridge trusses
These topics are discussed briefly in the following sections.
2
Design of Bridge Trusses
The design of a bridge truss involves finding truss topology, node locations and member sizes such that the truss can withstand the given loading for a minimal total cost. Over the past two decades, researchers have proposed numerous optimization approaches for truss de-sign. Rajeev and Krishnamoorthy [23], Deb and Gulati [6] and Shrestha and Ghaboussi [24] have studied the use of genetic algorithms for truss design. Hansen and Vanderplaats [13] have suggested an approximation method based on Taylor series expansion of the member forces. Elperin [7] has proposed a Monte Carlo algorithm. Studies that use other optimization tech-niques like evolutionary strategies [21] and simulated annealing [14] also exist.
Adeli and Sarma [1] reviewed the available literature in optimization of steel frame struc-tures and concluded that a very small number of structural steel optimization studies attempt to include any cost other than the weight of the structure. The same is also true in the case of truss optimization studies. The optimization approaches in literature are developed primarily for design problems with simple minimum-weight cost functions. In addition to the material cost that is not necessarily proportional to the weight of the truss, real-world costs also include (i) explicit costs dependent on the number of different products used in the design, (ii) fabri-cation cost of each joint in the truss and (iii) implicit cost related to the constraints of erecting a truss. Studies using real-world cost models are likely to encourage the use of optimization approaches in structural engineering practice. In this study, we consider a bridge truss problem with a real-world cost function.
3
Design of Moment-Resisting Steel Frames
current practice, all connections in a moment frame are considered rigid and designed accord-ingly. Depending on the relative cost of connection and the cost of material, an optimal solution that has rigid connections only at certain locations may exist. Most rigid frame optimization studies, even those attempting to model the semi-rigid behavior of connections [18, 3, 15], fo-cus only on minimizing the total weight of the structure and avoid incorporating the fabrication cost of the connection in their optimization model. Optimization approaches that account for the cost of connections can serve as a good tool for engineers.
Lavrich [17] points out an important drawback in the current trend of using optimization to find least cost solutions. The structures resulting from optimization are often fully-stressed and have little redundancy. Engineers though are willing to compromise the cost to a certain extent if the additional benefits from a design outweigh the increase in cost. While designing moment-resisting steel frames, engineers compare different solutions on the basis of factors like the number of rigid connections, the location of the rigid connections (interior or exterior bays) and the structure’s lateral load resistance capacity before choosing a solution for final design. Engineers can greatly benefit from computational approaches for trade-off and what-if analyses.
In this study, we consider a real-life steel frame formulation. The cost estimates are ob-tained from practicing engineers and erectors. We propose using Genetic Algorithms (GA) [9, 19] to perform trade-off study between the number of rigid connections and the total cost of the frame. The use of penalty functions [20], which can be detrimental to the performance of the GAs, is avoided using novel crossover schemes and algorithms that correct infeasible solutions. We also develop techniques that use optimization to generate design alternatives.
4
Remote Operation of Laboratory Experiments
Earthquake Engineering Simulation (NEES), which is a simulation resource that is composed of geographically distributed state-of-the-art experimental research equipment sites, to advance earthquake engineering research and education. Its objective is to make experimental labora-tories with facilities like shaketables for simulating earthquakes, available for seismic perfor-mance evaluation and testing through the internet.
While internet is available as the underlying infrastructure, new IT architectures that inter-connect web technologies with a framework for data acquisition and control are required. Re-mote monitoring of the response of a structure under testing requires sophisticated computer-controllable data-acquisition hardware. Similarly, remote control of a shaketable requires computer-controllable hardware that drives the shaketable. Another facet of an internet-enabled experiment is to provide the remote user with real-time video of the experiment. For an experiment that involves dynamic behavior, the decision-maker is interested in directly viewing the structure’s motion. Shaketable experiments often involve motions in the frequency region of 5-20 Hz. Capturing this motion and communicating it in real-time requires a high frame-rate digital camera and appropriate hardware for acquiring images from the camera.
In this study, we present a generic computational framework that can aid in the creation of research collaboratories like NEES. We illustrate the fundamental concepts of the framework by implementing it for remote control and observation of a shaketable experiment. Such a framework is also applicable for making laboratory experiments available in distance-education courses at universities [5, 4, 22, 10]. The framework supports a single-controller multiple-observer concept so that many users can simultaneously observe video and download measure-ments in real-time as a single controller controls the test parameters.
5
Objectives and Proposed Research
5.1
Design of Bridge Trusses
computational time than existing optimization approaches. The specific tasks that are required to achieve this objective are listed below.
1. Formulate a bridge truss design problem that incorporates a real-life like cost function and a set of member products.
2. Develop new sizing optimization methodologies that include structural engineering knowl-edge to generate good starting solutions and to reduce the size of search space.
3. Explore strategies to explicitly handle costs on the number of product types in the truss. 4. Study the performance of the developed methodology for representative examples.
5. Compare the sizing algorithm with other recently proposed optimization techniques. This step would require modification of the cost model to that for minimum-weight design prob-lems.
6. Implement a truss geometry optimization algorithm, which wraps around the proposed siz-ing approach to evaluate each geometry solution generated dursiz-ing the search process. 7. Evaluate the performance of the geometry optimization algorithm with respect to other
geometry optimization approaches in literature.
5.2
Design of Moment-Resisting Steel Frames
The purpose of this study is to explore the use of optimization for finding the best locations of rigid connections in moment-resisting steel frames. Generating the trade-off relationship between the number of rigid connections and the total cost of the frame can provide insight into whether the total cost is minimized by minimizing the number of rigid connections in the frame. The study aims to develop new optimization-based computational approaches to perform trade-off and what-if analyses and hence, support decision-making in the design of steel frames. The following tasks are performed in this study.
1. Identify the various strength and serviceability constraints from the Manual of Steel Con-struction - Load and Resistance Factor Design [2].
2. Formulate the objective function using cost estimates obtained from discussion with prac-ticing engineers and erectors.
programs for performing finite element analyses of frames and incorporating the design checks as specified by AISC [2].
4. Evaluate the applicability of GA-based optimization approach that was developed for dis-crete optimization problem encountered in pipe support optimization [11]. Modify it as appropriate for application to the design of rigid steel frames.
5. Choose an appropriate real-life like rigid steel frame to study the proposed optimization approach.
6. Perform a trade-off study between the number of rigid connections in the frame and its total cost. Generate the trade-off curve for two types of support conditions in the frame - (a) all supports are fixed and (b) all supports are hinged.
7. Analyze the generated trade-off curves. In particular, observe if significant cost savings can be achieved by minimizing the number of rigid connections in the frame.
8. Generate alternative solutions with a cost comparable to that of the optimal solution using “Modeling to Generate Alternatives - MGA.”
9. Comment on relative quality of alternative solutions by examining the generated designs for factors like practical feasibility, lateral load resistance and fabrication.
5.3
Remote Operation of Laboratory Experiments
The goal of this study is to develop a computational framework that can enable remote observation and control of laboratory experiments. For portability to different experiments, it is required that the software components for data acquisition and control have little depen-dency with the components that handle web technologies. The main tasks that are identified to complete this study are listed below.
1. Setup a proxy server that prevents direct access to the LabVIEW computers from the inter-net.
2. Run a webserver on the proxy server that will authenticate remote users and setup commu-nication channels for serving data to the remote users.
4. Create provision for remotely viewing the sensor data using web-based oscilloscope dis-plays. Each user shall be able to individually adjust the oscilloscope settings like its scale or origin coordinates without affecting the view of other users.
5. Develop mechanisms that ensure that only a single user registered as controller is permitted to control the experiment.
6. Implement real-time video transmission such that multiple users are able to view the struc-tural motion simultaneously.
7. Provide forms on the webserver that allows users to schedule for accessing the experiment on a future date.
6
Organization
This dissertation consists of 5 parts, some of which are primarily manuscripts prepared for submission to various peer-reviewed journals for possible future publication. Part I gives an introduction to the dissertation and provides an outline of the different research topics consid-ered in this study. It gives the various tasks necessary to achieve the objectives of this study. It also informs the reader about the organization of the dissertation.
Part II presents a hybrid-optimization approach for truss optimization. A bridge truss for-mulation with real-life cost functions and member types is described. The performance of the optimization approach is compared with conventional genetic algorithms for real-life truss problems. The superiority of the optimization approach over existing approaches is illustrated for traditional minimum-weight problems.
and flowcharts.
Part V of the dissertation provides the summary and conclusions of this search. Recom-mendations for possible future research in these areas are also provided.
References
[1] H. Adeli and K. C. Sarma. 2000. Engineering Optimization, 32:777–802, 2000.
[2] AISC. Manual of Steel Construction - Load Resistance Factor Design. AISC,3rdedition, 2001.
[3] Y. A. Al-Salloum and T. H. Almusallam. Optimality and safety of rigidly- and flexibly-jointed steel frames. Journal of Constructional Steel Research, 35:189–215, 1995.
[4] C. L. Bohus, A. Crowl, B. Aktan, and M. H. Shor. Running control engineering experi-ments over the internet. In Proceedings of the 13th IFAC World Congress, San Francisco, CA, 1996. paper no. 4c-03.
[5] M. L. Corradini, G. Ippoliti, T. Leo, and S. Longhi. An internet based laboratory for control education. In Proceedings of the 40th IEEE Conference on Decision and Control, Orlando, FL, December 2001.
[6] K. Deb and S. Gulati. Design of truss-structures for minimum weight using genetic algorithms. Finite Elements in Analysis and Design, 37:447–465, 2001.
[7] T. Elperin. Monte-carlo structural optimization in discrete variables with annealing algo-rithm. International Journal for Numerical Methods in Engineering, 26:815–821, 1988.
[8] O. N. Ghattas and I. E. Grossman. MINLP and MILP for discrete sizing structural opti-mization problems. In In Electronic Computation: Proceedings of the Tenth Conference, pages 197–204. ASCE, New York, NY, 1991.
[10] A. Gupta, M. A. Gabr, and V. C. Matzen. Alternatives in the implementation of internet-enabled laboratory. In 2004 ASEE Annual Conference and Exposition, Salt Lake City, June 2004.
[11] A. Gupta, P. Kripakaran, G. Kumar, and J. W. Baugh Jr. Genetic Algorithm-based de-cision support for optimizing seismic response of piping systems. Journal of Structural Engineering, 131(3):389–398, March 2005.
[12] R. T. Haftka and Z. Gurdal. Elements of structural optimization. Kluwer Academic Publishers, Boston, third edition, 1992.
[13] S. R. Hansen and G. N. Vanderplaats. Approximation method for configuration optimiza-tion of trusses. AIAA journal, 28(1):161–168, January 1990.
[14] O. Hasancebi and F. Erbatur. Layout optimization of trusses using simulated annealing. Advances in Engineering Software, 33:681–696, July-October 2002.
[15] E. S. Kameshki and M. P. Saka. Optimum design of nonlinear steel frames with semi-rigid connections using a genetic algorithm. Computers and Structures, 79(17):1593–1604, 2001.
[16] U. Kirsch. Structural optimization: fundamentals and applications. Springer-Verlag, New York, 1993.
[17] D. L. Lavrich. Basic education: A practitioner’s point of view. Structure, pages 9–11, April 2003. A joint publication of NCSEA, CASE and SEI.
[18] E. S. B. Machaly. Optimum weight analysis of steel frames with semi-rigid connections. Computers and Structures, 23(4):565–574, 1986.
[19] Z. Michalewicz. Genetic Algorithms + Data Structures = Evolution Programs. Springer-Verlag, New York, third, revised and extended edition, 1996.
[21] M. Papadrakakis, N. D. Lagaros, G. Thierauf, and J. Cai. Advanced solution meth-ods in structural optimization based on evolution strategies. Engineering Computations, 15(1):12–34, 1998.
[22] S. E. Poindexter and B. S. Heck. Using the web in your courses: What can you do? what should you do? IEEE Control System, 9(1):83–92, 1999.
[23] S. Rajeev and C. S. Krishnamoorthy. Genetic algorithms-based methodologies for design optimization of trusses. Journal of Structural Engineering, pages 350–358, 1997.
[24] S. M. Shrestha and J. Ghaboussi. Evolution of optimum structural shapes using genetic algorithm. Journal of Structural Engineering, pages 1331–1338, 1998.
[25] M. S. Voss and C. M. Foley. Evolutionary algorithm for structural optimization. In Proceedings of the 1999 Genetic and Evolutionary Computation Conference (GECCO),
1999.
Part II
NOVEL OPTIMIZATION APPROACHES FOR TRUSS
MODELS WITH REAL-WORLD COST FUNCTIONS
Prakash Kripakaran, Abhinav Gupta, and John W. Baugh, Jr.
Novel Optimization Approaches for Truss Models with
Real-World Cost Functions
Prakash Kripakaran, Abhinav Gupta, and John W. Baugh Jr.
Abstract
1
Introduction
Structural engineers, faced with the challenge of designing reliable structures at a minimum cost, continue to seek formal techniques to assist them in obtaining cost-optimal designs. A key feature of the decision-making process is identification of alternatives for solving the given problem. Then, whether an alternative is satisfactory typically requires analysis by one or more computer models and the expertise and judgment of the engineer. Of course, such a scenario is iterative, and many such alternatives may be considered in the process. The search for both fea-sible and good alternatives can be tedious, and numerous optimization approaches have been developed over the years to formalize and expedite the process in structural engineering [11, 7]. Research in structural optimization has included computational complexity studies [19], tradi-tional mathematical optimization [5], and modern heuristic optimization, e.g., using genetic algorithms [18, 6].
The computing related advances over the past decade have created a tremendous interest in heuristic optimization techniques for structural engineering design. The availability of faster computers with large memory has made it possible to employ these complex approaches that involve large-scale computing for structural optimization problems. Yet, a major drawback of most optimization approaches is that they are developed primarily for solving minimum-weight truss problems. As a result, most approaches while computation-intensive, seldom give good results when applied to truss problems with real-world cost functions. Hybrid ap-proaches that couple structural engineering-based algorithms to find good initial solutions with traditional optimization algorithms are likely to exhibit better performance. Such hybrid opti-mization approaches are often employed in an alternative decision-making paradigm in which a computer-based decision support system (DSS) is used [12, 13, 10, 2].
pa-per, we propose computational approaches to support such a framework for truss design with conventional as well as real-world cost functions. A new method is developed for determining optimal member sizes (sizing optimization) and the location of nodes (geometry optimization) in a given topology. An attempt has been made to illustrate the efficiency and accuracy of the proposed method with respect to some of the existing and widely popular heuristic tech-niques. The proposed method is a hybrid approach that combines the following two key steps in sequence (i) a search that mimics professional intuition to generate a near-optimal sizing, and (ii) a non-deterministic local search that identifies the final solution. For real-world cost functions in which additional costs are incurred based on the number of different products used in the design, a “clustering” approach is implemented to identify groups of similar sized mem-bers. Examples are used for illustrating the capability of the proposed approaches to support joint-cognitive decision-making through the involvement of the designer.
2
Definition of Truss Optimization Problem
Truss design can be a complex decision problem in real world applications that involves minimization of various costs. Researchers have proposed numerous optimization approaches for truss design. Rajeev and Krishnamoorthy [15], Deb and Gulati [3] and Shrestha and Ghaboussi [17] have studied the use of genetic algorithms. Hansen and Vanderplaats [8] have suggested an approximation method based on Taylor series expansion of the member forces. Elperin [4] has proposed a Monte Carlo annealing algorithm. Other approaches like evolution-ary strategies [14] and simulated annealing [9] have also been studied.
engineering practice.
In case of truss bridges, one such realistic cost function is considered in the bridge design contest [16] offered by West Point military academy. This cost function can be expressed as:
Total cost, Tc =Cm+Cpnp+Cjnj (1)
wherenp andnj represent the number of products and joints in the truss respectively. Cp and Cj are the cost per product and the fabrication cost per joint, respectively. Cm is the total material cost and is evaluated as
Cm = n X
i=1
c(pi)li (2)
li is the length of memberi;n represents the number of members in the truss; andc(pi)is the cost per unit length of the productpi used for memberi. c(pi)is computed as
c(p) =ρ(mp)Apcw(mp, sp) (3)
mprepresents the material type of productp;ρ(mp)gives the material density formp;Apis the cross-sectional area of productp; andcw(mp, sp)is the cost per unit weight of the product p. cw(mp, sp)of a productpdepends on its materialmp and the shape of its cross-sectionsp. The productspi are chosen from a discrete set S of products such thatpi = S(j)andS(j)refers to thejthproduct in setS. The products in setS are sorted in increasing order of cost per unit length such that,c(S(i))≤c(S(j)) =⇒ i≤j.
Equation 1 is a fairly generic representation of the costs in real-world bridge trusses. It reduces to the minimum-weight problem, a commonly used cost function in structural opti-mization studies, whenCp = Cj = 0 andc(pi) = ρ(mpi)Ai. Consequently, the approaches presented in this paper are intended to work well not only for real-world cost functions but also for minimum-weight truss problems.
and the displacement violation,Pd, are calculated using the following equations.
Ps = i=n X
i=1
Psi, andPsi ={max(Ft(i)−St(pi),0) +max(Fc(i)−Sc(pi),0)} (4)
Pd=max
(dj−sj), ∀ j = 0..m
0
(5)
Sc(pi)andSt(pi)are the compressive and tensile force capacity of productpi;Fc(i)andFt(i) are the maximum compressive and tensile forces in memberi, respectively; dj andsj are the maximum evaluated displacement and the specified maximum limit at degree of freedom j; andm is the total number of degrees of freedom in the truss. Sc(pi)andSt(pi)are evaluated as,
Sc(pi) =
0.9(0.66λσ
yiAi), λ≤2.25
0.9
0.88σyiA λ
, λ >2.25 (6)
λi =
σyiAiL2i π2EiIi
(7)
St(pi) = 0.95(σyiAi) (8)
pi refers to the product assigned to theith bar; Ei andσyi are the Young’s modulus and yield stress of the bar material; and Ai andIi are the area and moment of inertia of productpi. Li is the length of memberi. In Equations 6 and 8, 0.90 and0.95correspond to the resistance factors used for compression and tension, respectively. The stress and displacement constraints are enforced during the optimization process by using penalty costs with Ps and Pd. The constraint-free objective function for this problem is given as
Minimize{Z =aPs+bPd+Tc} (9)
a andb are constants that serve as weights to the stress and displacement violations, respec-tively, and can vary depending on the problem. The specific values ofaandbused for various examples are presented later along with the discussion on a particular example.
3
Sizing Algorithm
search. The first algorithm uses a special “clustering” technique to intelligently determine a good initial set of clusters. This technique is described next.
3.1
Clustering
Clustering is proposed to explicitly handle the problem of minimizing the number of prod-ucts np in the truss. The idea behind this technique is that members of the truss that exhibit similar behavior will most likely have the same product. Based on the forces that members may experience, one can arrive at the clusters of members that are likely to have the same products. Before this technique is formally presented as part of the algorithm to generate the starting solution, we present a simple graphical illustration to explain its basic premise.
Draw a graph in which the xandy axes represent the compressive and tensile forces, re-spectively. For the given truss topology, product types for each of its members can be selected arbitrarily based on professional experience as an initial solution. Evaluate the maximum ten-sile forcesFt(i)and compressive forcesFc(i)in different members by analyzing the truss for various load cases. Using the evaluated forces, plot the point corresponding to each member on this graph. Then, consider a rectangular area that encloses all the plotted points such that each side of the rectangle is parallel to one of the two axes. Divide this rectangular area into a grid using equally spaced vertical and horizontal lines. The members of the truss that are present in the same unit of the grid are considered as belonging to the same cluster. As an example, Figure 1 gives the clusters in the optimal solution for the 21-bar truss shown in Figure 2. As is evident from the figure, the grid size determines the number of clusters that will be generated. The finer the grid, the larger is the number of clusters, and vice versa. The formal algorithm for this clustering technique in the proposed hybrid approach to sizing is outlined next.
3.2
Algorithm 1 - Clustering to Generate Starting Solution
The formal representation for a truss sizing solution is presented to facilitate the develop-ment and explanation of the proposed algorithm. For a given topology, a sequence of cluster and product pairs -(ci, pi)can be used to represent a sizing solution. Here,ciis given by,
All members in clusterci use the same productpi. The algorithm is outlined in the following steps.
Step 1 : Assign the product having the least cost to all the members as follows:
pi =S(0) ∀ i= 1. . . n (11)
nis the number of members in the truss.
Step 2 : Analyze the truss to obtain the maximum tensile force Ft(i) and compressive force
Fc(i)experienced by each memberi.
Step 3 : For each memberi, determine the least cost product (qi) such that, St(i) > Ft(i)and
Sc(i)> Fc(i)ifqi is assigned to theithmember.
Step 4 : Find the minimum and maximum of both compressive and tensile forces over all the
members. Let us call themFc minandFc max, andFt minandFt max, respectively.
Step 5 : In a graph in which thexandyaxes represent theFc(i)andFt(i)respectively, consider
the rectangular area bounded byx=Fc min,x=Fc max,y=Ft min andy =Ft max.
Step 6 : Divide the rectangular area into ar1×r2grid using vertical and horizontal lines that are
equally-spaced. Number the grids as1,2, . . . , r1r2 sequentially starting from the left-bottom corner and proceeding row-wise.
Step 7 : Identify the grid numbergi for each memberibased on itsFc(i)andFt(i).
Step 8 : Form clusterscj by grouping all members that have the same grid numbergi.
Step 9 : Assign the same productrj to all members of each clustercj, where rj is the median
of the productsqifound in step 3 for the members in this cluster.
Step 10 : Repeat steps2−9until the clusters obtained over two consecutive iterations are the
same.
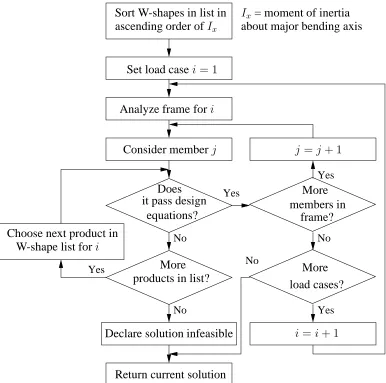
Step 11 : Enforce the stress constraints by repetitively trying products of next higher cost for
clusters that have members with force violation. This process is illustrated using a flowchart in Figure 3.
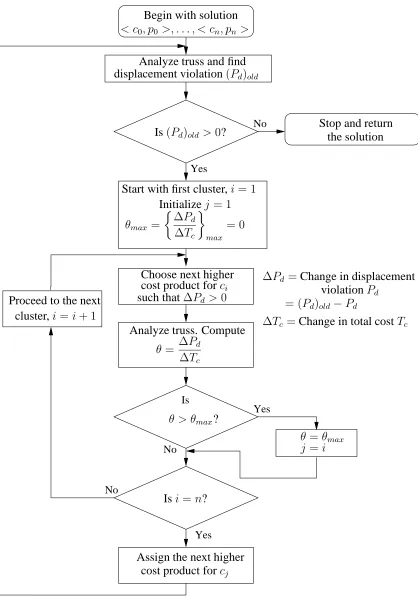
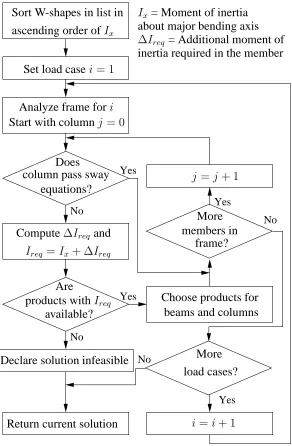
Step 12 : Enforce the displacement constraints using the iterative procedure given as a
given in Figure 4 generates the final solution by performing the following steps iteratively - (i) For each cluster with displacement violation (Pd >0), find the least cost product that reduces the displacement violation and evaluate the ratio (θ) of the amount by which the displacement violation decreases (∆Pd) to the amount by which the cost increases (∆Tc) and (ii) Accept the change in product for only that cluster which has the highest value for the ratio (θ), i.e., for cluster corresponding toθmax.
Step 13 : Return the solution. This solution serves as a very good initial solution in a broader
search procedure.
When attempting to solve a simple minimum-weight problem that does not have costs on the number of products, skip steps4−8and assume that each member belongs to a cluster of its own. In other words,ci ={i}and{(c0, q0). . .(cn, qn)}forms the solution to the problem.
3.3
Algorithm 2 - Local Search
The solution generated from the previous algorithm is used as a starting point in this local search that finds the optimal solution. The algorithm is given using a flowchart in Figure 5. The key components of the algorithm are described below:
• Transition: A transition is any one of the following two alternatives
-1. Change the product p = S(j)of a randomly chosen cluster cto a new productq such thatδ =|c(p)−c(q)|is small. SinceS is already sorted in the order of increasing cost, randomly choose a productqnear the current productpas follows,
q=rand(Sc) , Sc ={S(j −R), S(j−R+ 1). . . S(j+R)} (12)
rand() is a function that randomly chooses any element fromSc with equal probability. Ris a positive integer value that prescribes the maximum allowed change.
2. Combine any two or more randomly chosen clusters into one cluster. This is an ex-plicit attempt to reduce the number of products used in the design. Suppose that clusters - d1. . . dm, are randomly chosen for combination. Let q1. . . qm represent their corresponding products. Create a new cluster-product pair (d, q) such that d = {d1∪d2· · · ∪dm}andq=max(q1. . . qm).
transitionT, only one ofA1andA2is chosen as follows,
T =
A1, X ≥P A2, X < P
(13)
X is a random variable uniformly distributed in the interval[0,1]. ParameterP defines the probability with which one of the alternatives is chosen over the other. It is set such thatA1 is chosen with a higher probability thanA2. We observed that a value of P between0.70 and0.90gave consistent and good results in the various examples considered.
• Memory: The algorithm uses a memory that keeps track of the solutions already visited.
Specifically, in the event of combining two clusters, it is possible that the new solution gen-erated has already been explored. This memory can only hold a finite number of solutions. Therefore, it is possible that the same solution is examined multiple times in the search. This inefficiency of the proposed algorithm may be avoided by using a larger memory. The performance of this sizing algorithm is analyzed in the following section.
4
Sizing Algorithm Validation
The performance of the algorithm is evaluated using two examples. Its performance is first discussed for a truss problem with real-world cost function. Next, its performance is studied for a minimum-weight truss problem that is commonly cited in literature to compare its performance with respect to existing algorithms.
4.1
Real-World Truss Problem: 21-Bar Truss Example
the products are listed in Table 1. A cross-section of particular shape (hollow tube or bar) and size is available in three different materials - carbon steel, high tensile steel and tempered steel. The properties of all three materials are listed in Table 2. The cross-section data in Table 1 and the material data in Table 2 are used in Equation 3 to find the cost per unit lengthc(p)of any productp. It is observed that the cost per unit lengthc()for the products do not monoton-ically increase with increasing area. Instead, the values ofc()are such that hollow tubes are usually cost-effective for compression members compared to solid bars of same area whereas the solid bars are cost-effective for tension members, as is the case in conventional structural engineering practice.
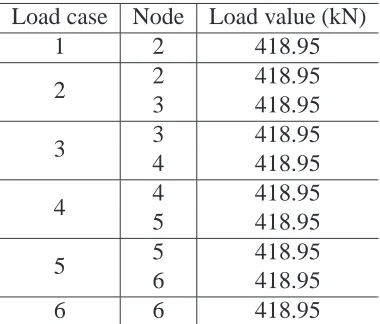
The bridge is subject to six different load cases. All the loads in each of the load cases act at the nodes of the bottom chord. Table 3 gives the dead load of the deck acting on the truss. In addition to the deck load given in the table, the dead load corresponding to the weight of the truss members is included in each load case by assigning half the weight of a member to each of its nodes. Table 4 gives the six different cases of live loads acting on the truss. The truss is analyzed for various load combinations such that each combination involves all of the dead load and a single live load case.
The proposed algorithm is used to obtain the optimal solution to the 21-bar truss. In Equa-tion 9, the penalty cost for stress violaEqua-tionais set as200000and the penalty cost for displace-ment violation b is set to zero. The latter is set to zero because there are no constraints on displacements for this problem. The best solution generated over a sequence of50runs using different random seeds is found to have a cost of $ 41,538. The clusters in the optimal so-lution arec1 = {1,2,5,6,14,19}, c2 = {3,4}, c3 ={7,8,9,10,11}, c4 = {12,21}andc5 = {13,15,16,17,18,20}. The products that are assigned to the various clusters are listed in Ta-ble 5. The average cost of the optimal solution and the average number of evaluations over the
50different runs are$ 41,600and6905respectively.
a structural engineer’s perspective, one can also visualize that the top chord of the truss is in compression and the bottom chord is in tension. Correspondingly, the optimal solution has tubular sections for the top chord and bar cross-sections for the bottom chord. Although there is symmetry in geometry and loading, symmetry in member sizing is not enforced explicitly. But the final design given by the sizing algorithm does show symmetry. All these properties show that solutions generated using this optimization approach will prove useful towards decision-making by a truss designer.
5
Minimum-Weight Truss Problem: 10-Bar Truss Example
In this section, the performance of the proposed sizing technique is compared with that of a genetic algorithm-based optimization approach. In particular, we consider the GA-based approach proposed by Rajeev and Krishnamoorthy [15]. They have illustrated the ap-proach for the ten-bar truss shown in Figure 6. As this is a minimum-weight truss problem, Cp = Cj = 0 in Equation 1. The product set S consists of 79 different products. All the products are aluminium bars having cross-section areas from[0.6452cm2; 3.226Kcm2 (K =
1,2. . .76); 256.854cm2; 258.08cm2]. It is assumed that the bars do not buckle and the com-pressive strength of the bar is same as its tensile strength. Instead of Equations 6-8, the follow-ing equation is used to determineSc(pi)andSt(pi).
Sc(pi) =St(pi) =σyiAi (14)
Displacement constraints are specified using upper limits on vertical displacements at the nodes in the bottom chord. The displacement constraints and material properties are summarized in Table 7. Interested readers are referred to Rajeev and Krishnamoorthy [15] and Elperin [4] for comprehensive details on this problem.
The valuesa = b = 200000are used for the parameters in Equation 9. The best solutions obtained for this truss and the number of solutions evaluated in a sequence of 10 runs with different random seeds in the proposed approach are given in Table 8. While the best solutions given by Rajeev and Krishnamoorthy [15] and Elperin [4] have a weight of22653.55N and
25829.73respectively, the proposed approach generates a solution with a weight of22573.68N. Also, while6,050and80,000solutions are evaluated in the GA-based approach and Monte-Carlo method, respectively, the proposed approach requires evaluation of only 826 solutions on an average. All three solutions are given in Table 9.
The 10-bar truss problem is much simpler than the previously-discussed 21-bar truss ex-ample. The features that contribute to a significant reduction in complexity of the 10-bar truss problem are summarized below,
1. The cost model is only made up of the weight. Costs on the number of products if present would have resulted in a more complex objective function.
is contrary to the bridge truss formulation, in which buckling is considered. Due to buckling, the compressive strength of a member can be significantly lower than its tensile strength de-pending on the shape of its cross-section and the member length. As a result, it is important to handle member design for compression and tension differently.
3. All products available for the design are made of the same material - aluminium. For the real-world cost function, products of three different materials that have different allowable strengths are available.
4. Cost (or weight) increases monotonically with increase in area of the member. For the real-world cost function, increase in member area does not correspond to increase in cost. The cost also depends on the material type and the basic shape of the product.
Most of the sizing optimization approaches in the literature are designed for academic problems that suffer from one or more of the above described simplifications. As illustrated earlier with a GA-based approach for the 21-bar truss, existing approaches do not give good results when real-world cost models are considered because such models produce a more complex decision space. The proposed approach is designed with heuristics to handle such real-world cost models. In the following section, we illustrate a relatively simple way of incorporating the proposed sizing optimization approach in a geometry optimization algorithm.
6
Geometry Optimization Algorithm
The goal of geometry optimization is to find the optimal shape of the truss for a given topology. Therefore, decision variables of the problem include the coordinates of certain nodes of the truss in addition to the sizing variables for its different members. We consider a discrete design space for nodal coordinates using a rectangular grid such that any node in the truss can only be present at one of the grid-points. We propose a layered-optimization framework in which the geometry optimization algorithm evaluates the quality of a geometry solution by using the sizing approach to find the least cost solution for that particular geometry.
• Transition : In each iteration, the algorithm attempts a certain specified number of tran-sitions (nt). The coordinates of the truss nodes undergo small random changes in each transition. In any transition, the coordinates of one or multiple nodes may be shifted. Sup-pose that the design space for the truss is discretized in into a grid by equally-spaced lines in x and y-directions. Let the spacing between the lines in both the directions be equal tod. Then, the random shifts in x and y-direction for a particular node can be given by∆x=Xd and ∆y = Y d, whereX andY are random variables that return a integer value in the in-terval [-R,+R] andRis an integer value that determines the maximum allowed change. By starting the search procedure with trial solutions that have nodes only at the grid-points, it is ensured that all solutions generated by the transitions also have nodes only at the grid-points. The best solution generated in all attempted transitions is taken as the initial solution for the next iteration.
• Solution evaluation : The objective value of any geometry solution is defined as the cost
of the least-cost solution for the truss with that particular geometry. Thus, an evaluation of a solution in the geometry optimization procedure actually involves using the previously described sizing approach to find the least cost solution for the particular geometry.
• Convergence criteria : The algorithm keeps track of the best solution,O, generated during
the entire course of the search procedure. The algorithm converges when the best solution, O, has not changed over a specified number of iterations (nf).
In the following section, we show results that illustrate that this simple algorithm performs better than other common optimization approaches proposed for shape optimization.
7
Performance of Geometry Optimization Algorithm
of156.25mm2 (0.25in2). The allowable compressive and tensile forces for a memberiusing productpi are calculated using,
Sc(pi) = −
KiEiA2i
L2i , andSt(pi) =σyiAi (15)
Ki is a constant determined from the cross-sectional geometry ofpi. Ki = 4for this problem. Eiis the Young’s modulus of the material of productpi. Ai is the cross-section area of product pi. Li is the length of the memberi. There are no displacement constraints specified for this problem. As in the case of 10-bar truss, the cost is once again defined as the weight of the truss. For complete details on the problem, the readers are referred to Hansen and Vanderplaats [8].
To illustrate the performance of the proposed approach for real-world problems, we seek the geometry optimal solution for the 21-bar truss shown in Figure 2. Only nodes 8 and 9 are permitted to move. Node locations of 11 and 10 are constrained using symmetry relationship with 8 and 9 respectively. The node locations and the member details of the optimal solution generated using the proposed approach are listed in Tables 12 and 13. The cost of the optimal solution is$ 37,296.
8
Summary and Conclusions
than the solutions generated by the GA-based approach. The approach presented in this paper is suitable for a Decision Support System (DSS) for truss design. The designer can evalu-ate various topologies by using the proposed approaches. Often, designers prefer to keep the discretion of deciding a truss topology, based on their experience, judgment and aesthetics. The proposed approach provides an ideal environment for joint-cognitive decision-making that involves the designer for generating topologies and utilizes the computational approaches to generate the best sizing and geometry solution for each topology.
The main conclusions from this study are listed below:
• The clustering technique mimics the professional structural engineering knowledge to han-dle the cost associated with the number of products. The number of clusters generated using this technique is governed by the size of the grids in the rectangular area bounded by the maximum forces.
• The first algorithm in the hybrid approach generates a near-optimal solution. This algorithm contributes significantly to the overall computational efficiency of the proposed approach. • The proposed hybrid sizing approach generates consistently good results for real-world cost
functions.
• The sizing algorithm performs better than existing optimization techniques with respect to minimum - weight truss problems.
• The power of the sizing approach is also demonstrated in the geometry optimization algo-rithm. While the algorithm is an extension of simple local search, it generates much better results than existing optimization techniques.
References
[1] H. Adeli and K. C. Sarma. 2000. Engineering Optimization, 32:777–802, 2000.
[2] J. W. Baugh, Jr., S. C. Caldwell, and E. D. Brill, Jr. A mathematical programming ap-proach to generate alternatives in discrete structural optimization. Engineering Optimiza-tion, 28:1–31, 1997.
algorithms. Finite Elements in Analysis and Design, 37:447–465, 2001.
[4] T. Elperin. Monte-carlo structural optimization in discrete variables with annealing algo-rithm. International Journal for Numerical Methods in Engineering, 26:815–821, 1988.
[5] O. N. Ghattas and I. E. Grossman. MINLP and MILP for discrete sizing structural opti-mization problems. In In Electronic Computation: Proceedings of the Tenth Conference, pages 197–204. ASCE, New York, NY, 1991.
[6] A. Gupta, P. Kripakaran, G. Kumar, and J. W. Baugh Jr. Genetic Algorithm-based de-cision support for optimizing seismic response of piping systems. Journal of Structural Engineering, 131(3):389–398, March 2005.
[7] R. T. Haftka and Z. Gurdal. Elements of structural optimization. Kluwer Academic Publishers, Boston, third edition, 1992.
[8] S. R. Hansen and G. N. Vanderplaats. Approximation method for configuration optimiza-tion of trusses. AIAA journal, 28(1):161–168, January 1990.
[9] O. Hasancebi and F. Erbatur. Layout optimization of trusses using simulated annealing. Advances in Engineering Software, 33:681–696, July-October 2002.
[10] H. M. Karandikar and F. Mistree. The integration of information from design and manu-facture through decision support problems. Applied Mechanics Reviews, 44(10), 1991.
[11] U. Kirsch. Structural optimization: fundamentals and applications. Springer-Verlag, New York, 1993.
[12] D. H. Loughlin, J. K. Neal, S. Ranjithan, E. D. Brill, Jr., and J. W. Baugh, Jr. Deci-sion support system for air quality management. In Computing in Civil Engineering: Proceedings of the 2nd Congress, ASCE, pages 1367–1374, 1995.
[14] M. Papadrakakis, N. D. Lagaros, G. Thierauf, and J. Cai. Advanced solution meth-ods in structural optimization based on evolution strategies. Engineering Computations, 15(1):12–34, 1998.
[15] S. Rajeev and C. S. Krishnamoorthy. Genetic algorithms-based methodologies for design optimization of trusses. Journal of Structural Engineering, pages 350–358, 1997.
[16] S. Ressler. West point bridge design contest, united states military academy, 2004. http://bridgecontest.usma.edu/.
[17] S. M. Shrestha and J. Ghaboussi. Evolution of optimum structural shapes using genetic algorithm. Journal of Structural Engineering, pages 1331–1338, 1998.
[18] M. S. Voss and C. M. Foley. Evolutionary algorithm for structural optimization. In Proceedings of the 1999 Genetic and Evolutionary Computation Conference (GECCO),
1999.
Table 1: Product details: 21-bar truss Product dimensions
Outer dimensions (Bar/Tube) Wall thickness (Tube)
(mm×mm) (mm)
10×10 2
15×15 2
. ”
55×55 2
60×60 3
. ”
75×75 3
80×80 4
90×90 4
100×100 5
110×110 5
120×120 6
130×130 6
140×140 7
150×150 7
160×160 8
170×170 8
180×180 9
190×190 9
200×200 10
210×210 10
220×220 11
230×230 11
240×240 12
250×250 12
300×300 15
400×400 20
Table 2: Material properties - 21-bar truss
Property Carbon High Quenched
Steel Strength /tempered (CS) Steel (HS) Steel (QS) Elastic modulus 2×10⁸kN/m2
Density(ρ) 7850kg/m3 Yield stress
25 34.5 48.5
(×104kN/m2) cw ($/kg)
3150 4200 5700
Bar shapes cw ($/kg)
5040 6250 7950
Tube shapes
Table 3: Dead load details - 21-bar truss Load Node Load value (kN)
2 189.34
3 189.34
4 189.34
5 189.34
6 189.34
Table 4: Live load details - 21-bar truss Load case Node Load value (kN)
1 2 418.95
2 2 418.95
3 418.95
3 3 418.95
4 418.95
4 4 418.95
5 418.95
5 5 418.95
6 418.95
6 6 418.95
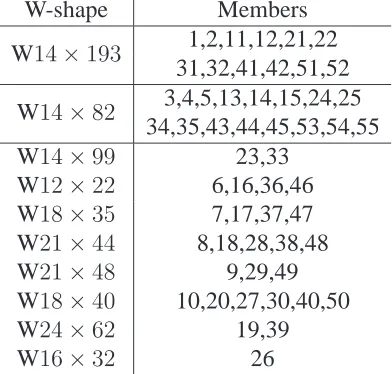
Table 5: Optimal solution for the 21-bar truss shown in Figure 2
Cluster Product details Member
No. Cross-section Material numbers
1 Bar55×55 HS 1,2,5,6,14,19
2 Bar55×55 QS 3,4
3 Tube220×220×11 CS 7,8,9,10,11
4 Bar30×30 QS 12,21
Table 6: Details of the GA runs for the 21-bar truss shown in Figure 2 Case Population Crossover Average number Optimal Average
No. size of evaluations solution ($) cost ($)
1 1000 one-point 176600 70,991 86,670
2 5000 one-point 943500 65,482 78,889
3 1000 uniform 181600 73,408 93,218
4 5000 uniform 856250 66,773 84,349
Table 7: Problem details for 10-bar truss in Figure 6
Material Aluminium
Young’s modulus 68.95×10⁶ kN/m2 Specific weight 2768Kg/m3
Allowable stress 0.172375×10⁶ kN/m2 Displacement limits
δ= 5.08cm (nodes 1-4)
Length l= 9.144m
Table 8: Minimum weight values for the 10-bar truss shown in Figure 6 over 10 different runs Minimum Number of
weight (N) evaluations
22716.57 836
22655.97 886
22653.70 836
22655.97 786
22716.57 786
23147.73 786
22573.68 736
22622.82 886
22722.26 886
Table 9: Sizing results for the 10-bar truss shown in Figure 6 Member. Our approach Rajeev and Elperin
No. Krishnamoorthy
(cm2) (cm2) (cm2)
1 200.01 206.46 200.01
2 0.65 0.65 0.65
3 154.85 151.62 129.04
4 93.55 103.23 90.33
5 0.65 0.65 0.65
6 3.23 0.65 0.65
7 48.39 54.84 51.62
8 138.72 129.04 145.17
9 135.49 132.27 145.17
10 0.65 0.65 96.78
Table 10: Node locations of the geometry solutions for the 18-bar cantilever truss given in Figure 8
Node Our approach Rajeev and Our approach
No. Case A Krishnamoorthy Case B
x(m) y(m) x(m) y(m) x(m) y(m)
3 23.5 5.0 22.3 4.1 24.1 2.9
5 16.8 3.8 15.5 3.0 17.7 2.3
7 10.9 2.5 9.8 1.8 11.4 1.8
Table 11: Member areas of the geometry solutions for the 18-bar cantilever truss given in Figure 8
Member Our approach Rajeev and Our approach
No. Case A Krishnamoorthy Case B
(mm2) (mm2) (mm2)
1 8064.50 7741.92 1451.61
2 8064.50 7741.92 1774.19
3 8064.50 7741.92 3709.67
4 8064.50 7741.92 6129.02
5 8064.50 7741.92 7580.63
6 10483.85 11935.46 7419.34
7 10483.85 11935.46 8225.79
8 10483.85 11935.46 10483.85
9 10483.85 11935.46 11774.17
10 10483.85 11935.46 12096.75
11 5161.28 3387.09 2258.06
12 5161.28 3387.09 4032.25
13 5161.28 3387.09 5000.00
14 5161.28 3387.09 5483.86
15 2580.64 2903.22 1774.19
16 2580.64 2903.22 2419.35
17 2580.64 2903.22 1612.90
18 2580.64 2903.22 3225.80
Weight (N) 20468.39 20536.64 16155.54
Table 12: Node locations in the geometry solution for 21-bar truss
Node Initial Optimized
No. Coordinates Coordinates x(m) y(m) x(m) y(m)
8 3.50 4.00 2.50 4.25
9 9.25 5.50 8.50 7.50
10 14.75 5.50 15.50 7.50 11 20.50 4.00 21.50 4.25
Table 13: Products in the geometry solution for 21-bar truss
Cluster Product details Member
No. Cross-section Material numbers
1 Bar40×40 QS 1,2,5,6
2 Bar55×55 HS 3,4
3 Tube200×200×10 CS 7,8,9,10,11
4 Bar45×45 CS 12,14,15,18,19,21
5 Tube120×120×6 CS 16,17
0000000000
0000000000
0000000000
1111111111
1111111111
1111111111
000000
000000
000000
111111
111111
111111
000000
000000
000000
111111
111111
111111
000000
000000
000000
000000
111111
111111
111111
111111
000000 000000 000000 000000 000000 000000 111111 111111 111111 111111 111111 111111 4 2 3 5 1Maximum compression forceFc()
M axim u m tensile force Ft () 528.8 793.2 1057.6 1322
0 297.8 595.6 893.4 1191.2 1489
0 264.4 528.8 793.2 1057.6 1322
0 297.8 595.6 893.4 1191.2 1489
0 264.4 528.8 793.2 1057.6 1322
0 297.8 595.6 893.4 1191.2 1489
0 264.4 528.8 793.2 1057.6 1322
0 297.8 595.6 893.4 1191.2 1489
0 264.4 528.8 793.2 1057.6 1322
0 297.8 595.6 893.4 1191.2 1489
0 264.4 528.8 793.2 1057.6 1322
0 297.8 595.6 893.4 1191.2 1489
0 264.4 528.8 793.2 1057.6 1322
0 297.8 595.6 893.4 1191.2 1489
0 264.4 528.8 793.2 1057.6 1322
0 297.8 595.6 893.4 1191.2 1489
0 264.4 528.8 793.2 1057.6 1322
0 297.8 595.6 893.4 1191.2 1489
0 264.4 528.8 793.2 1057.6 1322
0 297.8 595.6 893.4 1191.2 1489
0 264.4
Figure 1: Formation of clusters in the optimal solution for the 21-bar truss shown in Figure 2. The members belonging to each cluster are given in Table 5
1 3
6 spans @ 4m each
20 19 2 21 18 17 16 15 14 13 12 11 10 9 8 7 6 5 4 7 5 3 1
2 4 6
10 9
11 8
No Yes
No
Yes
Choose next higher cost product forci
Isi=n? Begin with solution
Analyze the truss
cluster,i=i+ 1
memberj inci?
IsPsj >0for any
Seti= 1
Select first cluster
< c0, p0 >, . . . , < cn, pn >
Stop and return the solution Analyze the truss
for all load cases
Proceed to the next
Yes
No
No
Yes Is
No
Yes
Initializej = 1
cost product forcj
Assign the next higher Isi=n?
cost product forci
Is(Pd)old>0?
< c0, p0 >, . . . , < cn, pn >
Begin with solution
Analyze truss and find
Start with first cluster,i= 1
∆Pd =Change in displacement
j =i
Choose next higher
θ > θmax?
Analyze truss. Compute such that∆Pd>0
cluster,i=i+ 1
Proceed to the next
the solution Stop and return
θ =θmax
∆Tc =Change in total costTc
θmax =
∆Pd
∆Tc
max
= 0
θ= ∆Pd ∆Tc
= (Pd)old−Pd
violationPd
displacement violation(Pd)old
Yes Has Yes No Yes No No Yes No Yes No Yes Is Is No < c0, p0 >, .., < cn, pn >
Add solution to a setS
α= 1
α= 0
nreduced? Begin with solution
Add solution toS
Seti= 1,j = 0
i=nt?
More
Update optimal solution
Return the best solution found solution inS
Proceed to next
a stage
change in optimal solution
optimal solution
permitted without change in attempted in a stage
i= Transition number within
j = Number of stages without
nt= Max. number of transitions
nf = Max. number of stages
Setj =j+ 1
Perform transition and evaluate new solutionSnew
Seti=i+ 1
Z(Snew)< Z(Si)?
Setj = 0
Isj =nf? solutions inS?
Isα= 0?