ABSTRACT
FENG, KAI. Constitutive Response of Microbial Induced Calcite Precipitation Cemented Sands. (Under the direction of Dr. Brina Montoya.)
In the last decade, microbial induced calcite precipitation (MICP) emerged as a novel technique for implementing soil improvement in an environmentally-friendly and economically beneficial manner. However, the mechanical behavior and constitutive response of these materials are still not fully explored by researchers. In this dissertation, the characteristics of MICP cemented sands are investigated through numerical modelling and experimental tests, including macro and micro tests under both static and dynamic loading.
In the second part, discrete element method was adopted to model the constitutive response of MICP cemented sands. Well-established agreement was obtained between experimental and numerical specimens, indicating the possibility of discrete element method to capture the MICP cemented soil’s properties, which would help to understand the behavior of cemented soil from micro-scale. Following numerical modelling, micro tests, including goniometer tests and particle-bond-particle tests, are conducted in the third part. Specially prepared triaxial chamber with bender elements was also used to provide detailed information on the bond breakage evolution during shearing.
Constitutive Response of Microbial Induced Calcite Precipitation Cemented Sands
by Kai Feng
A dissertation submitted to the Graduate Faculty of North Carolina State University
in partial fulfillment of the requirements for the degree of
Doctor of Philosophy
Civil Engineering
Raleigh, North Carolina 2015
APPROVED BY:
_________________________________ _________________________________ Dr. Brina Montoya Dr. Roy Borden
Committee Chair Vice-Chair of Committee
_________________________________ _________________________________ Dr. Timothy Evans Dr. Mohammed Gabr
ii DEDICATION
iii BIOGRAPHY
iv
ACKNOWLEDGMENTS
I would like to express my deep gratitude to Dr. Montoya and Dr. Evans. Without their precious guidance and support throughout my research, I could not have come this far. I would also like to extend my sincere thanks to my committee members Dr.Borden, Dr. Rahman, and Dr. Gabr for their suggestions and corrections.
I am also grateful to Dr. Carlos E. Cary for his assistant to install equipment and effort to give us an organized and clean laboratory environment.
Many thanks to geotechnical group members: Zhangwei Ning, Cheng Wang, Jianting Tang, and Casey Shanahan.
v
TABLE OF CONTENTS
LIST OF TABLES……….. x
LIST OF FIGURES……….. xii
1 INTRODUCTION ... 1
2 LITERATURE REVIEW ... 8
2.1 Introduction ... 8
2.2 Effect of traditional cementation on soil behavior ... 9
2.2.1 Triaxial tests on traditional cemented soil ... 9
2.2.2 Response of cemented sand under condition ... 13
2.2.3 Behavior of sand under different stress paths ... 16
2.2.4 Behavior of cemented sand under dynamic loading ... 17
2.2.5 Response of cemented soil in situ ... 21
2.3 Bio-mediated cementation for ground improvement ... 23
2.4 Bender elements application on shear wave measurement ... 27
2.5 Numerical investigation of sand ... 31
vi
2.5.2 Cemented soil simulation by DEM ... 36
2.6 Discussion ... 39
3 CHARACTERIZATION OF MICP CEMENTED SANDS UNDER MONOTONIC LOADING ... 42
3.1 Introduction ... 42
3.2 Influence of confinement and cementation level on the behavior of MICP cemented sands under monotonic drained loading ... 43
3.2.1 Background on MICP stress-strain behavior ... 44
3.2.2 Soil and cementation methods ... 46
3.2.3 Experimental details and procedure ... 48
3.2.4 Results and discussions ... 51
3.2.5 Conclusions from triaxial loading ... 64
3.3 Cementation degradation of loaded MICP soils ... 66
3.3.1 Background on settlement behavior of MICP sands ... 67
3.3.2 Materials and experimental design ... 68
vii
3.3.4 Discussions ... 75
3.3.5 Conclusions from loading ... 77
3.4 Comparison of MICP cemented sands, Portland cement treated soil and naturally cemented soil ... 77
3.5 Summary ... 79
4 NUMERICAL MODEL OF MICP CEMENTED SANDS ... 102
4.1 Introduction ... 103
4.2 Principles of the discrete element method ... 107
4.3 Experimental procedure and results... 112
4.4 Numerical model properties ... 115
4.5 Simulation results ... 118
4.5.1 Macro-response ... 118
4.5.2 Micro-response ... 121
4.5.3 Bond breakage analysis ... 125
viii
4.5.5 Limitations of current model ... 131
4.6 Summary and conclusions ... 133
5 DEFORMATION OF MICROBIAL INDUCED CALCITE BONDED SANDS: A MICRO-SCALE INVESTIGATION ... 154
5.1 Introduction ... 155
5.2 Micro-scale investigations of MICP bonded sands ... 157
5.2.1 Characterization of MICP bond surface energy ... 157
5.2.2 Particle-bond-particle deformation behavior ... 160
5.3 Behavior of MICP bonds in triaxial shear ... 161
5.3.1 Shearing behavior of MICP cemented sands ... 161
5.3.2 Microscopy investigation of sheared MICP cemented sands ... 163
5.4 Conclusions... 165
6 DYNAMIC PROPERTIES OF MICP CEMENTED SANDS ... 173
6.1 Introduction ... 174
ix
6.3 Results and discussions ... 180
6.3.1 Cyclic loading characteristics of soil... 180
6.3.2 Excess pore water pressure development... 185
6.3.3 Dynamic modulus ... 187
6.3.4 Cementation uniformity ... 190
6.4 Conclusions... 192
7 CONCLUSIONS AND FUTURE WORK ... 209
7.1 Conclusions... 209
7.2 Future work... 214
x
LIST OF TABLES
Table 3.1 Sand characteristics………. 81
Table 3.2 Chemical recipe of injection media……….... 81
Table 3.3 Characteristics of the triaxial specimens………...……….. 82
Table 3.4 Strength and deformation parameters………...…….. 83
Table 3.5 Chemical recipe of cementation media………... 83
Table 3.6 Characteristics of 1-D compression samples……….. 84
Table 4.1 Sand characteristics………... 135
Table 4.2 Chemical recipe of injection media……….. 135
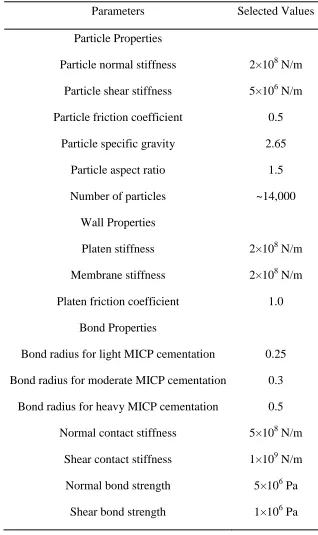
Table 4.3 Material and model properties for numerical simulations……… 136
Table 5.1 Surface energy components of silica and calcite……….. 167
Table 5.2 Work of cohesion and work of adhesion of silica and calcite………….. 167
Table 5.3 Results of particle-bond-particle deformation tests……….. 168
xi
Table 6.2 Chemical recipe of injection media……….. 195
Table 6.3 Soil characteristics……… 196
xii
LIST OF FIGURES
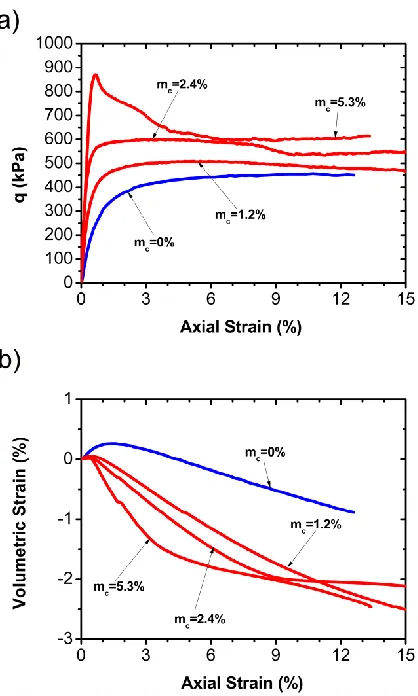
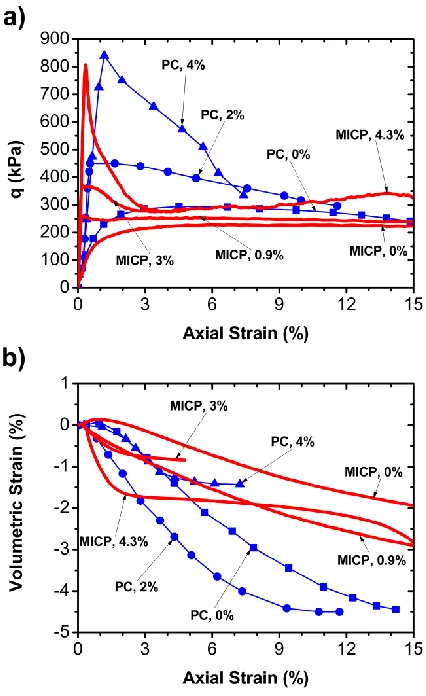
Figure 3.1 (a) Stress-strain behavior and (b) volumetric deformation of untreated and MICP treated sand with varying cementation levels under 100 kPa effective confining pressure. For each triaxial result presented, the initial density and mass of cementation, mc, is indicated (e.g., loose, mc=0.9% represents a loose s pecim en cem ented to a calcium carbonat e cont ent of 0.9%)………... 85
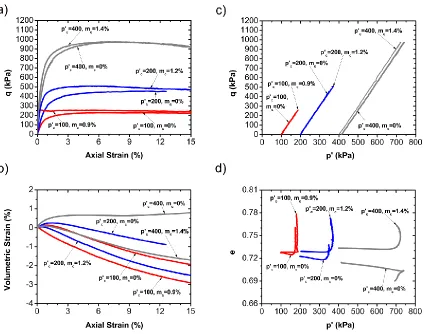
Figure 3.2 (a) Stress-strain behavior and (b) volumetric deformation of untreated and MICP treated sand with varying cementation levels under 200 kPa effective confining pressure. For each triaxial result presented, the mass of cementation, mc, is indicated... 86
Figure 3.3 (a) Stress-strain behavior and (b) volumetric deformation of untreated and MICP treated sand with varying cementation levels under 400 kPa effective confining pressure. For each triaxial result presented, the mass of cementation, mc, is indicated... 87
xiii
varying effective confining pressures. For each triaxial result presented, the effective confining pressure, p’c, in kPa, and mass of cementation, mc, is indicated……….. 88
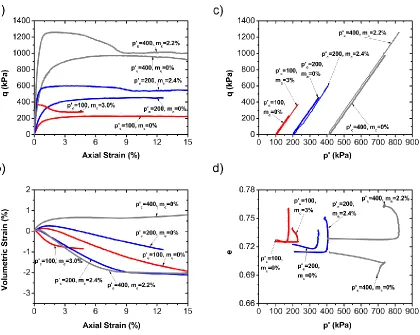
Figure 3.5 (a) Stress-strain behavior (b) volumetric deformation (c) stress path and (d) e versus p’ of untreated and moderately cemented MICP treated sand under varying effective confining pressures. For each triaxial result presented, the effective confining pressure, p’c, in kPa, and mass of cementation, mc, is indicated……….. 89
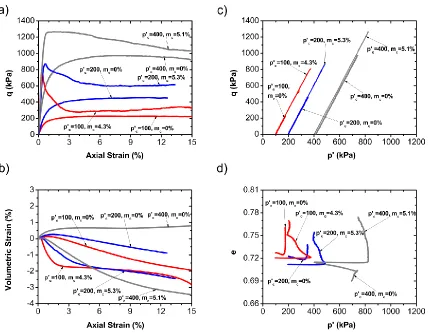
Figure 3.6 (a) Stress-strain behavior (b) volumetric deformation (c) stress path and (d) e versus p’ of untreated and heavily cemented MICP treated sand under varying effective confining pressures. For each triaxial result presented, the effective confining pressure, p’c, in kPa, and mass of cementation, mc, is indicated……….. 90
xiv
Figure 3.8 Peak strength data of treated sand with MICP and corresponding envelopes under varying cementation levels………... 91
Figure 3.9 Initial modulus of untreated sand and MICP treated sand under varying cementation levels and effective confining pressures………. 92
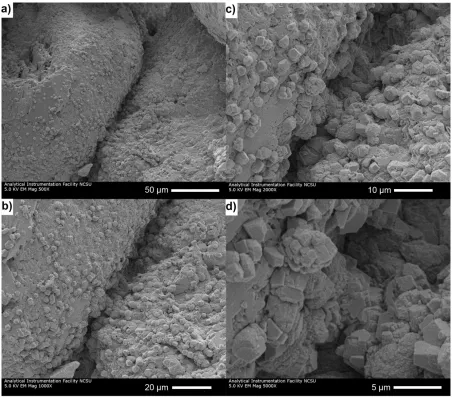
Figure 3.10 Scanning Electron Microscopy (SEM) images of moderately cemented sand illustrating the bonding of sand grains by precipitated calcite at magnifi cations of (a) 500x, (b), 1,000x, (c) 2,000x, and (d) 5,000x…………... 93
Figure 3.11 Cementation variation along the height of the specimen. For each specimen, the effective confining pressure, p’c, in kPa, and mass of cementation, mc, is indicated……….. 94
Figure 3.12 Modified consolidation cell with bender elements………. 94
Figure 3.13 Stress strain relationship for untreated and treated sand at a low cementation level……… 95
xv
Figure 3.15 Stress strain relationship for loose sand at varying cementation levels………... 97
Figure 3.16 Void ratio variations for loose sand at varying cementation levels……… 98
Figure 3.17 Vertical strain at largest loading level………... 99
Figure 3.18 Vertical strain after loading/unloading cycle……….. 99
Figure 3.19 Comparison of mechanical response between MICP cemented soil and naturally cemented soil………... 100
Figure 3.20 Comparison of mechanical response and deformation characteristics between MICP cemented soil and Portland cement treated soil………... 101
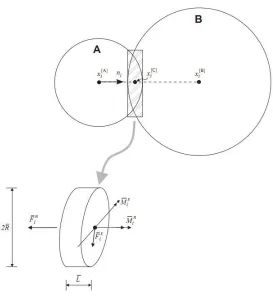
Figure 4.1 Parallel bond………. 137
xvi
Figure 4.3 (a) Stress-strain behavior and (b) volumetric deformation of treated numerical and experimental specimens with varying cementation levels under 100 kPa confinement, for each triaxial results presented, the specimen type and cementation level is indicated (e.g., si_light represents a lightly cemented simulated specimen.)………. 139
Figure 4.4 Grain size distribution of experimental and numerical soil particles…... 140
Figure 4.5 (a) Cementation formation in numerical specimen (b) scanning electron microscopic (SEM) image of soil particle and cementation at 500x magnificent and (c) SEM image at1000x magnification……….. 140
xvii
Figure 4.7 Void ratio evolution of untreated and treated numerical specimens during shearing, for each results presented, the cementation type and initial density (for untreated specimen) or cementation level (for cemented specimen) is indicated (e.g., un_loose represents the loose untreated specimen; ce_light represents the lightly cemented specimen)………... 142
Figure 4.8 Meso scale void ratio of untreated and treated numerical specimens during shearing. (a) uncemented loose specimen under 100 kPa confinemen (b) uncemented medium dense specimen under 100 kPa confinemen (c) uncemented dense specimen under 100 kPa confinemen (d) lightly cemented specimen under 100 kPa confinemen (e) moderately cemented specimen under 100 kPa confinemen (f) heavily cemented specimen under 100 kPa confinemen (g) heavily cemented specimen under 400 kPa confinemen……… 143
xviii
untreated specim en; ce_li ght repres ents t he li ghtl y cement ed specimen)……….. 145
Figure 4.10 Bond breakage percentage of treated numerical specimens and estimated bond breakage percentage of experimental specimens, for each results presented, the specimen type and cementation level is indicated (e.g., si_light represents a lightly cemented simulated specimen)………... 146
Figure 4.11 Bond breakage percentage of heavily treated specimens under varying confinements, for each results presented, the associated confining pressure is indicated……… 147
xix
Figure 4.13 Stress-strain and bond breakage percentage of heavily cemented numerical specimen during shearing……….. 149
Figure 4.14 Bond breakage percentage and coordination number of heavily cemented numerical specimen during shearing………. 150
Figure 4.15 Stress-strain and dilatancy of (a) experimental and (b) numerical uncemented loose specimen under Shearing………. 151
Figure 4.16 Stress-strain and dilatancy of (a) experimental and (b) numerical uncemented dense specimen under shearing……….. 152
Figure 4.17 Stress-strain and dilatancy of (a) experimental and (b) numerical heavily cemented specimen under shearing……….………... 153
Figure 5.1 Calcite bond failure mechanism alternatives (modified from DeJong et al. 2010)………... 169
xx
Figure 5.3 a) Stress-strain and b) shear wave velocity measurements for uncemented ( 0% calcite) and moderately cemented (1.7% calcite) specimens under isotropically consolidated drained compression loading…………... 170
Figure 5.4 SEM images of MICP cemented sands, focusing on calcite bond between sand grains at magnifications of (from top left to bottom right) 200x, 500x, 1000x, and 2000x ………... 171
Figure 5.5 SEM images of MICP cemented sands collected from the shear zone of the specimen at magnifi cations of (fro m left to right) 200x, and 500x ………... 172
Figure 5.6 SEM image of bacterial imprints within a calcite mineral……… 172
Figure 6.1 Cyclic loading responses of untreated loose specimen under cyclic stressratio of 0.14. a) normalized shear stress curve b) normalized pore pressure curve c) axial deformation d) normalized shear stress versus axial strain and e) normalized stress path………... 198
xxi
curve c) axial deformation d) normalized shear stress versus axial strain and e) normalized stress path……… 199
Figure 6.3 Cyclic loading responses of untreated dense specimen under cyclic stress ratio of 0.14. a) normalized shear stress curve b) normalized pore pressure curve c) axial deformation d) normalized shear stress versus axial strain and e) normalized stress path……… 200
Figure 6.4 Cyclic loading responses of untreated dense specimen under cyclic stress ratio of 0.25. a) normalized shear stress curve b) normalized pore pressure curve c) axial deformation d) normalized shear stress versus axial strain and e) normalized stress path……… 201
Figure 6.5 Cyclic loading responses of treated specimen (C-2) under cyclic stress ratio of 0.14. a) normalized shear stress curve b) normalized pore pressure curve c) axial deformation d) normalized shear stress versus axial strain and e) normalized stress path……… 202
xxii
c) axial deformation d) normalized shear stress versus axial strain and e) normalized stress path……… 203
Figure 6.7 Cyclic loading responses of treated specimen under cyclic stress ratio of 0.25. a) normalized shear stress curve b) normalized pore pressure curve c) axial deformation d) normalized shear stress versus axial strain and e) normalized stress path……… 204
Figure 6.8 Cyclic resistance curves for untreated loose and dense Ottawa 50-70 sand and lightly cemented MICP treated sand (e.g., 0.9% mass of calcite)….. 205
Figure 6.9 Normalized pore pressure development curves for untreated and treated specimens………... 206
Figure 6.10 Deformation characteristics of untreated and treated specimens a) Hysteresis loop of each cycle b) degradation with number of cycles and c) degradation with cyclic shear strain……….. 207
1
1 INTRODUCTION
Cementation, whether naturally occurring or added by man-made activities, has been shown to increase the ability of sands to resist failure when subjected to static or dynamic loading. Natural cementation occurs due to chemical deposition, weathering by-products, or bonding by clay particles. Artificial cementation mainly includes the injection of colloidal silica grout (Diaz-RodrIiguez et al. 2008), Portland cement (Saxena et al. 1988; Schnaid et al. 2001; Ismail et al. 2002), or gypsum (Ismail et al. 2002; Huang and Airey 1998). Generally, a variety of chemical, jetting, and permeation grouting techniques are used to distribute the artificial grouts in the subsurface. Historically, some artificial grouts have caused environmental concerns due to detrimental effects on groundwater quality from grout constituents (Karol 2003). In addition, the limited injection distance for chemical grouting or super-jet grouting is another concern when designing for ground improvement.
2
ureolysis catalyzed by the bacterium Sporosarcina pasteurii. Provided with a solution of urea and calcium chloride, the main reactions related to calcite precipitation include:
The ammonium chloride produced during cementation process should be removed to avoid unfavorable ecological effects to the environment. An acidifying process through oxidation of ammonium could dissolve the precipitated calcite. Under natural groundwater conditions where the ground water pH is greater or equal to 6.3, the produced calcite will be geologically stable (Fujita et al. 2008). Bio-cementation is an additive process, where the bacteria produce calcite cementation in proportion to the amount of nutrients (e.g., urea and calcium) supplied; therefore, multiple injections of nutrients may take place to achieve a desired level of cementation.
3
Through monotonic and dynamic loading in both laboratory and centrifuge tests (Chou et al. 2011; Chu et al. 2012; DeJong et al. 2006; Montoya et al. 2013; Mortensen and DeJong 2011; van Paassen et al. 2010; Whiffin et al. 2007), bio-mediated cementation has been proved to be effective to strengthen soil stabilization in situ. But limited works give the insight about the formation and development of the bond and debond behavior of bio-cemented soil. One of the objectives of this research is to address the effect of static loading and unloading on the strength and stiffness properties of cemented soil and corresponding bond’s breakage evolution, which can be monitored through the bender elements installed within the triaxial cell. To further evaluate the stress-strain behavior of the bio-cemented sand and discuss the similarities and differences between untreated and bio-treated soil will be another research objective. Another important concern will be the evolution of bond breakage of MICP soil in a modified triaxial cell, which will then be compared to traditional cemented sand in a similar loading condition. The above mentioned research objectives will be addressed using traditional laboratory techniques (e.g., triaxial and consolidation equipment).
4
5
with uncemented and traditional cemented sand. In order to get a direct verification with numerical microstructure, authors will apply scanning electron microscopy analysis to provide satisfactory comparison to the numerical analysis and enhance the confidence to the numerical experiments.
The final section of this thesis is focused on the liquefaction mitigation improved by bio-cemented soil. By utilizing cyclic triaxial experiments, the dynamic properties of bio-cemented soil will be evaluated and compared with other cemented soil. Using the customized cyclic loading equipment with shear wave velocity measurement, the small-strain properties of uncemented and bio-cemented sand can be derived.
This research is organized in the following manner:
Chapter 2 reviews the previous work on the investigations on traditional and bio-cemented sand behavior both in physical experiment and discrete element numerical experiment and discusses the necessity of the research in this thesis.
6
bio-cemented sand under loading-unloading are presented. Finally, the behavior of MICP cemented soil is compared to the behavior of Portland cement and naturally cemented soil.
Chapter 4 describes the numerical model to simulate cemented sand and corresponding calibration comparison with physical experiments in Chapter 3. After calibration, further numerical experiments under varying confinement and cementation levels are conducted and corresponding microstructure developments are analyzed. Finally, utilizing monitoring data from bender elements measurement, bond breakage pattern of treated sand are analyzed. Since the numerical model also has the ability to study bond breakage evolution, the comparison of bond breakage pattern from experimental data and numerical model are made.
Chapter 5 is about the exploration of micro mechanics feature of MICP cemented sands, in which goniometer tests and surface energy analysis are conducted. Furthermore, modified chamber with built-in bender elements are prepared to monitor biochemical treatment and bond breakage development during shearing.
7
characteristics are changed due to the bonding by calcite, which improve the liquefaction resistance of loose sand. Finally, the uniformity of cementation treatment is discussed.
8
2 LITERATURE REVIEW
2.1 Introduction
9
2.2 Effect of traditional cementation on soil behavior
2.2.1 Triaxial tests on traditional cemented soil
Clough et al. (1981) performed a number of triaxial tests and Brazilian tension tests on four naturally-cemented sands found in San Francisco Bay Area and on man-made cemented samples, which are used to simulate natural soil behavior. They concluded that the amount of cementing agent, sand density, confining pressure and grain size distribution all have a significant effect on the behavior of cemented sand. Also, the results showed that weakly-cemented sand presents a brittle failure mode at low confining pressure with a transition to ductile failure at higher confining pressure. In their research, it was found that some degree of residual cohesion was observed for cemented sands, but the residual strength of cemented sand is close to that of uncemented sand.
10
Schnaid et al. (2001) studied the stress-strain-strength behavior of artificially cemented sand through the addition of Portland cement using unconfined compression test and drained triaxial compression tests. They recommend unconfined compression strength as a good measurement of cementation degree. Also, it was found that shear strength of cemented soil could be expressed as a function of the unconfined compressive strength and the uncemented friction angle. Unlike uncemented soil, the normalized secant modulus (normalized by atmospheric pressure) of cemented soils is not significantly affected by the initial mean effective stress under low confining pressure. With the same amount of cementation content, the normalized secant modulus of cemented soils under different initial mean effective stress is close.
11
value for k0. The authors proposed to use the ratio of tensile or unconfined compressive strength to the preconsolidation pressure to describe the changing influence of cementation with density.
Ismail et al. (2002) explored the effect of cement type on response of cemented calcareous soil by maintaining consistency of unconfined compressive strength and sample density among the different cementing agents, namely Portland cement, gypsum and calcite. Results from triaxial tests showed that although having same unconfined compressive strength and density, the behavior of sand using different cement varies significantly because of the different volumetric response upon shearing. Generally, samples using Portland cement presented ductile yield and a high level of dilation while calcite and gypsum-cemented samples exhibited brittle yield and more contraction.
12
Consoli et al. (2009) conducted a series of unconfined compressive tests and drained triaxial tests with bender element measurement and got a conclusion that voids/cement ratio, which defined as the ratio between the volume of voids and the volume of cement, plays a fundamental role on initial shear modulus and Mohr-Coulomb effective strength parameters of an artificially cemented sand. The study broadened their previous research (Consoli et al. 2007), which presented the unconfined compression strength as a function of the voids/cement ratio. Following, Consoli et al. (2010, 2011) performed a number of splitting tensile tests and unconfined compression tests. In their research, the voids/cement ratio, which expressed as porosity divided by the volumetric cement content, has been shown to be a reasonable parameter to estimate splitting tensile and unconfined compression strength of cemented sand. Consoli et al. (2012) investigate the effect of cement/voids ratio on stress-dilatancy response of cemented sand and verified cement/void ratio is an appropriate parameter to assess stress-dilatancy properties of cemented sand.
13
2.2.2 Response of cemented sand under condition
Using oedometer cell with bender element to measure shear wave velocity, Yun and Santamarina (2005) investigated small strain stiffness’ changes under k0 loading and they confirmed that cementation prevails at low confinement and all soil parameters gradually perform stress-dependent behavior at high confinement. Furthermore, higher density, cement content, and effective confining pressure during cementation lead to lower possibility of decementation. However, when the soil is unloaded to same initial confinement, some breakage of interparticle bonds happened despite the absence of collapse. Shear wave velocity was verified to be a good method to provide valuable information about cementation content without disturbing sample. Although cemented sand exhibit high initial stiffness, it is inadequate to use it for design because cementation may collapse upon loading, leading to large deformation.
14
S-wave velocity increases with the increases of vertical effective stress and sand fraction. For the cemented sand, higher wave velocity is revealed before cementation and wave velocity is constant after cementation with the increase in vertical stress. When additional loading is applied to samples, bonds start to be broken and thus P- and S-wave velocity decrease. Nevertheless, wave velocity increases with the increase of vertical stress in the stress-controlled regime after bond degradation. Three behavior regions, namely rubber-like, transition and sand-like behavior, present for both cemented and uncemented specimens. Higher small strain stiffness is observed for the cemented samples after bond degradation than that of the uncemented samples.
15
coefficient of increases with both cement content and preconsolidation stress. They stated that cement content and stress history are the two crucial factors affecting lateral stress in cemented soils, which may have smaller or greater lateral stress than that of uncemented samples, depending on stress history.
In a test of pumice sand, Kikkawa et al. (2012) claimed that the amount of stress relaxation with a constant rate of compression increases with increasing strain rate.
One method we could get lateral stress measured is to use the modified oedometer cell like that used by Zhu et al. (1995) and Ofer (1981). Another way is to use triaxial cell.
Campanella and Vaid (1972) decribed a simplified triaxial cell which is suitable for consolidating specimens under stresses in one load increment, several load increments or by strain controlled methods. They also showed test data for saturated clay, and the result is consistent with measurement from test.
16
2.2.3 Behavior of sand under different stress paths
Malandraki and Toll (2001) presented triaxial tests on weakly cemented soil with different stress paths and concluded that the bonds within soil is anisotropic and in one stress direction, only bonds in the specific direction will break. It was also found that yield surface of cemented soil is independent of previous shearing direction. However, the failure surface will be affected by previous shearing history. Generally, the strength under complex stress path is reduced compared to conventional triaxial tests, which indicates that using the data from conventional tests will give an unconservative design.
17
Finno and Kim (2012) discussed the effect of stress path rotation angle on small strain behavior of Chicago clay and showed that stiffer response occurred when stress path advanced in a direction opposite to preshear stress path. It was also concluded that both recent stress history and proximity to yield surface have an effect on shear modulus evolution, but in their tests, recent stress history prevails. Another point they emphasized is that the effect of recent stress history on small strain stiffness only worked when the stains is smaller than 1% shear strain.
Feda (1994) used clean alluvia-quartzitic Zbraslav sand under triaxial condition to analyze the form of failure envelope. He found that different stress paths, including constant cell pressure tests and constant p tests, affect the shear strength of sand and only tests with constant p stress path produces nonlinear failure surface.
2.2.4 Behavior of cemented sand under dynamic loading
18
nonhomogeneity in cementation on liquefaction, samples using a weaker layer cemented sand within a stronger mass were created and it was found that the weakly cemented layer govern the performance of the sample. From the tests of cubical shear box, which modeled similar conventional triaxial stress paths, higher stress ratios to liquefaction were performed. Fewer stress concentrations and different sample fabric compared to triaxial test are likely to be the reason. Another important conclusion is that pore pressure development for cemented sands are influenced by stress path, which have different trends in comparison with uncemented sands.
19
In the paper by Saxena et al. (1988), they verified that cement content, effective confining pressure and density are governing parameters of dynamic behavior of cemented sands but the damping ratios are less influenced by density. A newly empirical relations for maximum dynamic modulus and damping ratios was proposed based on the results of resonant testing.
Using cyclic simple shear tests, Diaz-RodrIiguez et al. (2008) confirmed that colloidal silica grout can improve the liquefaction resistance of natural silty sands and its performance was influenced by initial relative density, effective vertical stress and colloidal silica concentration. The concentration of colloidal silica also produces effect on the rate of pore pressure development. Their findings posed a chance to use colloidal silica for stabilization but the durability and mechanical setting of the colloidal silica within the sand matrix in natural deposits need to be further confirmed.
20
consolidation. Comparison of the shape of stiffness degradation curve in their research with that from noncalcareous soils, they stated that calcareous soils have faster rates of stiffness degradation with a higher strain threshold. Under cyclic triaxial loading condition, they got different stiffness degradation pattern whereas it fall within the range bounded by monotonic tests when the number of cycles changes from 1 to 10000. A point needs to be noted is that their investigations were carried on for samples cemented before consolidation and thus it may not be applicable to other kind of cementation sequences.
21
small strain can be increased by an order of magnitude for cemented sands. It was also observed that wave velocity don’t change too much due to stress changes until decementation starts.
2.2.5 Response of cemented soil in situ
22
Using cement-stabilized retaining wall, Ismail (2005) provided a possible cost-effective system applicable to medium-height retaining walls with generous lengths and stated that critical cementation is a key factor in maintaining an economic design because stability will not increase after a threshold of cementation.
Puppala et al. (1993) used cone penetration testing to provide strength parameters of cemented sands and claimed that bearing capacity theories proposed by Durgunoglu and Mitchell (1973)) and Janbu and Senneset (1973) give reasonable analytical methods to estimate cohesion intercept and relative density of cemented sands.
23
2.3 Bio-mediated cementation for ground improvement
Microbial induced calcite precipitation (MICP) provides a method to potentially uniformly improve the strength and stiffness of soil in a cost-effective and low-impact manner.
Stocks-Fischer et al. (1999) investigated biochemical and physical properties of calcite precipitation induced by Bacillus pasteurii. By scanning electron microscopy, they identified bacteria in the middle of calcite crystals, which are viewed as nucleation sites. Compared to chemical precipitation, larger precipitation rate presents in microbiological cementation, which also correlated well with the growth of cell and generation of ammonia and insoluble
. Their findings demonstrate a potential use of microbial induced calcite cementation in
sand improvement.
24
Fujita et al. (2008) stimulated microbial urea hydrolysis by adding molasses and urea in Eastern Snake River to promote calcite precipitation. In this way, the amount of contaminants from divalent trace metal and radionuclide in groundwater were reduced, which is viewed as a long term contaminant sequestration mechanism.
Using microbial induced cementation technology, many researchers have applied it to soil improvement.
DeJong et al. (2006) applied MICP to initially loose sand under undrained loading and compared it with gypsum cemented sample. They stated that MICP treated sand exhibit a strain softening behavior, with a higher shear stiffness than uncemented sample. Generally, MICP treated sand had similar behavior with gypsum cemented specimen. Using X-ray mapping, they also confirmed that the formed cement bonds were calcite.
25
Weil et al. (2012) discussed geophysical methods to monitor MICP process and they summarized as below: shear wave velocity is an effective methods to reflect cementation variation during MICP; compressive wave velocity could work at high cementation level and provides insight into the Poisson’s ratio; electrical resistivity is not effective when applied in MICP treated sample because the dependent on the conductivity of pore fluid, which changes due to biogeochemical reasons, however, resistivity should be useful to detect the spatial extent of treatment solution delivery.
DeJong et al. (2009) utilize large scale laboratory experiments to demonstrate the possibilities of MICP technology applied in situ, although a number of challenges associated with upscale of bio-mediated soil improvement were also addressed.
26
To understand the environmental factors that affect the biological treatment process, Mortensen et al. (2011) conducted a series of soil columns and batch tests. Through their researches, authors indicate that MICP process is equally effective over a wide range of soil types, concentration of ammonium chloride and salinities ranging from distilled water to full seawater. Their findings make MICP tech possible widely used in site with different soil-environmental system.
Based previous exploration, DeJong et al. (2010, 2011, 2013) discussed bio-cemented improvement system with interdisciplinary view at the confluence of microbiology, geochemistry and civil engineering. Treatment process, microscopy analysis, non-destructive monitoring and in-situ application are reviewed. Finally, two major problems related to MICP, namely optimization and upscaling of processes, are discussed.
27
2.4 Bender elements application on shear wave measurement
Shirley and Hampton (1978) design a program with transducers to measure shear wave velocity and attenuation in laboratory sediments and indicated that possible environmental noise in situ could be an impediment to apply it in determining properties of marine sediments and new system needs to be produced. It also was the first literature to talk about using bender element in geotechnical applications.
Dyvik and Madshus (1985) verified the consistency between maximum shear modulus tested from bender elements and resonant column. They made extensive applications of bender elements possible because the establishment of correlation between bender elements and traditional method. The consistency of measurement gotten from bender elements and direct stress-strain method was verified by Boulanger et al (1998).
28
careful consideration of specimen height to radius ratio in experimental design. For dealing with near field effects, they suggested using signal matching technology. A final issue is the uncertainty to detect first arrivals, they investigated and concluded that using cross-relation method is the preferred one.
Using bender element to assist triaxial tests is a common application:
Sharma and Baxter (2012) conducted drained and undrained triaxial compression tests on weakly cemented sand implemented with shear wave velocity measurement and concluded that shear wave velocity is mainly influenced by major principal effective stress during CD tests and minor principal effective stress is dominant during CU tests. Furthermore, shear wave velocity peaks before the full strength is mobilized, which indicates bond breakage in cemented soils and possibilities to use to monitor geotechnical structures.
With measurement of shear wave velocity, Airey and Mohsin (2005) investigated degradation behavior of man-made carbonate cemented sand and established a unique relation between rate of cement degradation and plastic shear strain.
29
compared to traditional method. But the limitations with several peaks using cross correlation method make a visual check necessary during testing.
Chan (2010) discussed the identification of shear wave arrival time using different methods and found that picking of the arrival time in time domain was equally good with method in frequency domain with the advantage of being easier and faster.
Brandenberg et al. (2008) developed a bender element system applied to centrifuge models. In their researches, high quality signal is obtained by use of signal stacking and digital filtering, which enable the bender elements system to be used at centrifuge model spinning at 20-g with acquisition of high quality data.
Other researchers also apply bender element system to evaluate liquefaction resistance (Zhou and Chen 2007), the onset of liquefaction (Lee and Santamarina 2007) and sample anisotropy properties (DeGroot and Landon 2006).
30
Signal to noise ratio can be improved by stacking, in conventional stacking, the waiting time for an secondary reflections to die out is necessary, Brandenberg et al. (2008) introduce a fast stacking technology with varying interval between consecutive pulses, which makes the acquisition of high quality signals possible even if consecutive pulses are excited successively.
31 2.5 Numerical investigation of sand
2.5.1 Clean sand investigation by DEM
In a granular medium, the forces are transferred through interparticle forces, which are difficulty to measure in real experiments and must be estimated from boundary conditions. However, the microstructure of granular materials is very important to understand mechanical properties of granular material.
Some researchers have developed destructive and non-destructive techniques to study granular medium microstructure. Specimen solidification followed by slicing and microscopic is the predominant destructive method. Using resin-impregnation and digital image analysis techniques, Kuo and Frost (1996) analyze the uniformity of granular sample at microscopic and macroscopic scale. Some nondestructive methods, such as magnetic resonance imaging (MRI) (Ng and Wang 2001) and X-ray Tomography technique (Wang et al. 2004; Batiste et al. 2004), have also been developed.
32
information about interparticle forces and microstructure evolution. As a numerical method, the samples with identical initial state can be used for varying loading and stress path. Furthermore, any inter-particle information are accessible during any stage of numerical testing. Along with development of computational techniques, the DEM method has been widely applied in simulating of laboratory test and simplified field problems. Currently, it is difficult to apply DEM to large-scale problem, however, Cundall (2001) suggested that this can be solved due to further development of computer soft and hard ware and finally particle methods will replace the continuum methods in soil and rock modeling in the future.
Using DEM, many researchers has explored the behavior of pure sand. Evans et al. (2009) investigated the grain size distribution effects in 2D discrete numerical experiments.
Considering the inflexibility of wall structure in DEM, Evans and Frost (2008) created the flexible particle chains to simulate the rubber membrane effects in physical experiment. They concluded that the effects of membrane confinement on mechanical behavior are significant and should be addressed in biaxial numerical test.
33
physical and numerical specimen and validated that the discrete element method is a beneficial tool for the investigation of microstructure.
Bardet and Proubet (1991) developed a two-dimensional code to investigate the shear bands in numerical biaxial test and found the rotation of grains, gradient of particle rotation are concentrated inside the shear bands. In another work of Bardet (1994), he showed the effect of particle rotations on shear strength is significant, although its effect on elastic properties is little.
Using MDEM, which was modified to take into account of rolling resistance, Iwashita and Oda (2000) observed the micro-deformation mechanism of shearing band in biaxial test. They concluded that column-like structure are formed in the hardening process up to failure in a biaxial numerical sample; and in the following strain softening process after the peak, the column-like structure buckled to form large voids(shear bands) between buckling columns. Finally, the microstructure reaches a dynamically stable state (residual state or critical state).
34
Thornton (2000) simulated axisymmetric compression tests in a periodic cell and presented excellent qualitative agreement between discrete element simulation and real experiments. Other kinds of simulation, such as constant deviatoric strain test and multiaxial plane strain test, are conducted to demonstrate the versatility of DEM.
Suiker and Fleck (2004) found the strong effect of Coulomb friction on sliding and rolling between particles by a discrete element model, which showed consistency with the experiment results from traxial tests.
By simulating the triaxial experiment on specimen of steel spheres, Cui et al. (2007) conducted micro-scale analysis using DEM. Furthermore, they emphasized the importance of periodic boundaries to maintain grain-grain contact network continuously.
Belheine et al. (2009) carried out a 3D discrete element simulation on triaxial tests with the consideration of rolling resistance and concluded that larger rolling resistance would always create higher peak stress.
35
became less spherical. Besides, the size of particle relative to the shearbox affected both the peak and residual friction angle significantly. However, when the number of particles exceeds 30,000, the size effect became less marked.
Jacobson et al. (2007) also investigated the specimen size effects for direct shear test using PFC-2D code and suggested that the L/d 10 criterion for specimen size from ASTM may be inappropriate when localized shear band is the research issue.
Other researchers, such as Zhang and Thornton (2007), Cui and O'Sullivan (2006), and Masson and Martinez (2001), also investigate the macro and micro response of granular medium in direct shear test.
36
Other loading conditions, such as plain strain (Suiker and Fleck 2004; W. Powrie et al. ), simple shear (Oda and Konishi 1974), are also simulated by DEM.
Visualization of 3-D numerical sample is another research concern for microstructure analysis. Evans et al. (2009) developed a computer program to virtually slice 3-D numerical samples from simulation. Based on numerical slices, they also made a direct comparison to the two dimensional slices from physical specimen, which make it possible to calibrate numerical model from the view of 3-D microstructure. The progress can lead to improved confidence in the simulation of granular medium by DEM. (Meier 2008) also present a visualization tool to illustrate particle interaction at micro-scale.
2.5.2 Cemented soil simulation by DEM
37
contacts is important to prevent sliding and rotation of grains and thus increases material strength.
Jiang et al. (2006) developed a two dimensional DEM code considering the effect of bond rolling resistance to the yield of cemented granular material and verified that the existence of bond rolling resistance increases yielding stress and friction angle, and leads to more brittle behavior. They suggested that for a more realistic numerical simulation, the rolling effect of bonds should be considered. Using both PFC-2D model and Jiang’s model, Jiang et al. (2011) conducted numerical biaxial tests and obtained good agreement with experimental data.
38
effect is compensated by dilation effect. After the peak strength, numerous bond breakage take place. The compensation for strength from dilation is lower than the loss from the decementation, and thus the strength is lower than the peak value. From the microstructure view, authors showed that most of the bond breakage occurs inside the shear band, in which the particle rotation, local porosity and force concentration is higher than that outside the shear band. Compared with uncemented sand, the force chain network in cemented sand is more stable and the force concentration is also smaller, the reason should be the bonded cluster formed in cemented sand, which reduce the risk of force-chain buckling and higher strength is achieved.
39
from global measurement to physical properties of granular sample should be questioned if the soil sample is shearing with localized strain. It was also shown that two contact networks coexist in cemented granular material. One contact network oriented along the major principal direction to carry compressive forces; the other one are perpendicular to the principal stress direction to carry tensile forces. From the view of micromechanics, they found that the macro yielding process occurs along with the presence of large mobilized region that percolates through the specimen.
2.6 Discussion
40
cemented sand under triaxial undrained compression condition, more tests under varying boundary states are needed. Many of previous research concentrated on environmental and chemical factors effect to bio-cemented soil’s performance. A systematic research about mechanical response of bio-cemented sand is needed. Specifically, the stress-strain behavior of bio-cemented sand, including effects to the yield locus and critical state, should be evaluated as well as the effects of unloading on the stress-strain behavior.
41
42
3 CHARACTERIZATION OF MICP CEMENTED SANDS UNDER
MONOTONIC LOADING
3.1 Introduction
Natural soils are often weakly bonded and the presence of cementation plays an important role in their responses. The responses of artificially cemented soils, such as Portland Cement soil or Bio-mediated soil, are controlled by the cementation medium implemented. The behavior of cemented soils lies in an intermediate area between uncemented soils and rocks based on their mechanical behavior. The traditionally elasto-plastic models derived from clean sand experiments do not work for cemented sand, since cementation becomes the controlling factor to the occurrence of yield state (Airey 1993, Malandraki and Toll 2001).
43
Although some researchers have verified the effectiveness of MICP cemented soil to the increase in shear strength or stiffness under soil column test, unconfined compression tests, triaxial tests and centrifuge tests, investigating the yield and critical states of the bio-cemented sand has not been attempted to date. In this Chapter, three groups of MICP cemented sand with varying bio-cementation level are designed for conventional triaxial tests and 1-D compression tests. Each group also has three confining pressures setup. Corresponding testing of untreated sand are also conducted as the control group. Finally, with a deep understanding on the behavior of MICP cemented soil, the characteristics of it are compared to Portland cement treated soil and naturally cemented soil.
3.2 Influence of confinement and cementation level on the behavior of MICP cemented sands under monotonic drained loading
44
heavily treated) and three levels of effective confining pressure (100 kPa, 200 kPa, and 400 kPa). The results indicate that the stiffness, peak shear strength, and dilation increases with increase in calcite content at a given effective confining pressure and the dilation is suppressed with increase in effective confining pressure. This behavior is consistent with soil-like behavior; therefore, all the MICP soils presented herein are evaluated using critical state soil mechanics and not an analogous fracture mechanics framework. The experimental results also indicate that the improvement in peak and residual friction angles and initial elastic modulus, Ei, are dependent on the levels of cementation and effective confining pressure. The uniformity of MICP cementation in the laboratory specimens is also discussed.
3.2.1 Background on MICP stress-strain behavior
45
MICP has been shown to demonstrate an increase in shear strength (DeJong et al. 2006; Chou et al. 2011; Chu et al. 2012), stiffness (Mortensen and DeJong 2011; Martinez et al. 2013), and dilative tendencies (Montoya et al. 2013), and a reduction in settlement (DeJong et al. 2009; Feng and Montoya 2014). In addition, MICP has the potential to improve large spatial areas of sand (van Paassen et al. 2010) and has the potential to be assessed using in situ techniques such as cone penetration tests (Burbank et al. 2013). These results have advanced MICP towards field implementation; however, before MICP can be implemented in situ, a deeper understanding of its constitutive behavior is necessary.
46
broader range of applications, higher confinements need to be evaluated. In this paper, the behavior of MICP cemented sand subjected to drained monotonic loading is investigated using four cementation levels (i.e., untreated, lightly, moderately and heavily cemented) under higher varying effective confining pressures (i.e., 100 kPa, 200 kPa and 400 kPa). Drained triaxial loading is chosen to eliminate the influence from pore pressure generation during undrained loading. The resulting stress-strain curves and volumetric strain behaviors are presented. Peak and residual strength properties of MICP cemented sand are analyzed. Initial elastic modulus is evaluated as a function of cementation content and effective confining pressure. Finally, the cementation uniformity, based on the treatment procedure presented herein, is also evaluated along the specimen length.
3.2.2 Soil and cementation methods
Ottawa 50-70 sand was used in the tests presented herein, which has a compatible particle size compared to the size of bacteria used in this research (DeJong et al. 2006). Table 3.1 summarizes the grain size characteristics of Ottawa 50-70 sand.
Sporosarcina pasteurii (American Type Culture Collection, ATCC 11859), a common
47
grow the bacteria to the desired population density, an ammonium-yeast extract media (ATCC 1376) was used, which consists of 20 g/L of yeast extract and 10 g/L of ammonium sulfate ((NH4)2SO4) suspended in a 0.13 M Tris buffer at a pH of 9. The growth media was inoculated with the S. pasteurii stock culture aerobically at 30 °C in a shaking incubator at 200 rpm until the desired optical density was reached, ≈ 1.0 (approximately 40 hours before harvesting). The suspended culture was then centrifuged at 4000 g for 15 minutes. The supernatant was removed after the centrifuge period and replaced with fresh growth media. Finally, the desired bacteria were stored in the centrifuge vials at 4 °C until used. Further details on preparing the bacteria for MICP treatments in sand can be found in Mortensen et al. (2011).
48
Cementation media was injected to the soil specimen multiple times until the desired cementation level was achieved (typically 10 – 40 cementation injections).
3.2.3 Experimental details and procedure
Soil specimens were prepared by dry pluviation to target relative densities, DR, (loose, DR 40%, and dense, DR 75%) before a confining pressure was applied. Triaxial specimens with a diameter of about 72 mm and height of about 145 mm were prepared. After specimen preparation, a small amount of vacuum was applied to the soil pore space via the triaxial cell back pressure ports. At this time, the split mold was removed and the actual height and diameter of the specimen was determined. The actual initial relative density of the specimens is listed in Table 3.3. The vacuum applied to the pore space of the specimens was slowly removed as the cell pressure was applied to ensure that the specimens were not over consolidated.
49
during treatment, the pH of the effluent in each treatment was measured. Using the cementation media in Table 3.2, a pH value around 9 indicates the urea has been consumed by the bacteria and the pore fluid remains alkaline (i.e., positive conditions for the cementation process). Typically for the soil specimens presented herein, the activity of the bacteria began to decrease after 6 to 8 injections of cementation media; this was monitored by a drop in effluent pH below a pH value of 8. Once this decrease in bacterial activity was observed, a small amount (about 2 mL) of suspended bacteria was injected with each cementation injection to maintain the bacterial activity. This process, called “bio-dosing”, is fully explained in Martinez (2012).
50
with results from previous work (Burbank et al. 2013; Montoya et al. 2013). The cementation content was determined using the acid washing method discussed below.
After cementation, the effective confining pressure was held constant during the remaining phases of the drained triaxial test. The back-pressure saturation was applied to achieve a B value of 0.95 or higher. The specimen was sheared at a rate of 2.5% axial strain per hour to a maximum strain of 25%. Note that some of the tests were terminated before a strain of 25% was reached due to water leakage from the triaxial chamber.
51
A representative sample of moderately cemented MICP treated sand was collected after shearing and saved for microscopy imaging. Scanning electron microscopy (SEM) images and energy dispersive X-ray spectra were collected using a Hitachi S3200N Variable Pressure Scanning Electron Microscope. Before imaging, the specimens were coated with a gold/palladium alloy to reduce charging while imaging.
3.2.4 Results and discussions
Behavior of Cemented Sand under Varying Cementation Levels
A series of untreated drained triaxial compression tests were performed under varying initial relative densities and confinements. As expected, denser specimens exhibit higher strength, stiffness and dilation compared to looser specimens. With the increase of effective confining pressure, an increase in strength is obtained, and the volumetric deformation behavior transitions from dilative to contractive. The response of the untreated specimens is plotted as a reference to compare the treated soil in the following figures. Note that the Cambridge definitions of deviatoric stress and mean effective stress are used herein are
52
53
The volumetric behavior of the MICP cemented sand demonstrates an increase in dilation compared to the uncemented sand of similar initial relative density (Figure 1b) (note that negative volumetric strain indicates dilation). However, the dense untreated sand experienced the largest negative volumetric strain. At an axial strain of 15%, the untreated dense specimen obtained about 5.5% negative volumetric strain, whereas heavily cemented sands only presented about 3% dilative volumetric strain at same level of axial strain. The higher the cementation cement, the larger and faster the initial dilative tendency was observed. But after 15% axial strain, the volumetric strain of cemented soil tends to be the same. (Note that for 0.9% and 4.3% MICP treated sand, about 25% axial strain was obtained, although only the response to 15% axial strain was shown in Figure 3.1.)
54
stiffness but similar peak and residual strength compared to the untreated specimen. This could in part be explained by the slightly denser initial state of untreated specimen (DR = 48.4%) compared to the 1.4% cemented specimen (DR = 42.8%). In addition, the 5.1% cemented specimen presents similar stress-strain behavior compared to the 2.2% cemented specimen, although 5.1% cemented specimen demonstrated more gradual strain-softening.
Effect of Confining Pressure
55
volumetric strain. Under 400 kPa confining pressure, the lightly cemented specimen demonstrated quite similar stress-strain behaviors compared to the uncemented specimen, although the cemented specimen presented dilative volumetric strain compared to compressive volumetric strain from the uncemented specimen. This implies that under higher confinement, light cementation has a limited influence to change the strength of sands; but light cementation can change the volumetric deformation behavior from contractive to dilative (Figure 3.4). In contrast, the moderately and heavily cemented specimens exhibit higher peak and residual stresses, even at high confining pressures of 400 kPa (Figure 3.5 and Figure 3.6).
56
specimen at 200 kPa confinement even though the average calcite values are similar. The high shear strength for specimen p’c=100, mc=4.3% may be due to the non-uniform calcite content throughout the length of the specimen. The average calcite value of the specimen is 4.3%; however the bottom of the specimen has much higher calcite values, up to about 6.5% calcite. The higher cementation level at the bottom specimen may have influenced the peak shear stress mobilized for the specimen. The uniformity of the cementation through the soil specimens is further discussed in a subsequent section. The resulting dependence of shear strength on confining stress is an indication that the soils tested herein remain “soil-like”. The “soil-like” behavior means that the MICP cemented soils are evaluated using critical states soil mechanics and not an analogous fracture mechanics framework, even at high levels of cementation.
Peak and Residual Strength Parameters
57
increase in cementation results in an increase in peak friction angle for all levels of effective confining pressure tested. With the increase of cementation level, larger peak friction angle is obtained. However, with the increase of effective confining pressure, the peak friction angle is suppressed. The largest peak friction angle, about 53 degrees, was obtained on heavily cemented specimen under lowest effective confining pressure tested (i.e., 100 kPa). Note that this specimen, pc=100, mc=4.3%, has a non-uniform distribution of cementation, as previously discussed, which may be influencing the determined friction angle value. The decrease of friction angle is more dramatic when effective confining pressure increases from 100 kPa to 200 kPa than that from 200 kPa to 400 kPa. For the lightly cemented specimen under 400 kPa effective confining pressure, its peak friction angle tends to be close to that of uncemented specimen.
58
heavily cemented soils demonstrate larger residual friction angles at all levels of confinement, which is likely due to the generated calcite fines and increased roughness.
To assess appropriateness of the assumption that the cohesion is zero for MICP cemented sands, the strength envelopes are evaluated (Figure 3.8). The strength envelops are presented with coordinates of (1 - 3)/2 versus (1 + 3)/2, where the stress conditions can be
59
kPa. However, the increase of peak friction angle of MICP moderately and heavily cemented soil, from about 33° to 40°, is significant. The large peak friction angle is assumed to be related to the particle bonding and increase in particle roughness during the biochemical cementation process.
Based on the presented results, MICP cementation appears to have a large influence on the friction angle strength parameter, especially for moderately and heavily cemented sand; however, the effect of MICP on the cohesion strength parameter is limited, especially in lightly and moderately cemented sand.
Initial Elastic Modulus
The initial elastic modulus is evaluated for the MICP treated specimen at varying levels of cementation and confinement (Figure 3.9). For this analysis, the initial tangent modulus values are used and plotted versus confining pressure using log-log scales. Both initial modulus and confining pressure values are normalized by dividing by the atmospheric pressure, . Equation 3.1 (Clough et al. 1981) is used to fit the modulus and the corresponding parameters are shown in Table 3.4.
60
in which is the initial tangent modulus, K is the intercept at ⁄ , and n is the slope of the line. Note that in Table 3.4, the parameters (K=1680 and n=0.19) for lightly MICP treated soil were fitted through all three specimens under varying confinement. If only the data for the specimens under 200 kPa and 400 kPa were chosen to fit, the parameters would be K=1072 and n=0.58. If further tests are conducted, the final fitting parameters are likely to lie between these two trends.
MICP cementation significantly increases the initial modulus (Figure 3.9). Furthermore, the slope of the modulus decreases with increasing MICP cementation, illustrating that the confining pressure has less of an influence on the modulus as the level of MICP cementation increases. These results are similar to those presented by Montoya et al. (2013), where they demonstrated that the shear stiffness became less influenced by the vertical effective stress with an increase in MICP cementation.
Characteristics and Uniformity of the Precipitated Calcite