ABSTRACT
WAGLE, PRASAD AJIT. Cache Line Boundary Allocation for Garbage Collected Systems. (Under the direction of Dr. Edward F Gehringer.)
Garbage-collected systems became increasingly popular with the release of the Java programming language. Cache performance of garbage-collected systems has been a heavily researched area. Past work has shown that cache-line utilization has been poor in garbage-collected systems. This work aims to reduce the cache miss rate by aligning objects to cache-line boundaries during object allocation. Object alignment on a cache cache-line makes that object use minimum number of cache lines. This improves the overall utilization of a cache line between the time a memory block is brought into the cache and evicted from it. Improved cache utilization translates into improvement in total program execution time. Both cache performance (cache miss rate) and total execution time is studied on the Java Grande, DaCapo suite, Spec JBB2000, Spec JVM98 and soot benchmarks.
The boundary allocation strategy is shown to improve cache performance/execution time for most memory-intensive benchmarks. The strategy performs well when implemented in the old generation of generational collectors. Boundary allocation in the young generation shows only marginal performance improvement. Most objects in the young generation “die” very soon. Hence the advantages of alignment do not outweigh the extra work of allocation.
Cache Line Boundary Allocation for Garbage Collected Systems
by
Prasad Ajit Wagle
A thesis submitted to the Graduate Faculty of North Carolina State University
in partial fulfillment of the requirements for the Degree of
Master of Science
Computer Engineering
Raleigh, North Carolina
2007
APPROVED BY:
_________________________ _________________________ Dr. Suleyman Sair Dr. Yan Solihin
________________________________ Dr. Edward F. Gehringer
DEDICATION
BIOGRAPHY
Prasad Ajit Wagle was born on 29th September 1982 in Mumbai, India. He received his Bachelor of Engineering (Electronics) degree from Fr. Conceicao Rodrigues College of
Engineering, Mumbai, India in 2004. He worked as a Software Engineer with Capgemini
Consulting, India from July 2004 to July 2005. He joined the graduate program at the
Electrical and Computer Engineering Department in North Carolina State University in Fall
2005. He has been working with Dr. Edward F. Gehringer on his master’s thesis since
January 2006. With the defense of this thesis he is receiving the degree, Master of Science in
ACKNOWLEDGMENTS
“Matru devo bhava. Pitru devo bhava. Acharya devo bhava.”
These sentences are in Sanskrit and they mean: I worship my mother, my father and my
teachers as my god.
My foremost thanks to my mentor and advisor: Dr. Ed Gehringer for his constant guidance
and inspiration towards doing productive research. I thank Dr. Suleyman Sair and Dr. Yan
Solihin for being on my committee and making time for me. I thank Dr. Alan Tharp for all
his help. I thank Dr. Jaydeep Marathe and Balaji Iyengar for their valuable inputs and
suggestions on my thesis work.
Special thanks to Ravi Ramaseshan: the Linux guru and for the lively discussions on
architecture and compiler issues. A special mention to the 1619-1 Aficionados group:
amazing people and the place to churn out new research ideas. I also thank Riya Kariath for
her cheerful company and helping me formatting this thesis.
TABLE OF CONTENTS
LIST OF TABLES... vi
LIST OF FIGURES ... vii
INTRODUCTION ... 1
BACKGROUND ... 4
2.1 Memory Allocation... 4
2.1.1 Bump-Pointer Allocation... 4
2.1.2 Free-List Allocation ... 5
2.1.3 Segregated Free-List Allocation ... 6
2.2 Garbage Collectors... 6
2.2.1 Reference Counting ... 7
2.2.2 Mark-sweep Collection... 7
2.2.3 Copy Collection (Semi-Space Collection)... 8
2.2.4 Generational garbage collection ... 9
RELATED WORK ... 11
EXPERIMENTAL METHODOLOGY... 14
4.1 Object Allocation on Cache Line Boundary... 14
4.2 Virtual Machine ... 17
4.3 Benchmarks... 17
4.4 Evaluation Framework... 19
RESULTS ... 21
5.1 Generational Reference Counting collector... 21
5.2 Generational copy collector ... 25
5.3 Probability of Fragmentation ... 32
CONCLUSION... 34
LIST OF TABLES
Table 4.1: Spec JVM98 benchmark description [15] ... 18
Table 4.2: Dacapo benchmark description [13]... 19
Table 4.3: Java Grande benchmark description [12] ... 19
Table 4.4: Machine configuration... 20
Table 5.1: Comparison of parameters like % GC time, GC cycles and survival rate for memory-intensive benchmarks. Numbers highlighted in bold cause’s performance penalty. ... 24
LIST OF FIGURES
Figure 2.1: Semi-space garbage collection: ... 8
Figure 2.2: Generational garbage collection... 10
Figure 4.1: Object allocation on cache line boundary ... 14
Figure 4.2a: Original Bump Pointer allocation code ... 16
Figure 4.2b: Bump Pointer with boundary allocation code ... 16
Figure 5.1: Performance improvement with boundary allocation in nursery ... 22
Figure 5.2: Survival Rate of nursery objects with 244MB nursery ... 23
Figure 5.3: Performance improvement with boundary allocation in old generation ... 25
Figure 5.4: Distribution of object allocation size for benchmarks that perform well in total execution time (pmd, bloat and soot) ... 27
Figure 5.5a: Distribution of object allocation size for benchmarks that perform marginally well in total execution time (antlr, hsqldb, luindex)... 28
Figure 5.5b: Distribution of object allocation size for benchmarks that perform marginally well or marginally diminish in total execution time (jython, Spec JBB and javac) ... 29
Chapter 1
INTRODUCTION
Automatic memory management is one of the biggest attractions of modern
object-oriented languages like Java and C#. On the other hand, languages like C and C++ require
programmer to manage memory allocation and de-allocation. Such manual memory
management may cause problems like dangling pointers and/or memory leaks in the
program. These problems are prevented in garbage-collected systems. But this advantage of
simplified memory management comes with overheads like application pause time and
higher memory footprint.
A garbage-collected system occasionally halts the application program, the mutator,
to reclaim unused memory on the heap. This reclaimed memory is used to satisfy future
allocation requests. This results in significant amount of application pause times, which are
undesirable. Moreover, delaying reclamation of memory until garbage collection is triggered,
results in a temporary increase of memory footprint. Various garbage-collection algorithms,
such as incremental collection, concurrent collection and parallel collection, have been
proposed in the past to reduce these overheads. An incremental collection algorithm
interleaves mutator work with small segments of collector work. This results in small bursts
of pause times instead of occasional big pause time, desirable to ensure real-time guarantees.
In contrast, concurrent collectors schedule a separate collector thread, which runs in parallel
with the mutator thread without halting the mutator. A parallel collection algorithm,
(usually one for each mutator thread), which does collection work in parallel, thereby
reducing pause time. Both concurrent and parallel collection algorithms are more commonly
used on multi-processor/multi-core systems to exploit thread-level parallelism and hence also
require synchronization to ensure correct execution.
Apart from reclaiming memory, a garbage-collected system spends significant time in
allocating memory. Some of the metrics that determine efficiency of an allocation policy are
memory fragmentation, and time spent in allocation code. Allocation policies like
bump-pointer allocation and segregated free-lists have been proposed in the past. The bump-pointer
policy satisfies memory requests by advancing a “bump-pointer” through an available
memory chunk. A garbage collector traverses the object graph, marks the live objects and
copies them to a free memory chunk and reclaims the old memory chunk. This collector is
called as semi-space collector since it divides the heap space into two spaces: one is used to
allocate objects and the other is used to copy live objects at every collection.
On the other hand, a segregated free-list maintains collection of free memory blocks:
multiple lists, each with blocks of a particular size. An allocation request is satisfied by
allocating memory from a free-list of block size greater than or equal to the requested size.
The garbage collector marks the live objects by doing an object graph traversal and returns
references to unmarked objects (blocks) to the respective free-lists. This collection policy is
called a mark-and-sweep collection since the collection work is divided into two phases:
marking of live objects and sweeping of dead objects. The simplicity of a bump-pointer
comes at a cost of copying live objects at each garbage collection cycle, whereas a segregated
Performance of a garbage collection/allocation algorithm heavily depends on efficient
utilization of the underlying hardware. Past research has exploited temporal locality using
patterns of access to objects. These access patterns are recorded during the mutator phase,
and then used to sort live objects during garbage collection so that objects that are accessed
in succession are located adjacent to each other. With the increasing cache-line size and
bigger caches, it becomes important to study how these objects are packed in a cache/cache
line.
The goal of this thesis is to study the impact of cache-line sharing amongst objects for
a uni-processor system. An optimization to the bump-pointer allocation policy is proposed:
Allocate objects such that they span the minimum number of cache lines. For objects smaller
than cache-line size, ensure that objects are allocated within a cache-line boundary. For
objects bigger than cache-line size, start the allocation at a cache-line boundary: this ensures
that an object uses the minimum number of cache lines. This optimization ensures that
minimum numbers of cache lines are brought into the cache when an object is referenced.
Moreover it is expected to reduce the amount of false sharing among multi-processor caches.
However this optimization leads to fragmentation because of object alignment on cache-line
boundaries. Fragmentation is expected to reduce with increasing cache-line size.
The experiments study cache performance using Vtune Performance Analyzer for
existing and proposed allocation strategies with generational garbage collector. Workloads
from the DaCapo benchmark suite, Spec JVM 98, Spec JBB2000 and Java Grande
benchmarks are used for evaluation.
Chapter 2
BACKGROUND
This chapter introduces the terminology used in this research. Memory allocation is
discussed in section 2.1. Section 2.2 discusses different garbage-collection algorithms.
2.1 Memory Allocation
Memory allocation can be performed according to three disciplines: static, stack and
heap. Static memory allocation happens at compile time and is used for data like global
variables and constants. Stack memory is allocated at run time and consists of thread-local
variables, function parameters and function return values. Heap allocation refers to dynamic
memory allocation of objects that will outlive the activation of the procedure that created
them, or whose size could not be determined at compile time. This research focuses on
optimizing heap allocation. There are various ways to manage heap memory, eg.,
bump-pointer allocation, free-list allocation, buddy allocation.
2.1.1 Bump-Pointer Allocation
Bump-pointer allocators allocate monotonically increasing addresses. Each time
memory is allocated, a pointer is incremented (bumped) past the region that is being
allocated. This results in a contiguous object layout. The allocator obtains a finite number of
pages from the virtual memory manager. These pages constitute a memory chunk. The
bump-pointer initially points to the start of the chunk and is incremented by object size at
becomes full, a garbage-collection cycle is triggered in order to free memory. Bump-pointer
is one of the simplest and fastest allocation algorithms. When allocation can be done from the
current, chunk, the algorithm is said to use its “fast path.” The fast path of this algorithm
executes only a few instructions including a check for chunk exhaustion, bumping the pointer
and returning an address. The slow path of the allocation sequence checks whether a
garbage-collection cycle needs to be triggered, requests pages from the memory manager,
and initializes the bump-pointer. A sufficiently large chunk size can make the fast path a
common case and improve performance. This allocation algorithm is used with semi-space
collectors [1]. A semi-space collector divides the heap into two equally sized regions called
semi-spaces. The allocation algorithm allocates memory in one of the spaces called
from-space (while other semi-space called to-space is kept free). When from-space becomes full, a
garbage-collection cycle is triggered. The garbage collector compacts the heap by copying
live objects to to-space and then freeing the from-space. Thus one of the drawbacks of
bump-pointer allocation is that it requires object motion at every garbage-collection cycle. The
garbage-collection algorithms are explained in the next section.
2.1.2 Free-List Allocation
Free-list allocation operates by connecting unallocated regions of memory in a linked
list. Each node in the free-list can be of different size. When allocating memory, the
algorithm searches the free-list for a node big enough to hold the object. When such a node is
found, it is deleted from the free-list and the address is returned. A garbage-collection cycle
is initiated when an allocation request cannot be satisfied from the free-list. Memory freed in
not require moving objects at every garbage collection. However, traversing a free-list at
each allocation causes a big overhead and deteriorates performance. Moreover, this strategy
does not collocate successively allocated objects on the heap. This makes it difficult to
exploit spatial locality.
2.1.3 Segregated Free-List Allocation
Segregated free-list allocation is an extension of the free-list allocation explained in
the previous sub-section. It maintains different free-lists for different object sizes called size
classes. When allocating memory for an object, the algorithm requests memory from a
free-list of a size class that is big enough to hold the object. This removes the overhead of
searching through a free-list common to all size classes. Segregated free-list allocation is
used with in-place collectors like reference counting and mark-sweep garbage collection
(explained below).
2.2 Garbage Collectors
Garbage collectors can be classified into two broad categories: object-moving and
non-moving collectors. A moving collector compact the heap by collocating live objects
during each garbage collection cycle. This leaves a contiguous free memory region for future
allocation requests. Semi-space and mark-compact [1] collectors are well known
object-moving collectors. Moving collectors perform very well when the number of live objects
remaining at each collection cycle is small. The smaller the survival rate, the smaller is the
In-place collectors, on the other hand, use free-lists to manage the heap and avoid
object motion. At the end of every collection cycle, memory occupied by unreachable objects
is returned back to the free-list, and can be used for future allocations. Mark-sweep collectors
and reference counting are non-moving collectors. The overhead of maintaining the free-list
is reduced if object survival rate is high.
2.2.1 Reference Counting
The reference count of an object is defined as the number of pointers that reference
that object. A reference-counting algorithm maintains a reference count for each object.
When an object is allocated, its reference count is initialized to one. This value is
incremented when a reference is added to the object and decremented when a pointer to the
object is deleted or overwritten. When the reference count falls to zero, the object is no
longer reachable (it becomes dead) and can be collected immediately. Thus the work of
garbage collection is distributed over the program execution phase. Hence reference counting
is called as an incremental garbage-collection algorithm.
An advantage of this strategy is that a dead object can be reclaimed almost
immediately. However the reference-count adjustment during pointer manipulation is an
overhead. Another disadvantage of this algorithm is that it is not able to reclaim cyclic data
structures [1].
2.2.2 Mark-sweep Collection
Mark-sweep garbage collection involves two phases called “mark” and “sweep”.
Every object has a bit associated with it, to identify if that object is live. Garbage collection
begins after all live objects are traversed. All unmarked objects are now returned to the
free-list. A garbage-collection cycle is triggered when the heap becomes full. Unlike reference
counting, this algorithm can handle cyclic data structures without any special code. However,
full-heap garbage collection causes long pause times.
2.2.3 Copy Collection (Semi-Space Collection)
Copying garbage collection organizes the heap as two semi-spaces (from-space and
to-space). The allocation starts in the from-space. When the from-space is full, garbage
collection is triggered and live objects are copied to to-space. At the end of garbage
collection cycle, the roles of the from-space and to-space are reversed.
Figure 2.1: Semi-space garbage collection: Objects are first allocated in the to-space. When
garbage collection is triggered, live objects A, B and C are copied to from-space. Objects D, E and F are unreachable and hence garbage. Then the roles of from-space and to-space are reversed.
To Space
To Space From Space
From Space A
B C
D Root set
A B C
Root set
An advantage of copying garbage collection is that it can use faster allocation
algorithms. Moreover it is a compacting collector i.e. all live data is compacted to the bottom
of to-space on every garbage collection. Compaction of live data prevents fragmentation.
However the disadvantage is that twice as much address space is needed.
2.2.4 Generational garbage collection
Generational collectors are based on the hypothesis that most objects die young [3, 4].
Around 65% to 95% of objects in Java programs are short-lived [4]. A generational strategy
divides the heap into two or more generations: a nursery (or the young generation) and one or
more old generations. A new object is allocated in the nursery region. When the nursery
region runs out of space, a garbage-collection cycle is triggered and live objects are copied
(promoted) to the old generation. The nursery becomes free to satisfy future allocation
requests.
Generational collection reduces pause times: Shorter collections are performed on
small nurseries and the full heap is collected less frequently. Unlike semi-space collectors,
generational collectors do not copy long-lived objects repeatedly at each collection cycle; an
object once promoted to old generation is not touched during nursery collection. This
improves virtual-memory performance since the allocator is now working on a small memory
space: the nursery. References from an object in the old generation to a nursery object are
remembered as a part of the root set. A root set is defined as set of objects directly reachable
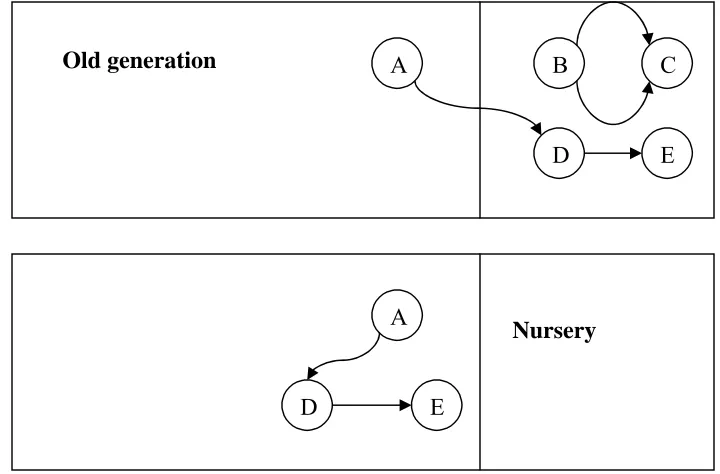
Figure 2.2: Generational garbage collection: Objects are first allocated in the nursery.
Objects that survive garbage collection are promoted to old generation. Objects B and C are unreachable and hence garbage. Objects D and E are reachable from object A (part of the root set for nursery collection). Hence objects D and E are promoted to old generation. The nursery becomes free at the end of collection.
While the old generation does not need to be collected as frequently as the nursery, it
does occasionally need attention. The old generation can be collected using either a moving
or in-place collector. This work experiments with reference counting and a semi-space
collector for old generation.
A B C
D E
A
D E
Old generation
Chapter 3
RELATED WORK
There have been many studies of cache performance of garbage-collected systems
using heap allocation. Peng and Sohi [6] studied cache behavior for Lisp programs. They
proposed an ALLOCATE instruction to improve cache performance, which allocates
memory in a cache without reading it from the memory.
Reinhold [17] in his research found that sophisticated collectors are unnecessary to
improve cache performance. He found that programs perform well even with a simple
generational compacting collector. His studies show that cache performance was best with
infrequent garbage collection. This stands to reason, because a garbage collection, which
touches all accessible objects, results in the ejection of many actively referenced objects from
the cache. However, his research studied only direct-mapped caches, which now are almost
extinct.
Generational collectors have very good virtual-memory performance compared to
other collectors, because only a small memory space (the nursery region) is being recycled
frequently. This small frequently reused area tends to stay in main memory. Wilson, Lam and
Moher [5] extended this idea to improve cache performance: A cache miss-rate would
decline if the entire nursery region fits into the cache. In other words performance is better
with nursery size less than the cache size. Investigations also revealed that the majority of
Zorn [9] studied the impact of various garbage-collection algorithms on cache
performance. He used trace-driven simulation to analyze four common Lisp programs. He
found that a generational copy collector increased the cache miss rate by four times over a
generational mark-and-sweep collector, in a direct mapped cache. Furthermore, the miss rate
was reduced by up to a factor of five, when a two-way associative cache was used with a
generational copy collector.
Chilimbi and Larus [7] proposed a real-time profiling technique that studies the data
access patterns and allocates objects to extract temporal locality. Such cache-conscious data
placement guided by profiling runs, improves cache performance.
Diwan, Tarditi and Moss [8] studied the performance of generational garbage
collection in ML using various cache configurations. They used the Standard ML of New
Jersey compiler. The best performance was achieved with a cache that had sub-block
placement and a write-allocate policy.
Hirzel [10] evaluated the cache and TLB performance for ten different data layouts.
The objects are sorted during copying garbage collection and outside of garbage collection.
The layout of objects in old generation after they are sorted is called as a data layout.
Both Chilimbi [7] and Hirzel [10] have used data access patterns to sort objects and
hence enhance performance. He concludes that data layouts are important for program
performance and that almost all layouts yield best performance for some programs and worst
for others.
The goal of this thesis work is to evaluate how sharing of cache lines among objects
cache lines is used for each object. This would reduce the number of cache lines brought in
when an object is referenced and hence reduce the cache miss rate. This work aims at
improving cache performance and overall program execution time by allocating objects on
Chapter 4
EXPERIMENTAL METHODOLOGY
4.1 Object Allocation on Cache Line Boundary
The goal of this thesis work is to improve cache performance by reducing the amount
of cache-line sharing among objects. Sharing of a cache line among objects can be reduced
by allocating objects on a cache-line boundary: An object should be allocated such that it
occupies minimum number of cache lines.
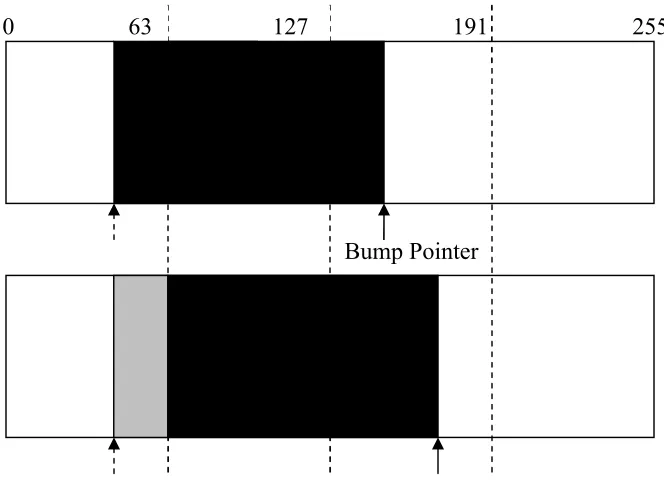
Figure 4.1: Object allocation on cache line boundary: A memory region used by a
bump-pointer allocator is shown. Dotted lines are cache line boundaries. The top diagram shows regular bump-pointer allocation, which allocates memory space by bumping a pointer by object size (shaded in black). The shaded object occupies 3 cache lines. The second diagram shows allocation on a cache-line boundary. The grey shaded space is an unallocated region called a hole. In this case, an object occupies only 2 cache lines.
0 191 255
Bump Pointer
This strategy is expected to improve cache performance by reducing the number of
cache lines brought in to the cache when an object is read. This advantage comes at the
expense of increased fragmentation, as shown in Figure 4.1. Fragmentation is caused due to
object alignment on cache line boundary. Alignment is only necessary if an object occupies
more number of cache lines than required. Such fragmentation could cause extra
garbage-collection cycles and possibly degrade performance.
This thesis aims at evaluating performance of this strategy using a generational
collector. The first set of experiments use a generational reference counting collector. They
use a nursery of big enough size (15% of virtual memory size) which is copy-collected. A
reference counting algorithm is used for the old generation. The allocation optimization is
employed only for the nursery objects. A bigger nursery is used to delay object promotion, so
that objects spend more time in nursery where optimization is performed. A second set of
experiments use a generational copy collector, which, unlike generational reference counting,
uses a semi-space collector for the old generation. A smaller nursery (less than 1% of virtual
memory) is used and the allocation optimization is performed only for old-generation
objects. Smaller nursery size also helps to reduce mutator pause times.
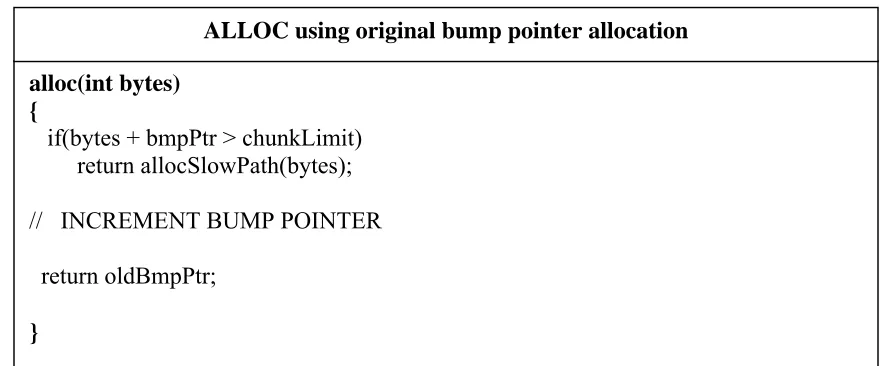
Figure 4.2 compares pseudo-code for the original bump-pointer allocation with code
for bump-pointer with cache-line alignment. Apart from fragmentation, the strategy has the
overhead of a few extra instructions in the fast path. These extra instructions include
bump-pointer alignment, calculating number of cache lines used and minimum number of cache
lines required. To benefit from this strategy, the cache performance improvement from the
Figure 4.2a: Original Bump Pointer allocation code: Pseudo-code for bump-pointer
allocation. It includes a check for chunk exhaustion, bump-pointer increment, and return of the start address of the allocated memory. The slow path is taken when the chunk becomes full.
Figure 4.2b: Bump Pointer with boundary allocation code: Pseudo-code for bump-pointer
allocation with alignment on cache-line boundary. It includes a check for chunk exhaustion, a check for number of cache lines used, alignment of the bump-pointer, bump-pointer increment and return of the start address of the allocated memory. The slow path is taken when the chunk becomes full.
alloc(int bytes) {
if(bytes + bmpPtr > chunkLimit)
return allocSlowPath(bytes);
// INCREMENT BUMP POINTER
return oldBmpPtr;
}
ALLOC using original bump pointer allocation
alloc( int bytes) {
if(bytes + bmpPtr < chunkLimit) {
if(NUM_CACHE_LINE_USED = = MIN_CACHE_LINES_REQD) // increment BUMP POINTER & return OLD BUMP POINTER else
{
// Align the BUMP POINTER to next CACHE_LINE_BOUNDARY // increment BUMP POINTER & return OLD BUMP POINTER }
}
return allocSlowPath(bytes);
}
4.2 Virtual Machine
Jikes RVM version 2.4.1 [2] was used for this study. It is a widely used open-source
research virtual machine whose memory management toolkit (MMTk) [11] provides an
efficient and extensible framework to implement garbage collection algorithms. MMTk was
configured for a generational collector using a baseline compiler (compiler that does not
optimize the byte code). This work uses a generational reference counting collector (GenRC)
and generational copy collector (GenCopy) for experiments. Fixed-size nurseries were used
for both configurations [11]. GenRC uses a bigger nursery of size equal to 15% of total
virtual memory (244MB on the machine used), whereas GenCopy uses a nursery of less than
1% of virtual memory (< 16MB). The bump-pointer allocation code was modified for
cache-line alignment, as shown in figure 4.2b. Nursery region of the GenRC collector uses this
modified bump-pointer allocator whereas the reference-counted old generation uses a
segregated free-list allocator. GenCopy collector uses unmodified bump-pointer allocator for
the nursery region and the modified code for the old generation semi-spaces. Each
benchmark was run 6 times in a native x86 Linux environment and the median of execution
times were used for analysis.
4.3 Benchmarks
The Java Grande benchmarks [12] were chosen because they were readily available
and stress memory system, bandwidth and processing power. We also used other
memory-intensive benchmarks including the DaCapo benchmark suite [13], Spec JBB2000 [14], Spec
were not used because they were incompatible with Jikes RVM at the time research was
performed. Spec JBB2000 is used for evaluating server-side performance for Java
applications. It emulates a 3-tier system, the most common type of server-side Java
application today. Soot is a Java optimization framework used for optimization or
transformations on Java byte code.
Table 4.1: Spec JVM98 benchmark description [15] Benchmark Description
_201_compress Modified Lempel-Ziv method (LZW). Basically finds common substrings and replaces them with a variable-size code. This is deterministic, and can be done on the fly. Thus, the decompression procedure needs no input table, but tracks the way the table was built. _202_jess JESS is the Java Expert Shell System is based on NASA's CLIPS
expert shell system. In simplest terms, an expert shell system continuously applies a set of if-then statements, called rules, to a set of data, called the fact list. The benchmark workload solves a set of puzzles commonly used with CLIPS. To increase run time the benchmark problem iteratively asserts a new set of facts representing the same puzzle but with different literals. The older sets of facts are not retracted. Thus the inference engine must search through progressively larger rule sets as execution proceeds.
_209_db Performs multiple database functions on a memory resident database. Reads in a 1MB file which contains records with names, addresses and phone numbers of entities and a 19KB file called scr6 which contains a stream of operations to perform on the records in the file. The program loops and reads commands till it hits the q command. _213_javac This is the Java compiler from the JDK 1.0.2.
_222_mpegaudio This is an application that decompresses audio files that conform to the ISO MPEG Layer-3 audio specification. The workload consists of about 4MB of audio data.
_227_mtrt This is a variant of _205_raytrace, a raytracer that works on a scene depicting a dinosaur, where two threads each renders the scene in the input file time-test model, which is 340KB in size.
Table 4.2: Dacapo benchmark description [13] Benchmark Description
Antlr parses one or more grammar files and generates a parser and lexical analyzer for each
Bloat performs a number of optimizations and analysis on Java bytecode files
Chart uses JFreeChart to plot a number of complex line graphs and renders them as PDF
Eclipse executes some of the (non-GUI) JDT performance tests for the Eclipse IDE
hsqldb executes a JDBCbench-like in-memory benchmark, executing a number of transactions against a model of a banking application jython interprets a the pybench Python benchmark
luindex Uses lucene to indexes a set of documents; the works of Shakespeare and the King James Bible
lusearch Uses lucene to do a text search of keywords over a corpus of data comprising the works of Shakespeare and the King James Bible pmd analyzes a set of Java classes for a range of source code problems
Table 4.3: Java Grande benchmark description [12] Benchmark Description
montecarlo A financial simulation, using Monte Carlo techniques to price products derived from the price of an underlying asset.
raytracer Measures the performance in pixels/sec of a 3D raytracer.
moldyn N-body code modeling particles interacting under a Lennard-Jones
potential in a cubic spatial volume with periodic boundary conditions.
4.4 Evaluation Framework
Experiments were performed on stock hardware instead of using a simulator.
Improvement in wall clock time is used as one of the metrics. Cache-performance numbers
were obtained by reading hardware counters using Intel’s Vtune performance analyzer [16].
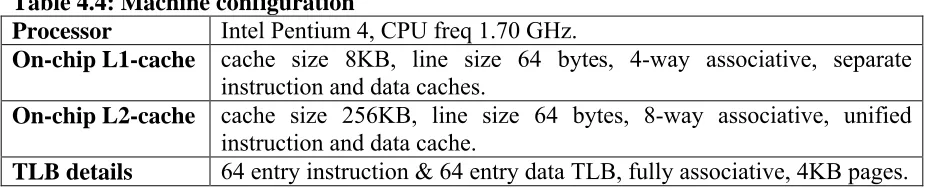
Table 4.4: Machine configuration
Processor Intel Pentium 4, CPU freq 1.70 GHz.
On-chip L1-cache cache size 8KB, line size 64 bytes, 4-way associative, separate
instruction and data caches.
On-chip L2-cache cache size 256KB, line size 64 bytes, 8-way associative, unified
instruction and data cache.
TLB details 64 entry instruction & 64 entry data TLB, fully associative, 4KB pages.
4.4.1 VTune Performance Analyzer
The VTune performance analyzer version 9.0 was used in this experiment to measure
cache performance. It uses low-overhead event-based sampling to read the hardware
counters. Overhead incurred by sampling is typically less than 5%. Event-based sampling
interrupts the processor after a certain number of events; this is called as a sample after
value. Hardware counters are read during this interrupt period. Numbers specific to a process
are collected and stored in a file. These numbers can be viewed using a module called view.
VTune is capable of measuring various events relevant to cache performance. This
work uses an event called L2 Cache Read Misses which is the count of cacheable load
memory accesses that incurred a miss in L2 cache. This count is a good indicative of cache
performance due to LOADS to heap memory. Next chapter discusses performance results of
Chapter 5
RESULTS
The success of allocation on a cache-line boundary can be measured by diminished
wall-clock time and reduction in the cache miss rate. L2 cache miss rates were measured
using Intel’s Vtune analyzer as mentioned in section 4.4. Total execution time is measured
using separate runs than used for measuring cache miss rate. This avoids the overhead of
sampling the hardware counters used for measuring cache miss rate.
The first set of experiments (section 5.1) use a generational reference-counting
collector with a nursery size equal to 15% of total virtual memory. The boundary allocation
strategy is used only for young-generation objects. The second set of experiments use a
generational copy collector. Its nursery size is less than 1% of total virtual memory.
Experiments were run using nursery sizes between 1MB and 8MB. The boundary-allocation
strategy is used only for old-generation objects. All experiments are performed on a machine
with a 256KB L2 cache and a 64-byte cache-line size.
5.1 Generational Reference Counting collector
The generational reference-counting collector uses a 244MB nursery (15% of virtual
memory) with a bump-pointer allocator. A total heap size of 900MB is used so that full heap
collection does not occur. When both the young and the old generations are
garbage-collected, it is called a full heap collection. This thesis aims at improving mutator
garbage-collection performance. Hence full heap garbage-collection is avoided in all the experiments by using
a large enough heap.
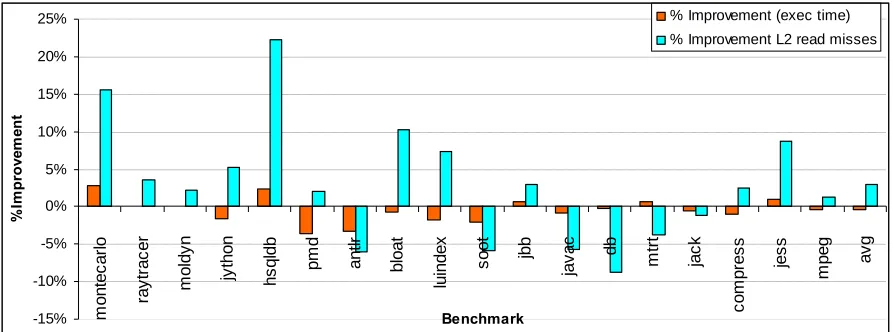
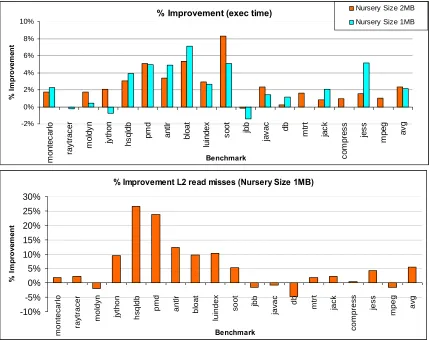
Figure 5.1: Performance improvement with boundary allocation in nursery: Percentage
improvement in total execution time and L2 read misses because of boundary allocation strategy. This strategy is only applied to young-generation objects. L2 cache of size 256KB is used.
Performance improvement because of boundary allocation is shown in figure 5.1.
Total execution time and L2 read misses are used as performance metrics for comparison.
The graph has a separate column for each benchmark. The last column shows average
improvement across all benchmarks.
Average execution time deteriorates as shown in the graph. Also, the average
improvement in L2 read misses is barely positive. The performance deterioration in
execution time is because of the overhead of aligning nursery objects on a cache-line
boundary. Although improvement in cache performance was expected, the results show
otherwise. To investigate reason for the diminished performance, we look at a metric called
Survival rate: the average fraction of objects (size) that outlive nursery collection.
Performance does not improve because of low survival rates of nursery objects in these
-15% -10% -5% 0% 5% 10% 15% 20% 25% m o n te c a rl o ra y tr a c e r m o ld y n jy th o n h s q ld b p m d a n tlr b lo a t lu in d e x s o o t jb b ja v a c d b m tr t ja c k c o m p re s s je s s m p e g a v g Benchmark % Im p ro ve m en t
benchmarks. As shown in Figure 5.2, the average survival rate is around 15%. This means
that on an average 85% of the objects allocated die “young”—before they can be
garbage-collected. The boundary-allocation scheme can improve performance only if cache lines
(objects) are brought back into the cache. With only 15% objects surviving, there is less
probability that a live object would be evicted and brought back into the cache.
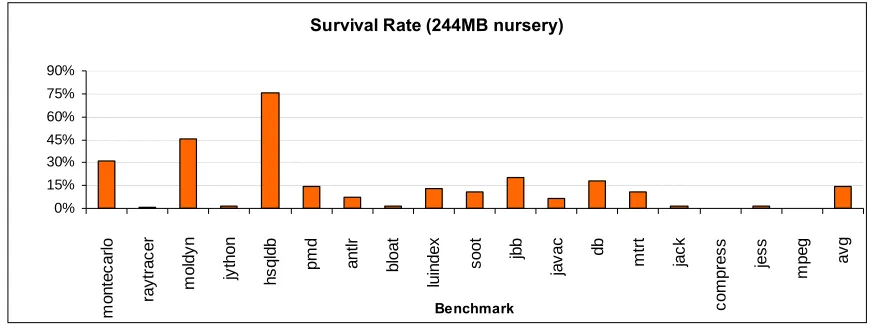
Figure 5.2: Survival Rate of nursery objects with 244MB nursery: The survival rate of
nursery objects is shown in the figure. Nursery size of 244MB is used. Last column shows the average of survival rates across all benchmarks.
Survival rate (Figure 5.2) correlates very well with L2 read misses (Figure 5.1) for
most of the benchmarks. For example, the hsqldb benchmark from the DaCapo suite has a
survival rate of around 75%, and shows 23% improvement in L2 read misses. Some
benchmarks like moldyn that show good survival rate but are not memory intensive
(allocates only 5MB memory) and hence do not show performance improvement. Apart from
low survival rate, other parameters that cause performance deterioration are the percentage
time spent doing garbage collection (% GC time) and number of extra garbage collection
cycles caused because of boundary allocation (num. extra GC cycles). Extra GC cycles occur Survival Rate (244MB nursery)
because of fragmentation in nursery (due to boundary allocation) which increases the total
execution time. Nursery collection traverses the live objects and copies them to the old
generation. An object that gets copied is not re-referenced before garbage collection finishes:
The cache hit rate is very poor during garbage collection, and boundary allocation can
improves it only when an object is re-referenced. Hence the advantage of boundary allocation
dimishes as % GC time rises.
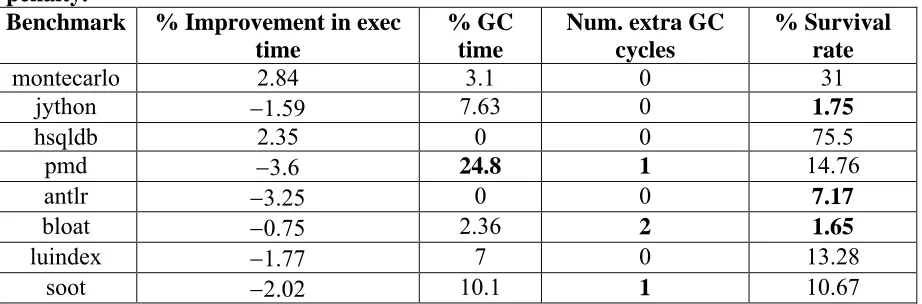
Table 5.1 compares these parameters for memory intensive-benchmarks. Benchmarks
that cause extra GC cycle (pmd, bloat and soot) have all shown performance deterioration.
Pmd spends about 25% of total execution time doing GC and is also the benchmark that
shows maximum performance deterioration (–3.6%). On the other hand, the montecarlo and
hsqldb benchmarks that show substantial performance improvement have good survival rate,
spend little time doing GC and do not cause extra GC cycles.
Table 5.1: Comparison of parameters like % GC time, GC cycles and survival rate for memory-intensive benchmarks. Numbers highlighted in bold cause’s performance penalty.
Benchmark % Improvement in exec time
% GC time
Num. extra GC cycles
% Survival rate
montecarlo 2.84 3.1 0 31
jython 1.59 7.63 0 1.75
hsqldb 2.35 0 0 75.5
pmd 3.6 24.8 1 14.76
antlr 3.25 0 0 7.17
bloat 0.75 2.36 2 1.65
luindex 1.77 7 0 13.28
5.2 Generational copy collector
Figure 5.3: Performance improvement with boundary allocation in old generation:
Percentage improvement in total execution time and L2 read misses with a boundary-allocation strategy. This strategy is only applied to old generation objects. L2 cache of size 256KB is used. Nursery sizes of 1MB and 2MB are used.
This collector uses copy collection for both young and old generations. The
boundary-allocation strategy is implemented only in the old generation. The generational
hypothesis states that most of the objects die young. Old-generation objects are less likely to
die very soon. With higher survival rates for old-generation objects, cache performance is
% Improvement (exec time)
-2% 0% 2% 4% 6% 8% 10% m o n te c a rl o ra y tr a c e r m o ld y n jy th o n h s q ld b p m d a n tl r b lo a t lu in d e x s o o t jb b ja v a c d b m tr t ja c k c o m p re s s je s s m p e g a v g Benchmark % I m p ro ve m en t
Nursery Size 2MB
Nursery Size 1MB
% Improvement L2 read misses (Nursery Size 1MB)
expected to improve. Moreover, nursery collections are more frequent than old-generation
collection. This forestalls motion of old-generation objects for a longer time than young
generation objects. Hence for benchmarks that have considerable number of old generation
objects, a live object from the old generation is more likely to be re-referenced before
collection than a live object in the young generation.
Nursery sizes of less than 1% of virtual memory size (1MB and 2MB) are used for
this experiment. Smaller nurseries are used to reduce the pause times due to nursery
collection. Also, with smaller nurseries, the old generation will have a larger impact on cache
performance. As shown in Figure 5.3, better performance is seen with this strategy than when
boundary allocation was done for the nursery. Although the average improvement in
execution time is only around 2%, soot and most of the memory-intensive benchmarks in the
DaCapo suite have improved by more than 4%. Improvement in L2 read misses correlates
very well with improvement in execution time.
Although most of the benchmarks from DaCapo suite perform very well with the
boundary-allocation strategy, some memory-intensive benchmarks, such as Montecarlo from
the Grande suite, Spec JBB, and Jython from the DaCapo suite don’t perform very well. To
Figure 5.4: Distribution of object allocation size for benchmarks that perform well in total execution time (pmd, bloat and soot).
Object alloc distribution (pmd)
0% 10% 20% 30% 40% 50% 1 6 2 0 2 4 2 8 3 2 3 6 4 0 4 4 4 8 5 2 5 6 6 0 6 4 6 8 7 2 7 6 8 0 8 4 8 8 9 2 9 6 1 0 0 1 0 4 1 0 8 1 1 2 1 1 6 1 2 0 1 2 4 1 2 8 + bytes
Object alloc distribution (bloat)
0% 10% 20% 30% 40% 1 6 2 0 2 4 2 8 3 2 3 6 4 0 4 4 4 8 5 2 5 6 6 0 6 4 6 8 7 2 7 6 8 0 8 4 8 8 9 2 9 6 1 0 0 1 0 4 1 0 8 1 1 2 1 1 6 1 2 0 1 2 4 1 2 8 + bytes
Object alloc distribution (soot)
Figure 5.5a: Distribution of object allocation size for benchmarks that perform marginally well in total execution time (antlr, hsqldb, luindex).
Object alloc distribution (hsqldb)
0% 10% 20% 30% 40% 1 6 2 0 2 4 2 8 3 2 3 6 4 0 4 4 4 8 5 2 5 6 6 0 6 4 6 8 7 2 7 6 8 0 8 4 8 8 9 2 9 6 1 0 0 1 0 4 1 0 8 1 1 2 1 1 6 1 2 0 1 2 4 1 2 8 + bytes
Object alloc distribution (antlr)
0% 5% 10% 15% 20% 25% 1 6 2 0 2 4 2 8 3 2 3 6 4 0 4 4 4 8 5 2 5 6 6 0 6 4 6 8 7 2 7 6 8 0 8 4 8 8 9 2 9 6 1 0 0 1 0 4 1 0 8 1 1 2 1 1 6 1 2 0 1 2 4 1 2 8 + bytes
Object alloc distribution (luindex)
0% 10% 20% 30% 40% 1
6 20 24 28 32 36 40 44 48 52 65 60 64 68 72 67 80 84 88 92 96
Figure 5.5b: Distribution of object allocation size for benchmarks that perform marginally well or marginally diminish in total execution time (jython, Spec JBB and javac).
Object alloc distribution (Spec JBB)
0% 5% 10% 15% 20% 25% 30% 1 6 2 0 2 4 2 8 3 2 3 6 4 0 4 4 4 8 5 2 5 6 6 0 6 4 6 8 7 2 7 6 8 0 8 4 8 8 9 2 9 6 1 0 0 1 0 4 1 0 8 1 1 2 1 1 6 1 2 0 1 2 4 1 2 8 + bytes
Object alloc distribution (Jython)
0% 5% 10% 15% 20% 1 6 2 0 2 4 2 8 3 2 3 6 4 0 4 4 4 8 5 2 5 6 6 0 6 4 6 8 7 2 7 6 8 0 8 4 8 8 9 2 9 6 1 0 0 1 0 4 1 0 8 1 1 2 1 1 6 1 2 0 1 2 4 1 2 8 + bytes
Object alloc distribution (javac)
Distribution of object allocation size in the old generation was plotted for each
benchmark. To plot the distribution, 32 counters were used at a granularity of 4 bytes per
counter, starting from 0 bytes allocated. For example, when an object of size 24 bytes is
allocated, counter number 6 will be incremented. All objects with sizes more than 128 bytes
(32 counters 4 bytes) were counted by the last counter (counter number 32). A nursery of
size 1MB was used for this experiment.
The distributions are shown in Figure 5.4 and Figure 5.5. Figure 5.4 shows
distributions for benchmarks that perform very well in total execution time. Figure 5.5 shows
distributions for benchmarks that either show marginal improvement or marginal degradation
in total execution time. The Raytracer and Moldyn benchmarks from the Grande suite, and
JVM98 benchmarks were excluded from this experiment because they are not
memory-intensive benchmarks.
It can be seen from Figure 5.4 that all benchmarks that perform well have more than
50% their object allocations less than 28 bytes long (less than half of the L2 cache line size of
64 bytes). Bloat, Pmd and Soot benchmarks, which improved by more than 5% in total
execution time, have more than 70% object allocations of size less than 28 bytes. On the
other hand, it can be seen from Figure 5.5 that benchmarks that have significant numbers of
allocations larger than 28 bytes show marginal improvement or deterioration in performance.
Table 5.2: Comparison of allocation rates in old generation and objects size distribution (< 24 bytes) for all benchmarks.
Benchmark Alloc rate in old generation
(MB/sec)
Is Memory intensive?
Are more than 30% of allocations less than ⅓
cache-line in size (24 bytes)?
montecarlo 3.05
raytracer 0.015
Moldyn 0.02
jython 0.2
hsqldb 2.42
pmd 0.78
antlr 1.04
bloat 0.2
luindex 0.77
soot 0.57
jbb 0.9
db 0.14
mtrt 0.13
jack 0.12
compress 0.01
jess 0.08
mpeg 0.03
Table 5.2 compares parameters including allocation rate in old generation and object
size distribution (< 24 bytes) for all benchmarks. All benchmarks with allocation rate above
0.2 MB/sec are considered memory intensive. All memory intensive benchmarks that have
more than 30% of allocations less than ⅓ cache-line size perform well.
As discussed earlier, the boundary-allocation strategy helps only if the amount of
fragmentation caused by object alignment to cache-line boundaries is low. The next section
shows that fragmentation is greater with larger object sizes. With increased fragmentation,
the cache can accommodate fewer objects. This will cause extra cache misses and hence
5.3 Probability of Fragmentation
Let’s assume a cache line size of L bytes is used. Let’s also assume that the
bump-pointer is located X < L bytes past a cache line boundary. Now, when an allocation of B bytes
is requested, fragmentation would be caused if (B modulo L) > L–X. This is shown in Figure
5.6.
Figure 5.6: Probability of fragmentation: Address space used for bump-pointer allocation.
Dotted lines are cache-line boundaries for a line size of L bytes. The bump-pointer is located X bytes past the cache-line boundary, and an allocation of B > L X bytes is requested. The
memory chunk shaded in red is fragmentation; allocation begins at the next cache line boundary.
X
Bump Pointer 3L
2L L
0
B
The probability that fragmentation will occur when an allocation request of size B is
initiated is given by Pfrag.
Pfrag =
[Prob(occurrence of a particular B & X) Prob(B modulo L > L–X)]Prob(B modulo L > L–X) = ( (B modulo L) –1 ) / L
For example, let L = 64 bytes and B = 70 bytes. There are 64 possible values of X, of which 5
values will cause fragmentation: X = 63, 62, 61, 60, 59 ( (B modulo L) –1 ) = 5. (These are
the values of X that would cause the object of size B to span 3 lines instead of the minimum
number of 2 lines.)
From Figure 5.4 and 5.5, it can be seen that for most benchmarks object allocations of
sizes more than cache line size (64 bytes) is very less. For B < L, Pfrag is directly proportional
to B (allocation size) and inversely proportional to L (cache line size). In other words,
fragmentation would diminish if occurrences of smaller Bs (object sizes) are more probable.
Performance improves because of boundary allocation if fragmentation is lower.
Fragmentation should also decrease with increase in cache line size L. Hence according to
the hypothesis, performance of benchmarks would improve further if bigger cache lines are
Chapter 6
CONCLUSION
The cache-line boundary allocation strategy improves the cache miss rate and hence
the overall performance of Java applications. Objects are allocated so that the minimum
number of cache lines is used per object. Hence most of the times with this strategy
minimum number of cache lines would be brought in to the cache when an object is
referenced. This improves the over all utilization of a cache line between the time it is
brought in to the cache and evicted out. Better utilization of a cache line would result in
improved cache performance. Performance was measured for range of Java benchmarks
including Java Grande, Dacapo suite, Spec JBB2000, soot and Spec JVM98.
This strategy was first studied with a generational reference counting collector. The
boundary-allocation scheme was implemented only for the nursery. Results showed only
marginal improvement or deterioration in wall clock time with this strategy. Consistent
improvement is not seen because of the poor survival rate: most objects allocated in the
nursery die very young. Experiments show that on an average, only 15% objects survive
nursery collections for a heap size of 244MB. Thus 85% of nursery address space is dead
objects, which are interspersed with 15% live objects. The overhead of aligning these 85%
short-lived objects shows up as performance deterioration. Performance improvement would
depend on the number of times a cache line (of an object that is boundary aligned) is
Nursery collections happen when the nursery address space is full. The collection
cycle promotes all the live objects to the old generation. Thus objects allocated towards the
end of the nursery address space do not have enough time to be re-referenced. They get
promoted to the old generation prematurely.
The boundary allocation was then implemented for a generational copy collector. The
strategy was implemented only for the old generation. This strategy improved performance
of most of the memory-intensive applications. Execution time improved by around 4% on
average, and cache miss rate improved by around 10% on average. Survival rate for
old-generation objects is much higher than nursery objects. Execution time improvement for
benchmarks was as high as 8% (soot), while some benchmarks, such as SpecJBB, show
marginal performance deterioration.
Object-size distribution was plotted for old-generation objects to study the reasons for
performance degradation. It was found that benchmarks performed well if a majority of their
objects were less than half the size of a cache line. Benchmarks like Spec JBB that showed
performance deterioration had more than 65% of their allocations of size more than half a
cache line. It was shown in section 5.3 that for boundary allocation, fragmentation would
increase with increase in object allocation size. More fragmentation would cause degradation
in cache performance.
Section 5.3 also shows that fragmentation would diminish (and hence performance
would improve) with an increase in cache line size. Cache line sizes have increased in the
past and are expected to increase in the future. Hence boundary allocation would become
allocation on symmetric multi-processor (SMP) systems. This strategy is expected to reduce
conflict misses when used for a multi-threaded workload on a SMP system. It would also be
interesting to study the impact of boundary allocation on hyper-threaded architectures. In a
hyper-threaded architecture threads that are scheduled on the same core also share the
on-chip cache. Number of cache line evictions would increase with increase in number of
threads. Hence boundary allocation is expected to perform better since it aims at reducing the
number of cache lines occupied by an object.
It would also be useful to study boundary allocation strategy in combination with
other works like cache conscious data placement by Chilimbi [7]. This work records the
access patterns of objects during mutator time. This information is then used to sort objects
LIST OF REFERENCES
[1] Jones, Richard and Lins, Rafael. 1996. Garbage Collection: Algorithms for automatic
dynamic memory management. John Wiley & Sons, ISBN: 0471941484, 1996.
[2] Jikes Research Virtual Machine version 2.4.1 http://jikesrvm.sourceforge.net/
[3] Ungar, D. 1984. Generation Scavenging: A non-disruptive high performance storage
reclamation algorithm. In Proceedings of the First ACM SIGSOFT/SIGPLAN Software
Engineering Symposium on Practical Software Development Environments SDE 1. ACM Press, New York, NY, 157-167
[4] Kim, J. and Hsu, Y. 2000. Memory system behavior of Java programs: methodology
and analysis. In Proceedings of the 2000 ACM SIGMETRICS international Conference
on Measurement and Modeling of Computer Systems (Santa Clara, California, United States, June 18 - 21, 2000). SIGMETRICS '00. ACM Press, New York, NY, 264-274.
[5] Wilson, P. R., Lam, M. S. and Moher, T. G. 1992. Caching Considerations for
Generational Garbage Collection. In the 1992 ACM Conference on Lisp and Functional
Programming (San Francisco, Calif.). ACM, New York, 32-42.
[6] Peng, C. J. and Sohi, G. S. 1989. Cache memory design considerations to support
languages with dynamic heap allocation. Tech. Rep. 860, Computer Sciences Dept., Univ. of
Wisconsin- Madison, Madison, Wise. July
[7] Chilimbi, T. M. and Larus, J. R. 1998. Using generational garbage collection to
implement cache-conscious data placement. In Proceedings of the 1st international
Symposium on Memory Management (Vancouver, British Columbia, Canada, October 17 -19, 1998). ISMM '98. ACM Press, New York, NY, 37-48.
[8] Diwan, A., Tarditi, D., and Moss, E. 1995. Memory system performance of programs
with intensive heap allocation. ACM Trans. Comput. Syst. 13, 3 (Aug. 1995), 244-273.
[9] Zorn, B. 1991. The effect of garbage collection on cache performance. Tech. Rep.
CU-CS-528-91, Univ. of Colorado at Boulder, Boulder, Colo. May.
[10] Hirzel, M. 2007. Data Layouts for Object-oriented Programs. Research Rep. RC24218,
Computer Science, IBM Research division.
[11] Blackburn, S. M., Cheng, P., and McKinley, K. S. 2004. Oil and Water? High
Performance Garbage Collection in Java with MMTk. In Proceedings of the 26th
[12] Java Grande Forum Benchmark Suite version 1.0.
http://www.epcc.ed.ac.uk/research/activities/java-grande/
[13] DaCapo benchmark version dacapo-2006-10-MR2. http://dacapobench.org/
[14] Spec JBB2000 benchmark suite. http://www.spec.org/jbb2000/
[15] Spec JVM98 benchmark suite. http://www.spec.org/osg/jvm98/
[16] Intel VTune Performance Analyzer for Linux. Version 9.0.
http://www.intel.com/cd/software/products/asmo-na/eng/vtune/239145.htm
[17] Reinhold, M. B. 1994. Cache performance of garbage-collected programs. In
Proceedings of the ACM SIGPLAN 1994 Conference on Programming Language Design and Implementation (Orlando, Florida, United States, June 20 - 24, 1994). PLDI '94. ACM Press, New York, NY, 206-217.
[18] Soot: A Java Optimization Framework. Version 2.2.4.

![Table 4.3: Java Grande benchmark description [12]BenchmarkDescription](https://thumb-us.123doks.com/thumbv2/123dok_us/1255993.1158212/27.612.84.546.77.330/table-java-grande-benchmark-description-benchmarkdescription.webp)