ABSTRACT
HELAL, AMR AWAD MOHAMED TAHA ALMANSY. Analysis of Earth Embankment Structures using Performance-based Probabilistic Approach including the Development of Artificial Neural Network Tool. (Under the direction of Dr. Mohammed A. Gabr and Dr. Roy H. Borden).
Earth embankment structures such as dams and levees are essential in our nation’s
infrastructure; being used for flood protection, water storage and hydropower generation.
Frequent storms showed the deteriorating condition of dams and levees and urgent the need
for a better condition assessment and stability evaluation. Past dams and levees failures have
proved that the use of factor of safety approach is not an effective indicator of these structures’
performance given the uncertainties in design input parameters (soil properties, loading
history, etc.). An evaluation of the existing FEMA risk prioritization tool was performed along
with sensitivity analysis. Numerical analysis of the Howard A. Hanson dam using PLAXIS 2D
is preformed and its results within the context of limit states and FEMA risk tool is presented
and discussed. A contour approach is proposed for risk estimation using various combinations
of probabilities of exceeding limit states for seepage, earthquake and LSIII. A new risk tool is
developed with MATLAB graphical user interface (GUI) to implement the finite element
program PLAXIS 2D results. A total of 363 cases of numerical analysis using the finite
element program PLAXIS 2D are performed varying key parameters including: i) geometry
and properties of embankment ii) cycles of rising and falling water levels simulating the
consecutive storms. MATLAB was used to develop a neural network which showed a training
and prediction regression (R2) of 98%. A parametric study on the effect of geometry, soil
parameters and cycles of loading is performed using a base embankment model. As side slopes
decrease in shear strain at toe from 2.4 to 0.5%. Cohesion of embankment, foundation and
alluvial had a limited effect on the shear strain at toe. The embankment and alluvial
permeability had a slight effect on the shear strain values. Increasing the foundation
permeability from 6.8*10-5 to 1*10-3 cm/s caused an increase in toe shear strain to exceed
LSIII. Increasing cycles of loading from 1 to 6 cycles, increased the shear strain by a factor of
10. Relative importance of the input parameters, indicated that side slopes and foundation
permeability have the most effect on the shear strain at toe. The results of an integrated
remote-sensing program and finite element modeling for a Sherman Island levee section is presented.
Sherman island levee is constructed over peat deposit which experience large land subsidence
and decomposition over time. Remote sensing data were used for the calibration of a numerical
model using the finite element program PLAXIS 2D with mesh updating. Amorphous peat
showed stiffer response and lower compressibility than fibrous peat. The assumption of
amorphous peat led to computed displacements that ranged from 10 to 30% less than those
with the fibrous peat properties, depending on the location within the domain. The analyses
indicated a relatively small mechanistic deformation induced by an “extreme” water level
under transient conditions. A study on the effect of peat different states of decomposition varies
from H1 to H10 on the Von Post scale is performed. Deformed shape and probability of
exceedance for both shear strain and gradient is shown. H1-H3 case reached probability of
exceeding LSI of 1 after 270 days while H4-H7 peat took approximately 10,000 days to reach
© Copyright 2017 Amr Awad Mohamed Taha Almansy Helal
Analysis of Earth Embankment Structures using Performance-based Probabilistic Approach including the Development of Artificial Neural Network Tool
by
Amr Awad Mohamed Taha Almansy Helal
A dissertation submitted to the Graduate Faculty of North Carolina State University
in partial fulfillment of the requirements for the degree of
Doctor of Philosophy
Civil Engineering
Raleigh, North Carolina
2017
APPROVED BY:
_______________________________ _______________________________
Dr. Mohammed A. Gabr Dr. Roy H. Borden
Committee Co-Chair Committee Co-Chair
_______________________________ _______________________________
DEDICATION
To my father, awesome mother and two beautiful siblings.
To my wife and my son “Yousef”
To my dear friends and colleagues
BIOGRAPHY
Amr Awad Mohamed Taha Almansy Helal was born on March 5th, 1986 in Damietta, Egypt.
He got his Bachelor’s degree from the Civil Engineering program in Mansoura University,
Egypt in 2008. Being the top student in his class, his family encouraged him to complete his
graduate studies in the US. He got admitted into the Master’s program into the University of
Alabama in Huntsville in 2011, where he was awarded his Master’s degree in Civil
Engineering in December 2012. Then, he got accepted into the Ph.D. program in North
Carolina State University, one of the top-ranked universities in engineering, in spring 2013.
He will continue to seek further opportunities in teaching and research in the geotechnical field
ACKNOWLEDGMENTS
My thanks and sincere appreciation to my doctoral committee co-chairs, Dr. Mohammed Gabr
and Dr. Roy Borden. Their guidance and support has always been a motivation to complete
this thesis work. I would also like to thank Dr. Shamim Rahman and Dr. Abhinav Gupta for
accepting to be in my doctoral committee. I also want to thank Dr. M. Masud Hasan for his
significant help in developing the risk tool coding used in this research work. My family and
wife also has been a great motivational aspect and gave me support and encouragement to
travel abroad and study in the US. Lastly, I would like to thank all my friends in Raleigh who
has eased the time I spent here with their companionship and encouragement. Thanks, Nafadi,
Moataz, Abdelrahman, Islam, Ahmed, Omar, Yousef, Mahmoud, Hani, Midani, Sayed,
Mostafa, Karim, Hassan, Elbadry and many others more. Thanks Ching-ting, Jungmok,
Hamed, Kayser, Yuilian, Tim, Atefeh, Ahsan, Shahin, Casey, Mona, Jadid, Afshin, Zahra,
Jinung, Ashkan, Arash, and Amin for keeping company in our geotechnical graduate office in
TABLE OF CONTENTS
LIST OF TABLES ... viii
LIST OF FIGURES ... ix
CHAPTER 1. INTRODUCTION ...1
1.1 Research motivation ...1
1.2 Research objectives ...3
1.3 Thesis Organization ...4
CHAPTER 2. LITTERATURE REVIEW ...6
2.1 Limit state design ...6
2.2 Probabilistic approaches (Reliability-based design) ...10
2.3 Three-sigma rule ...15
2.4 Numerical constitutive soil models ...16
2.5 Artificial Neural Networks (ANN) ...19
2.5.1 Artificial Neural Network approach (ANN) ...20
2.5.2 Back-propagation algorithm (Feedforward ANN)...21
2.5.3 Number of hidden layers ...21
2.6 Unsaturated soil hydraulic models ...22
References ...24
CHAPTER 3. EVALUATION OF FEMA RISK TOOL AND ESTIAMTION OF PROBABILITIES OF EXCEEDING LIMIT STATES FOR EMBANKMENT DAMS USING NUMERICAL ANALYSIS ...32
3.1 Abstract ...33
3.2 Introduction ...34
3.3 Limit states and probability approaches ...35
3.4 Earth embankment structures risk estimation ...38
3.5 FEMA risk prioritization tool ...39
3.8 Case study: Howard A. Hanson Dam (HHD) ...44
3.9 FEMA risk tool sensitivity analysis ...45
3.10 PLAXIS 2D numerical analysis ...48
3.11 Modeling phases ...50
3.12 Probability of exceeding limit states ...51
3.13 Summary and conclusions ...55
References ...56
CHAPTER 4. DEVELOPMENT OF RISK ESTIMATOR TOOL FOR EMBANKMENT STRUCTURES (REES) USING COUPLED NUMERICAL-PROBABILISTIC APPROACH AND ARTIFICIAL NEURAL NETWROK ...63
4.1 Abstract ...64
4.2 Introduction ...65
4.3 Artificial Neural Networks ...66
4.4 PLAXIS 2D model description ...67
4.5 Analyses of parameters ...67
4.6 Parameters randomization ...70
4.7 Storm hydrograph and duration ...70
4.8 Number of cases (Samples) ...72
4.9 Probabilities of exceeding limit states calculation ...74
4.10 Parametric study ...75
4.10.1 Effect of upstream and downstream side slopes ...76
4.10.2 Effect of friction angle ...79
4.10.3 Effect of permeability ...81
4.10.4 Effect of cycles of water level rise and drawdown ...84
4.11 ANN model development ...86
4.11.1 Training function ...86
4.11.2 Number of neurons in hidden layer effect ...87
4.11.3 Neural network structure...88
4.12 Relative importance of input parameters ...89
4.13 Risk Estimator for Embankment Structures “REES” tool development ...90
References ...97
CHAPTER 5. EFFECT OF PEAT DECOMPOSTION ON THE PERFORMANCE OF EMBANKMENT LEVEE USING LIMIT STATE PROBABILISTIC APPROACHES AND NUMERICAL ANALYSIS ...100
5.1 Abstract ...101
5.2 Introduction ...102
5.3 Sacramento-San Joaquin delta and Sherman island ...104
5.4 Sherman Island levee site and field instrumentation ...105
5.5 Fibrous and Amorphous peat ...106
5.6 Finite element and domain model ...110
5.7 Peat model: Soft Soil Creep (SSC) ...111
5.8 Modeling phases and calibration ...112
5.9 Model scenarios for long term assessment ...115
5.10 Peat decomposition effect on probability of exceeding limit states ...118
5.11 Probabilities of exceeding limit states ...122
5.12 Summary and conclusions ...127
References ...129
CHAPTER 6. SUMMARY AND CONCLUSIONS ...133
6.1 Regarding evaluation of FEMA risk tool and estimation of probabilities of exceeding limit states for embankment dams using numerical analysis ...133
6.2 Regarding development of risk estimator tool for embankment structures (REES) using coupled numerical-probabilistic approach and artificial neural network ...134
6.3 Regarding effect of peat decomposition on the performance of embankment levee using limit state probabilistic approaches and numerical analysis ...136
6.4 Contributions to the state of the art ...138
6.5 Future work ...139
APPENDIX A. PROPERTIES OF PLAXIS 2D CASES FOR CURRENT STUDY ....142
APPENDIX B. MATLB PARAMERTES RANDOMIZATION EFFECT AND PROBABILITY SHEET CALUCLATION ...152
LIST OF TABLES
Table 2.1. Summary of coefficient of variation (V) for some geotechnical properties ... 14
Table 2.2. Hardening soil model input parameters (PLAXIS 2016) ... 18
Table 3.1. Howard A. Hanson dam soil input parameters ... 49
Table 3.2. Probability of exceeding limit states calculation after 6 storm cycles ... 53
Table 4.1. Soil parameters suggested probability distribution from literature ... 68
Table 4.2a. Embankment soil parameters ranges and statistical parameters ... 69
Table 4.2b. Embankment geometry parameters ranges and statistical parameters ... 69
Table 4.3. Rate of rise, drawdown and storm duration for Hurricane Katrina and Isaac ... 72
Table 4.4. Effect of neural network training function on performance ... 87
Table 4.5. Effect of number of hidden neurons on network performance ... 88
Table 4.6. Deviatoric shear strain and probabilities of exceedance from PLAXIS & REES . 93 Table 5.1. Von Post classification system for peat ... 109
Table 5.2. Compression and strength parameters for fibrous and amorphous peats ... 109
Table 5.3. Soil profile parameters for Sherman Island model ... 114
Table 5.4. Fibrous and amorphous peat parameters used for finite element modeling ... 115
Table 5.5. Peat parameters with different state of decomposition used for PLAXIS 2D ... 119
LIST OF FIGURES
Figure 2.1. Load and resistance factor design (LRFD) with probability of failure (Becker,
1996) ... 10
Figure 2.2. Three-sigma rule representation for a normal distribution (US Army Corps of Engineers ETL 1110-2-561, 2006) ... 15
Figure 2.3. Typical arrangement of an artificial neuron (JongKoo Jeon, 2007) ... 21
Figure 2.4. Typical multilayer feedforward neural networks (JongKoo Jeon, 2007) ... 22
Figure 2.5. General soil water characteristic curve (SWCC) (Zhai, 2012) ... 24
Figure 3.1. FEMA risk tool failure modes estimation table (FEMA risk tool) ... 42
Figure 3.2. FEMA risk tool risk plot using Loss of life and annual probability of failure (FEMA risk tool)... 43
Figure 3.3. Loss of life risk for combinations of seepage and LSIII probabilities (Overtopping probability of failure = 1*10-1, Earthquake probability of failure = 1*10-6) .... 47
Figure 3.4. Loss of life risk for combinations of seepage and LSIII probabilities (Overtopping probability of failure = 1*10-2, Earthquake probability of failure = 1*10-6) .... 47
Figure 3.5. Loss of life risk values for combinations of seepage and LSIII probabilities (Overtopping probability of failure ≤ 1*10-3, Earthquake probability of failure = 1*10-6) .... 48
Figure 3.6. Howard A. Hanson dam model and mesh in PLAXIS 2D ... 49
Figure 3.7. Howard A. Hanson dam water level at different model phases ... 51
Figure 3.8. a) Effect of storm cycles on probability of exceeding limit states for Howard A. Hanson dam b) deviatoric shear strain at toe with storm cycles ... 54
Figure 4.1. Typical arrangement of an artificial neuron (JongKoo Jeon, 2007) ... 67
Figure 4.2. PLAXIS 2D base model with variable parameters... 68
Figure 4.3a. Hurricane Katrina (2005) hydrograph at various locations in New Orleans (Bunya et al. 2010) ... 71
Figure 4.3b. Hurricane Isaac (2012) hydrograph at various locations in State of Louisiana (Dietrich et al. 2012) ... 71
Figure 4.4. PLAXIS 2D study cases combinations... 73
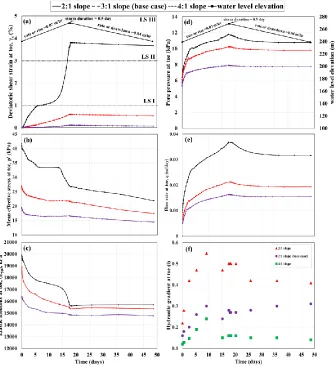
Figure 4.6. Effect of side slopes on a) deviatoric shear strain b) mean effective stress c)
Elastic modulus d) pore pressure e) flow and f) hydraulic gradient at toe location ... 76
Figure 4.7. Phreatic level for a) 1:2 b) 1:3 and c) 1:4 slope at 15 days ... 78
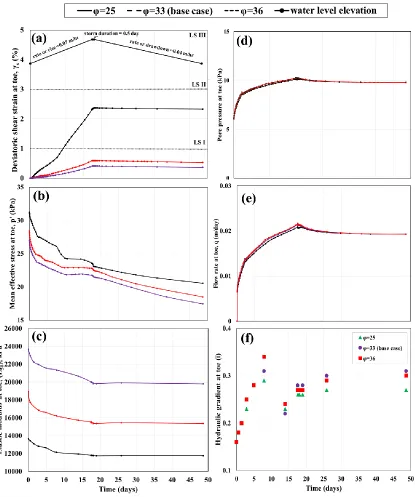
Figure 4.8. Effect of embankment friction angle on a) deviatoric shear strain b) mean effective stress c) Elastic modulus d) pore pressure e) flow and f) hydraulic gradient at toe location ... 80
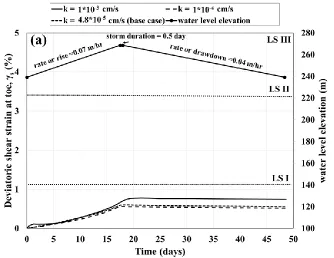
Figure 4.9a. Effect embankment permeability on the deviatoric shear strain at toe location . 81 Figure 4.9b. Effect of alluvial permeability on the deviatoric shear strain at toe location ... 82
Figure 4.10. Effect of foundation permeability on a) deviatoric shear strain b) mean effective stress c) Elastic modulus d) pore pressure e) flow and f) hydraulic gradient at toe location . 83 Figure 4.11. Effect of cycles of loading on deviatoric shear strain at toe location ... 85
Figure 4.12. Shear strain bands in embankment with cycles of loading... 85
Figure 4.13. Neural network structure ... 88
Figure 4.14. ANN regression plots for (a) training (b) validation and (c) testing data set ... 91
Figure 4.15. Testing and validation data for REES tool versus PLAXIS 2D ... 93
Figure 4.16. Probability of exceeding limit state for REES tool versus PLAXIS 2D ... 94
Figure 5.1.a. One of three stand-alone GPS stations installed in Sherman Island setback levee. b. Model of Sherman Island proposed by Jafari et al. (2016). ... 108
Figure 5.2. Finite element PLAXIS 2D levee mesh and boundary conditions ... 111
Figure 5.3. Displacement with time for fibrous peat versus measured data ... 115
Figure 5.4. Vertical displacement with time for fibrous and amorphous peat ... 117
Figure 5.5. Deviatoric strain (γs) with time and limit state criteria for mean value of Cα/Cc=0.06. ... 117
Figure 5.6. Vertical displacement for peat with different degree of decomposition ... 121
Figure 5.7. Deviatoric shear strain at toe for peat with different degree of decomposition (H1-H3, H4-H7 and H8-H10) ... 121
Figure 5.8. Deformation of levee for a) H1-H3 peat b) H4-H7 peat c) H8-H10 peat at 10,000 days ... 122
Figure 5.10. Hydraulic gradient at toe location for peat with different degree of
decomposition ... 126
Figure B.1. Friction angle statistical differences based on ANOVA analysis ... 153
CHAPTER 1. INTRODUCTION
1.1 Research motivation
Earth embankment structures such as levees and dams play an important role during
extreme flooding events as well as during normal operating conditions. In addition to providing
flood protection, these structures serve as a key-part of our critical civil infrastructure as they
are also used for water storage and hydropower generation. According to the Association of
State Dam Safety Officials, approximately one third of the “high hazard” earth dams are
considered deficient in some aspects of their integrity and many are older than 50 years. ASCE
reported that the 5 year funds needed for rehabilitation and upgrade of these structures is on
the order of $12.5 billion but what is allocated nationwide is only $5.05 billion. Therefore,
there is a clear need for accurate evaluation of stability and functionality level of these types
of structures for condition assessment as well as cost effective specification and
implementation of the remedial actions. Given the short fall of $7.45 billion in rehabilitation
funds, the development of better condition assessment and efficient specification of
rehabilitation approaches will have a positive impact on the welfare and safety of the
communities served by these types of structures, and contribute to our nation’s security and
economic wellbeing.
The experience of past levee failures during storms like hurricane Katrina (Daniel, 2014)
has proved that the use of the state of practice “factor of safety” approach is not an effective
indicator of the safety level or expected performance of earth structures given uncertainties in
an approach based on the definition of limit states (Khalilzad and Gabr, 2011) has been
implemented to assess the condition of protective earth structures and specify the probabilities
of exceeding a predefined limit state and its associated risk value. The emerging need for
evaluation of stability and functionality levels of earth structures rises from the frequent
failures and the limited fund available for rehabilitation.
The integrity and reliability of levees are essential components of homeland safety. The
failure of such systems due to a natural or manmade hazard can have monumental
repercussions, sometimes with dramatic consequences on human life, property and the
country’s economy. There is lack of models in the literature that simulates effect of peat
aging/decomposition over time from a probabilistic limit states prospective. The concept of
performance limit states of these critical structures provides a means to quantitatively assess
the functionality of an earth structure under severe storm loading events. The probability of
exceeding a prescribed limit state is defined based on the strain or hydraulic gradient levels in
potential emerging failure zones.
Innovative approaches that uses probabilistic and reliability analysis should become
familiar inside the practical geotechnical community to allow decision-makers in allocating
expenditure for such structure’s rehabilitation. Also, tools for estimating risk that can facilitate
engineering decisions should be developed. The research here on aims at applying coupled
numerical probabilistic approaches to estimate probabilities of failure for earth embankment
structures and develop simple tools to aid in the decision-making process. Also, study on the
effect of peat decomposition on the performance of embankment levee in terms of strain or
1.2 Research objectives
The objectives of work in this study is to use coupled numerical probabilistic approaches
to estimate functionality for embankment structures using probabilities of exceeding limit
states and loss of life risk
• Investigation of the validity of using available risk tools (FEMA risk tool) to estimate
associated risk for embankment structures and study of Howard A. Hanson dam as a
case study using numerical analysis and probability approach.
• Implementation of the limit states concept developed by Khalilzad (2011) to estimate
probabilities of exceeding a predefined limit state and its associated risk for
embankment structures.
• Perform a parametric study on earth embankment structures using finite element
program (PLAXIS 2D) and the effect of changing side slopes, soil friction angle,
cohesion, permeability and cycles of loading on probabilities of exceeding a
predefined limit state.
• Development of risk tool for dams and levees “REES: Risk Estimator for
Embankment Structures”, using Artificial Neural Network (ANN) approach and
MATLAB coding for the prediction of risk for various combinations of loads, dam
geometry and cyclic loading.
• Application of the implemented approach using field measurements by analyzing
Sherman Island levees system in California in support of the DHS effort to estimate
in the Sacramento San Joaquim Delta. The effect of peat decomposition/aging is
investigated within the probabilities of limit state approach.
1.3 Thesis organization
This thesis was organized in a paper format having introduction and literature review
chapters along with chapters discussing the research work and summary and conclusions.
Chapter 1: Introduction
This chapter represents research motivation, research objectives and thesis organization.
Chapter 2: Literature review
Literature review about limit states, probabilistic approach, Three-Sigma rule, Artificial
Neural Networks (ANN), Numerical constitutive soil models and unsaturated soil hydraulic
models.
Chapter 3: Evaluation of FEMA risk tool and estimation of probabilities of exceeding limits
states for embankment dams using numerical analysis
This chapter discusses and evaluates the FEMA risk tool with an implementation for Howard
A. Hanson dam using numerical analysis and probabilistic approach.
Chapter 4: Development of risk estimator tool for embankment structures (REES) using
coupled numerical-probabilistic approaches and artificial neural network.
This chapter introduces the Artificial Neural Networks approach (ANN) and its incorporation
into a GUI interface in developing the risk tool that eliminates the need for extensive finite
element analysis to predict the probability of exceeding limit states. It also presents a
Chapter 5: Effect of peat decomposition on the performance of embankment levee using limit
state probabilistic approaches and numerical analysis
This chapter represents a study on the effect of peat decomposition on the deformation
response of the Sacramento delta levee system. A numerical model is calibrated using PLAXIS
2D and in-situ field measurements.
Chapter 6: Summary and conclusions
This chapter summarize research work performed and its conclusion, contribution to the state
of art.
Appendix A: Properties of PLAXIS 2D cases for current study
This appendix contains properties for PLAXIS 2D cases that was used to develop the ANN
tool.
Appendix B. MATLAB parameters randomization effect and probability sheet calculation
This appendix contains ANOVA analysis details conducted in MATLAB along with
probability sheet calculation procedure.
Appendix C. MATLAB code and REES tool
This appendix contains the MATLAB code for REES tool and ANN along with an
CHAPTER 2. LITTERATURE REVIEW
2.1 Limit state design
Limit state design problems in geotechnical engineering design have been historically
divided into two main groups of problems, stability and elasticity problems, in other words,
ultimate and serviceability limit states (Meyerhof, 1995; Terzaghi, 1943). Meyerhof (1995),
mentioned that stability or ultimate state problems deals with conditions just before failure
happens by plastic flow without any consideration of strain effects. Serviceability limit state
problems only consider deformations of soil due to soil-structure interaction and doesn’t
account for the stress conditions for failure. Generally, limit states are conditions where a
structure no longer performs its designed function. Whenever a structure doesn’t satisfy any of
its performance standards, it can be said it reached a limit state (Becker, 1996).
Several studies used factor of safety approach (FS) by applying it to ultimate resistance to
account for the ultimate state for earthwork’s design (i.e. earth retaining structures, foundation,
embankment structures and other construction problems). Factor of safety approach in stability
estimates was first introduced in the 18th century (Belidor, 1792; Coulomb, 1773). Factor of
safety represents a ratio between the ultimate resistance of the earth structure or foundation to
the applied load. Terzaghi and Peck (1948) gave ranges for total factors of safety for
geotechnical structures with upper and lower ranges from 1.2 up to 3 based on the structure
type and the failure mode. Various researchers suggested factors of safety for settlement
analysis (Terzaghi, 1943; Terzaghi and Peck, 1948; Meyerhof, 1953; Skempton and
(1953) to estimate partial factors of safety on different types of loads, soil shear strength
parameters and pile capacities. In European codes, limit state design is based on partial factors
approach for both load and strength parameters of soils, while in North America codes, it favors
load and resistance factors which is referred to as load-resistance factor design approach
(LRFD) (Meyerhof, 1995). LRFD approach has the advantage of incorporating the variabilities
in soil properties, site investigation methods, as-built dimensions, failure mode uncertainties
and analysis method. These types of analysis also stand for serviceability limit states to
estimate deformations of geotechnical structures. Uncertainties in the soil strength parameters
(i.e. cohesion and friction angle) and the soil profile geometry give a great unreliability in the
stability of structures and suggests that traditional factor of safety design doesn’t provide a
good indication of the performance and stability of structures.
The main concern raised when first LSD was first presented during the 1970’s, was that it
would be too complicated for practitioners. Although Allen (1994) stated that LSD can be as
simple or as complicated as required “to do the job”. Although many researches has published
paper in the limit state topic such as Meyerhof (1970, 1982, 1984, 1993, and 1995), Ovesen
(1981, 1993), Oveson and Orr (1991) and an international symposium on limit state design
was held in Copenhagen, Denmark in 1993, which included more than 68 papers and
discussion on limit state design.
Although the application of the limit state design (LSD) has increased over the last two
decades. It has not been widely used in the dam safety evaluation (Farinha et. al, 2015). More
committees are aware of the shortcomings of the overall factory of safety approach and moving
(ICOLD, 1988, 1993) as traditional factor of safety design doesn’t provide a good indication
of the performance and stability of earth structures (Duncan, 1991; USACE, 2006).
Nian et.al (2008) used limit state and limit analysis to analyze the stability of reinforced
slopes with piles in anisotropic and nonhomogeneous soils. Konstantakos (2010) discussed
ultimate limit state method (ULS) advantages and limitations for braced excavations design.
He stated that in Europe codes, in contrast with US, geotechnical engineers uses ULS design
to estimate a factor of safety to be greater than one for all structures. A reduction factors is
applied for soil strength parameters. On the other hand, US engineers uses a serviceability
approach where soil parameters is estimated and then analysis is preformed to obtain service
displacement, moments and forces. Design forces is then estimated by applying a factor of
safety on the service results and factor of safety between 1.2 and 1.5 is applied to estimate wall
embedment. Farinha et al. (2015) applied the limit state design (LSD) approach to the
foundation of a concrete gravity dam with the joint application of the concepts of ultimate limit
states and numerical methods. The authors adopted a criteria to determine the characteristic
values of the soil properties. In their paper, they concluded that the LSD method can be used
for dam foundation design with the partial factor values described in Eurocode 7. Limit state
design has also been used to design cast-in-place piles, drilled shafts and sheet piles (Zaretskii
et al., 1985; Misra and Roberts, 2009; Krabbenhoft et al., 2005).
Given the shortage ability of the traditional factor of safety approach to present the stability
and the functionality of earth structures and the continuous research towards using probabilistic
approaches along with limit states, This study will implement an approach proposed by
based limit state analysis for embankment dams. The approach was implemented into simple
probabilistic analysis using approach by Duncan (2000). The authors defined limit state values
by the horizontal deformation values at the toe location that can indicate the stability of the
embankment. Then the shear strain values is correlated to the horizontal deformation on the
failure surface. They used a qualitative definition for the limit states (LS) and divided as
follows:
1) LS(I): minor deformations, no discernible shear zones, low gradients (i.e. i < 1)
throughout the embankment dam and foundation,
2) LS(II): medium (repairable) deformations, limited piping problems (i.e. i > 0.67 within
a shallow depth at the location of toe), dispersed plastic zones with moderate strain
values, tolerable gradients less than critical,
3) LS(III): major deformations, breaches and critical gradients at key locations (i.e.
boiling and fine material washing at the location of toe), high strain plastic zones and
emerging shear bands
Although it seems from literature that the limit state design approach has been
well-established, there is research gaps on how to quantify the limit state upper and lower bounds
due to lack of sufficient data to estimate failure, also due to the uncertainties presented in the
strength parameters and load conditions for structures. Limit states approaches have to be
incorporated with probabilistic and statistical methods to be able to estimate probabilities of
2.2 Probabilistic approaches (Reliability-based design)
Recently, the interest has increased to the use of probability theory and reliability concepts
to model uncertainties in earth embankments design. Geotechnical engineering is a field that
contains lots of uncertain parameters in the soil strength parameters. In reliability-based design,
parameters are treated as random variables with a probability density function or frequency
distribution. This gives the perspective of including the variability of these functions and
concluding a more representative safety measure as a probability of failure value (Harr, 1987;
Christian et al., 1994; Khalilzad et al., 2015). Probability of failure in LRFD design can be
defined as the shaded overlap area between resistance and load curves as in Figure 2.1.
Figure 2.1. Load and resistance factor design (LRFD) with probability of failure (Becker, 1996)
Reliability-based design unlike the factor of safety design approach (which sometimes is
based on engineering experience and judgment), takes into account the uncertainties associated
(Becker, 1996). The reliability methods use reliability index (β) as an indicator of the
probability of failure or measure of safety. In many design codes, the reliability index values
β ranges between 2.5 and 4 which corresponds to a probability of failure from about 1x10⁻² to
1x10⁻⁵ (MacGregor, 1976; Allen, 1975). AAHSTO and OHBDC bridge codes use a target
reliability index value of β = 3.5 and it is also used for code calibration for the foundations in
the NBCC.
The main disadvantages in using reliability-based design are the requirement of sufficient
and proper information about the probability distribution of the parameters which is seldom
available. Probabilistic design approaches can be divided into three main categories: i) A fully
probabilistic method in which the actual distribution is known or measured and this could be
time-consuming and expensive to determine, so it is only recommended to be done in large
special projects, ii) Approximate probability method that doesn’t require knowing the actual
probability distribution and it can be assumed. Typically, normal and log-normal distributions
are assumed for soil properties (Becker, 1996). Lumb (1966) concluded that the variations in
properties of four natural soils follow normal distribution and it can be safe to use normal
distribution for properties that follows log-normal and bi-normal distributions. This can be
defined by the second moment probabilistic method which uses two moments of mean and
coefficient of variation, iii) The third level is the semi-probabilistic method which used
separate load and resistance factors and this one by far the most simple and convenient method
to apply. The LRFD is an example of this third category level. The main challenge in applying
the reliability method is how to select an appropriate probability distribution for the parameters
The probability distribution depends greatly on the mean, standard deviation or the
coefficient of variation values. Many researchers have summarized the coefficients of variation
for several geotechnical properties and in-situ test (Harr, 1984; Kulhawy, 1992; Lacasse and
Nadim, 1997; Meyerhof, 1993, 1995 and Duncan, 2000). Table 2.1 summarizes the values for
the coefficient of variation found in the literature. It must be noted while these values in the
Table represent a large amount of test data, it covers extremely wide ranges of values for the
same parameter and the conditions of sampling and testing are not specified. These values in
Table 2.1 only provide guidance but engineering sense must be used when choosing the
coefficient of variation value. Once the coefficient is assumed properly, the standard deviation
can be estimated and the probability distribution is available in order to use in the probability
of failure calculations. Duncan (2000) in his paper “Factors of safety and reliability in
geotechnical engineering” uses Taylor series method to determine the probability of failure
using the estimation of standard deviations values which he proposed to get using either
available sufficient data or published values for coefficient of variations, or using the Three –
Sigma rule which is used within this research.
In recent years, many studies have been done to explore possibility of risk in dam safety.
Von Thun (1987) studied risk methodology with U.S. Bureau of Reclamation in order to
estimate dam risk and risk expense. Two conferences were held (McCann, 1985; Haimes and
Stakhiv, 1986; Moser and Stakhiv, 1987) where dam safety is discussed. When the safety of a
dam is evaluated, the risk analysis is applied to estimate failure probability related to rare
precipitation could be derived and applied to two watersheds in Iowa. Langseth and Perkins
(1983) proposed a procedure for dam safety analysis.
Moreover, numerous studies have attempted to evaluate the safety of dams (Bowles, 1987;
McCann et al., 1985; Von Thun, 1987; Resendiz-Carrill and Lave, 1987; Karlsson and Haimes,
1988a, 1988b; Haimes et al., 1988; Karlsson and Haimes, 1989; Petrakian et al., 1989). Wood
(1977) in his paper “An Analysis of Flood Levee Reliability” evaluated the overtopping risk
for levee by applying the integral transformation approach. Karlsson and Haimes (1988) in their paper “Risk-Based Analysis of Extreme Events” discussed how mathematical expectation
has traditionally been used in solving risk-based problems and that it is no appropriate for
decision making that affecting public policy because it conceals extremes by combining events
of different magnitudes and probabilities of occurrence. Goodarzi et al. (2012) presented risk
and uncertainty analysis to dam overtopping based on univariate and bivariate flood frequency
by applying Gumbel logistic distribution. This shows the growing use of probabilistic
approaches and risk towards estimating earth structures adequate functionality and risk under
various failure modes such as piping, seepage, earthquake, overtopping and global stability
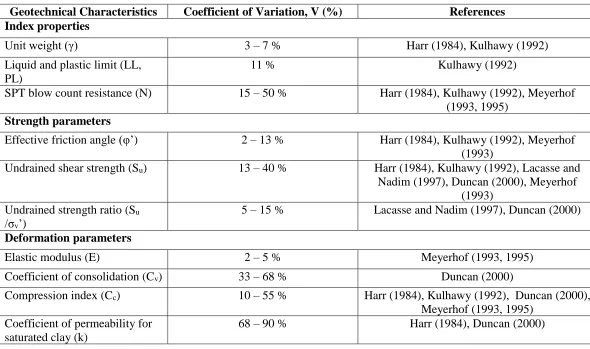
Table 2.1. Summary of coefficient of variation (V) for some geotechnical properties
Geotechnical Characteristics Coefficient of Variation, V (%) References Index properties
Unit weight (γ) 3 – 7 % Harr (1984), Kulhawy (1992)
Liquid and plastic limit (LL, PL)
11 % Kulhawy (1992)
SPT blow count resistance (N) 15 – 50 % Harr (1984), Kulhawy (1992), Meyerhof
(1993, 1995)
Strength parameters
Effective friction angle (φ’) 2 – 13 % Harr (1984), Kulhawy (1992), Meyerhof
(1993)
Undrained shear strength (Su) 13 – 40 % Harr (1984), Kulhawy (1992), Lacasse and
Nadim (1997), Duncan (2000), Meyerhof (1993)
Undrained strength ratio (Su
/σv’)
5 – 15 % Lacasse and Nadim (1997), Duncan (2000)
Deformation parameters
Elastic modulus (E) 2 – 5 % Meyerhof (1993, 1995)
Coefficient of consolidation (Cv) 33 – 68 % Duncan (2000)
Compression index (Cc) 10 – 55 % Harr (1984), Kulhawy (1992), Duncan (2000),
Meyerhof (1993, 1995) Coefficient of permeability for
saturated clay (k)
2.3 Three-sigma rule
Estimation of standard deviation of soil parameters is a challenging task and requires
enough data. Although, there are methods that can be used to estimate standard deviations if
no enough data is present. Duncan (2000) proposed three methods that can be used to estimate
standard deviation: i) If sufficient data is available, one can use the formal definition equation
of standard deviation. ii) Published values for coefficient of variation which is available in
number of published work at shown in Table 2.1. iii) The three-sigma rule. Dai and Wang
(1992) described that we can use the fact that 99.73% of all values of a normally distributed
parameter always fall within three standard deviations of the average. Three-sigma rule is
shown in Figure 2.2.
Therefore, if HCV = highest conceivable value of the parameter, and LCV = lowest
conceivable value of the parameter, these are approximately three standard deviations above
and below the average value. The Three-Sigma rule can be used to estimate a value of standard
deviation by first estimating the highest and the lowest conceivable values of the parameter
and then dividing the difference between them by six:
𝜎 = 𝐻𝐶𝑉 − 𝐿𝐶𝑉 6
When limited data are obtainable or not data are available, then the three-sigma rule can
be applied. Some research papers call it “Six sigma rule”.
2.4 Numerical constitutive soil models
Due to the high expenses of soil testing, stress-strain curves input data is very limited
(Schanz et al., 1999). Use of numerically developed soil models to simulate soil behavior is
of a tremendous help in understanding complex problems in geotechnical engineering where
no or limited data is available. Various constitutive models can be used to simulate soil
behavior; some assumes linear stress-strain relationships (i.e. linear Elastic, linear elastic
perfectly-plastic) such as Mohr-Coulomb model. Other models incorporate nonlinear
behavior as the isotropic hardening model or hardening soil model. These models use basic
soil strength parameters and results from lab test to simulate the non-linear soil behavior.
Although all the existing efforts to develop numerical models to simulate soil behavior,
extensive care should be taken when choosing the appropriate soil model for a specific
The linear elastic perfectly-plastic model (Mohr-Coulomb) has some limitation and only
to use for first analysis of the problems. Although it takes in account stiffness increase with
depth, it doesn’t include either stress-dependency or stress-path dependency of stiffness or
anisotropic stiffness. Various models have been developed to describe the non-linear behavior
of soil such as Cam-Clay model (Hashiguchi, 1985, 1993), the pseudo-elastic (hypo-elastic)
model, the hyperbolic model (Duncan and Chang, 1970) and the hardening soil model (Schanz
et al., 1999). The hardening soil model is selected in this research to run the analysis for the
embankment as the problem is of a large strain problem and the stiffness parameters change
with pressure and with cycles of water level rising and drawdown. The hardening soil model
supersedes the other nonlinear models by using the theory of plasticity instead of theory of
elasticity, including soil dilatancy and introducing a yield cap. Hardening soil model (HS) is a
more accurate model that takes into account more soil parameters such as triaxial loading
stiffness E50, the triaxial unloading stiffness, Eur and the Oedometer loading stiffness, Eoed.
PLAXIS assumes default values as an average value for various soil types, Eur ~ 3E50 and Eoed
~ E50. Also, the HS model accounts for the stress-dependency of stiffness moduli (i.e. all
stiffnesses increases with pressure). The HS model simulates both soft and stiff soils. In
comparison to the Mohr-Coulomb model, the yield surface of the HS model is not fixed in the
principal stress space and can expand due to plastic strain. The stiffness of the soil decreases
under deviatoric stress, resulting in irrecoverable plastic strain. In a drained triaxial test,
hardening soil model can be approximated with a hyperbola similar to the hyperbolic model
by Kondner (1963) and Duncan and Chang (1970), but different in that it utilizes the theory of
yield cap. More details the formulation and equations of the hardening soil model are presented
in PLAXIS material models manual. Hardening soil model is used in this thesis to simulate the
nonlinear soil behavior and the input parameters are presented in Table 2.2.
Table 2.2. Hardening soil model input parameters (PLAXIS 2016)
Parameter Definition Units
𝑬𝟓𝟎𝒓𝒆𝒇 Secant stiffness in standard drained triaxial test kN/m2
𝑬𝒐𝒆𝒅𝒓𝒆𝒇 Tangent stiffness in for primary oedemter loading kN/m2
𝑬𝒖𝒓𝒓𝒆𝒇 Unloading/ reloading stiffness (default 𝐸𝑢𝑟𝑟𝑒𝑓= 𝐸50𝑟𝑒𝑓) kN/m2
m power for stress-level dependency of stiffness ----
C’ Effective cohesion kN/m2
φ’ (phi) Effective angle of internal friction (o)
Ψ (psi) Angle of dilatancy (o)
νur Poisson’s ration for unloading-reloading (default=0.2) ----
pref Reference stress for stiffnesses (default pref = 100 kN/m2) kN/m2
Zain et al. (2011) in their paper modeled the lateral movement in soft clay due to excavation
using finite element PLAXIS program with two soil models, Mohr-Coloumb and Hardening
soil model. For simulation in PLAXIS, they created a geometry model which consists of sand
and clay layer and a vertical sheet pile as driven downwards until bottom of the soil layer. The
authors mentioned that the failure was resulted due to excavations done in stages on one side
of the soil to the sheet pile. The results they obtained concluded that Mohr-Coulomb model are
nearly equal to Hardening-Soil model if comparing horizontal displacements. However, for the
soil stresses, the researcher found that the percentage differences between the both models are
higher which is caused by characteristic of Hardening-Soil model that accounted for stress
dependency of stiffness moduli, where all stiffness increase with pressure. They mentioned
parameters which are E50, Eur and Eoed while Mohr-Coloumb model only consider for E value
which is limited number of features that soil behavior show. For MC-model, Hooke’s single
stiffness model with linear elasticity in combination with an ideal plasticity, whereas the
HS-model use double stiffness HS-model for elasticity in combination with isotropic strain.
2.5 Artificial Neural Networks (ANN)
Artificial neural networks as its name indicates are soft computational approaches that
try to simulate the decision process of the human brain nerve system. It learns from the
knowledge of the neurons networks and uses that to predict outcomes. It is sometimes referred
to as ANNs. A question may come in mind, why we should use ANNs and view it as more
than a simulation approach although, computationally, any conventional computer can do what
any ANNs can offer. The answer lies in two aspects; ANN allows simple computations to solve
complex problems and can stand for wide range of problems given its self-organizing feature
(Graupe, 2013). Simplicity is the key of ANNs solving algorithm, think of a fly avoiding an
obstacle or a mouse running from a cat. They don’t solve differential equations or complex
computational algorithms, they simply use their neural cells to identify these obstacles and
learn from experience to gain knowledge. Same as when kid observe his parents and learn
from them, then simulate their movements. In short, ANNs is a computational approach
inspired by the human brain neural system that has the ability to learn, recall, generalize and
predict from a training set of data. If enough training data is available, we can use it to train
the network and get a reasonable approximation for outcomes. MATLAB has an artificial
neural network framework that will be used in this research to train an ANN network and then
2.5.1 Artificial Neural Network approach (ANN)
Artificial Neural Network (ANN) approach can offer a simple platform for solving
complex problems and can also learn and predict outcomes using training set of data. Neural
Networks first caught interest after McCulloch and Pitts introduced simplified neurons in 1943.
Usage of Neural networks and fuzzy logic has been missing in the dam safety community
research till the 1980s. From the 1980s, analysis on dam observation data has developed greatly
and new theories have been presented such as Grey Theory, fuzzy mathematics and neural
networks. Liu Guanbiao (Liu, 1989) used fuzzy clustering method to analyze the displacement
of a concrete dam. Other researchers used fuzzy logic and neural networks to predict earth
dam’s deformations (Chen, 2000; Deng, 2007). Artificial neural network has a set of simple
units called neurons which send signals between each other and depends on a number of
weighted connections. Any neural network consists of input units, activation functions,
connection between units, external input (or bias) and learning rule (Rumelhart and
McCleland, 1986). We can distinguish three types of neural network elements: input units
which receive data form outside the neural network, output units which send data out of the
neural network, and hidden units whose input and output signals remain within the neural
network. Figure 2.3 shows a typical arrangement of an artificial neuron. For more details about
activation functions and learning rules, refer to MATLAB neural network tool manual
Figure 2.3. Typical arrangement of an artificial neuron (JongKoo Jeon, 2007)
2.5.2 Back-propagation algorithm (Feedforward ANN)
Literature has showed that a two-layer feed forward network can fit most complicated
problems (Minsky and Papert, 1969). The main idea begins that the errors for the units of the
hidden layers is determined by back-propagating the errors for the output layers, that’s why it
is called back-propagation algorithm. This has been used widely as a learning algorithm in
feedforward neural networks. The algorithm works in two steps: first, propagate inputs forward
to get an actual output. Then, the error (difference between target and output layers) is
propagated backward to previous hidden layers to update their weights. Figure 2.4 shows a
multilayer feedforward neural network.
2.5.3 Number of hidden layers
To design a good neural network model, number of hidden layers is needed as one of
the first concerns. It is currently known that there is no need to have more than two hidden
layers, as there is no improvement in the results with more hidden layers (Kecman, 2001,
Figure 2.4. Typical multilayer feedforward neural networks (JongKoo Jeon, 2007)
2.6 Unsaturated soil hydraulic models
Embankment soil usually have parts that can be considered as unsaturated soil in-which
the matric suction and the capillary action plays a significant role in altering soil stresses. Soil–
water characteristic curve (SWCC) contains the fundamental information required for
describing mechanical behaviors of unsaturated soil. SWCC relates the soil water content or
degree of saturation to matric suction. Various equations were developed to describe SWCC.
Pedroso et al. (2009) and Pedroso and Williams (2010) proposed a model to describe SWCC
and SWCC with hysteresis. Pedroso and Williams (2011) also proposed a genetic algorithm
method to determine the best fitting parameters of the different SWCC models. Some SWCC
variables such as air-entry value, residual water content and residual suction are commonly
used to describe the SWCC characteristics and are associated properties such as shear strength
can also be derived for Van Genuchten’s equation (1980). Figure 2.5 shows a general shape of
the SWCC along with its variables.
Unsaturated hydraulic properties are used for the embankment layer as all or some parts
of the layer are above the phreatic surface at the different stages of modeling simulating rising
reservoir level. The other two layers are saturated during the simulation time. There are several
models that describe the hydraulic behavior of unsaturated soils. PLAXIS incorporates two
hydraulic models for unsaturated soils, Van Genuchten and the approximate Van Genuchten
model. Van Genuchten is a three-parameter function that relates saturation to the suction pore
pressure head ∅𝑝 as follows:
𝑆(∅𝑝) = 𝑆𝑟𝑒𝑠𝑖𝑑𝑢+ (𝑆𝑠𝑎𝑡− 𝑆𝑟𝑒𝑠𝑖𝑑𝑢) [1 + (𝑔𝑎 ∅𝑝)
𝑔𝑛]
𝑔𝑐
Where 𝑆𝑟𝑒𝑠𝑖𝑑𝑢 is the residual saturation which describes the part of water that remains in soil
even at high suction heads. 𝑆𝑠𝑎𝑡 is the saturation when pores are filled with water. 𝑔𝑎, 𝑔𝑛
and 𝑔𝑐 are empirical parameters. PLAXIS converts a two-parameter equation as Mualem
(1976) as
𝑔𝑐 = 1 − 𝑔𝑛 𝑔𝑛
The parameter 𝑔𝑎 is related to the air entry value (AEV) of the soil. The parameter 𝑔𝑛
is a function of the rate of water extraction once the AEV has been exceeded while the
parameter 𝑔𝑐 is a function of the residual water content (due to the curvature in high suction
range). More details about these models can be in the PLAXIS manual. No hysteresis effect
Figure 2.5. General soil water characteristic curve (SWCC) (Zhai, 2012)
References
1- Allen, R. G. D. (1975). Index numbers in theory and practice. Chicago, Aldine.
2- Allen, D. E. (1994). The history of future of limit states design. Journal of Thermal
Insulation and Building Envelopes, 18, 3-20.
3- Becker, D. E. (1996). Eighteenth Canadian geotechnical colloquium: limit states
design for foundations. Part I. An overview of the foundation design process.
Canadian Geotechnical Journal, 33(6), 956-983.
4- Becker, D. E. (1996). Eighteenth Canadian geotechnical colloquium: limit states
design for foundations. Part II. Development for the national building code of
5- Bjerrum, L. and Eggestad A. (1963). Interpretation of loading tests on sand.
Norwegian Geotechnical Institute Publication, 58, 23-27.
6- Bowles, D. S. (1987). A comparison of methods for risk assessment of dams. NATO
Advanced Study Institute, Tucson, AZ.
7- Brinch J. Hansen. (1953). Earth pressure calculation. Copenhagen.
8- Chester, D. L. (1990). Why two hidden layers are better than one. IJCNN 90,
Washington, DC, Lawrence Erlbaum, 1, 265-268.
9- Christian, J. T., Ladd, C. C. and Baecher, G. B. (1994). Reliability and Probability in
Stability Analysis. Journal of Geotechnical Engineering, ASCE. 120, 1071-1111.
10-Dai, S. H. and Wang, M. O. (1992). Reliability analysis in engineering applications.
New York, Van Nostrand Reinhold.
11-Deng, X. and Wang X., (2007). Application of dynamic fuzzy neural network to dam
deformation prediction. Hydropower Automation and Dam Monitoring, 4, 64-67
12-Duncan, J. M. and Chang, C. Y. (1970). Nonlinear analysis of stress and strain in
soils. Journal of the Soil Mechanics and Foundations Division, ASCE, 96(SM5),
1629-1653.
13-Duncan, J. M. and Tan, C. K. (1991). Settlement of Footings on Sands: Accuracy and
Reliability. Geotechnical Engineering Congress, ASCE, 1, 446-455.
14-Duncan, J. M. (2000). Factors of Safety and Reliability in Geotechnical Engineering.
15-Farinha, M. L., Caldeira, L. and Maranha das Neves, E. (2015). Limit state design
approach for the safety evaluation of the foundations of concrete gravity dams.
Structure and Infrastructure Engineering, 11, 1306-1322.
16-Foufoula-Georgiou, E. (1989). A probabilistic storm transposition approach for
estimating exceedance probabilities of extreme precipitation depths. Water Resources
Research, 25(5), 799-815.
17-Fredlund, D. G. and Xing, A. (1994). Equations for the soil-water characteristic
curve. Canadian Geotechnical Journal, 32, 521-532.
18-Goodarzi, E., Shui, L. T. and Ziaei, M. (2012). Dam overtopping risk using
probabilistic concepts-Case study: The Meijaran Dam, Iran. Ain Shams Engineering
Journal.
19-Graupe, D. (2013). Principles of Artificial Neural Networks. World Scientific.
20-Haimes, Y. Y., and E. Z. Stakhiv (1986). Risk-Based decision making in water
resources. Proceeding of an Engineering Foundation Conference, Santa Barbara,
CA, American Society of Civil Engineers, New York, NY.
21-Haimes, Y. Y., R. Petrakian, P. O. Karlsson, and J. Mitsiopoulos. (1988). Risk
analysis of dam failure and extreme floods: application of the partitioned
multi-objective risk method. Environmental Systems Management, Inc., Charlottesville, VA.
22-Harr, M. E. (1987). Reliability-based design in civil engineering. New York:
McGraw-Hill.
23-Harr, M. E. (1984). Reliability-based design in civil engineering. Henry M. Shaw
24-Hashiguchi. K. (1985). Macrometric approaches-static-instrincsically
time-independent. Proceedings XI ICSMFE, San Francisco, Constitutive laws for soils,
25-65.
25-Hashiguchi, K. (1993). Fundamental requirements and formulations of elastoplastic
constitutive equations with tangential plasticity. International Journal of Plasticity, 9,
525-549.
26-ICOLD. (1984). World register of dams: updating. International Commission of
Large Dams, Paris.
27-ICOLD. (1993). Embankment dams-Upstream slope protection, Review and
recommendations. International Commission of Large Dams, Paris, 91.
28-JongKoo, J. (2007). Fuzzy and Neural Network Models for Analyses of Piles. Ph.D
Thesis, Civil Engineering Department, North Carolina State University.
29-Karlsson, P. O., and Y. Y. Haimes. (1988a). Risk-Based Analysis of Extreme Events.
Water Resources Research, 24(1), 9-20.
30-Karlsson, P. O., and Y. Y. Haimes. (1988b). Probability Distributions and Their
Partitioning. Water Resources Research, 24(1), 21-29.
31-Karlsson, P. O., and Y. Y. Haimes. (1989). Risk assessment of extreme events:
application. Journal of Water Resources Planning and Management, 115(3),
299-320.
32-Kecman, V. (2001). Learning and Soft Computing: Support Vector Machines, Neural
33-Khalilzad, M. and Gabr, M. A. (2011). Deformation-Based Limit States for Earth
Embankments. ASCE Conference Proceeding, 36, 39-48.
34-Kondner. R. B. (1963). Hyperbolic stress-strain response: Cohesive soils. Journal of
SMF Div. Proceedings, ASCE, 89(SM1), 115-143.
35-Konstantakos, D. C. (2010). Advantages and Limitations of Ultimate Limit State
Design Methods for Braced Excavations. Earth Retention Conference 3, GSP 208.
36-Krabbenhoft, K., Damkilde, L. and Krabbenhoft, S. (2005). Ultimate limit state
design of sheet pile walls by finite elements and nonlinear programming. Computers
and Structures, 83, 383-393.
37-Kulhawy, F. H. (1992). On the evaluation of soil properties. Geotechnical Special
Publicaiton, 31, 95-115.
38-Lacasse, S. and Nadim, F. (1997). Uncertainties in characterizing soil properties.
Norwegian Geotechnical Institute, Oslo, Norway, 201, 49-75.
39-Langseth, A. M., and Perkins, M. (1983). The influence of dam failure probabilities
on spillway analysis. Proceedings of Conference on Frontiers in Hydraulic
Engineering. ASCE, New York.
40-Liu, L. (1989). Optical Pattern Fuzzy Logic. Japanese Journal of Applied Physics,
29(2).
41-Lumb, P. (1966). The variability of natural soils. Canadian Geotechnical Journal, 2.
42-MacGregor, J. G. (1976). Safety and limit state design for reinforced concrete.
Canadian Journal of Civil Engineering, 3(4), 484-513.
44-McCann, M. W., Franzini, J. B. Kavazanjian, E. and Shah, H.C. (1985). Preliminary
safety evaluation of existing dams. John A. Blume. Earthquake Engineering Center,
Stanford University, 69.
45-Meyerhof, G. G. and Murdock, L. J. (1953). An investigation of the bearing capacity
of some bored and driven piles in London clay. Geotechnique, 3, 267-282.
46-Meyerhof, G. G. (1970). Safety factors in soil mechanics. Canadian Geotechnical
Journal, 7, 349-355.
47-Meyerhof, G. G. (1982). Limit states design in geotechnical engineering. Structural
Safety, 1, 67-71.
48-Meyerhof, G. G. (1984). Safety factors and limit states analysis in geotechnical
engineering. Canadian Geotechnical Journal, 21, 1-7.
49-Meyerhof, G. G. (1993). Development of geotechnical limit state design. Proceedings
of the International Symposium on Limit State Design in Geotechnical Engineering,
Copenhagen, Danish Geotechnical Society, Copenhagen, 1(3), 1-12.
50-Meyerhof G. G. (1995). Development of geotechnical limit state design. Canadian
Geotechnical Journal, 32(1), 128-136.
51-Minsky M. L. and Papert S. (1969). Perceptrons. MIT Press, Cambridge MA.
52-Misra, A. and Roberts, L. A. (2009). Service limit state resistance factors for drilled
shafts. Geotechnique 59(1), 53–61.
53-Moser, D. A., and E. Z. Stakhiv. (1987). Risk analysis considerations for dam safety,
in engineering reliability and risk in water resources. NATO Advanced Study Institute,
54-Ovesen, N. K. (1981). Towards a European code for foundation engineering. Ground
Engineering, 14(7), 25-28.
55-Ovesen, N. K. and Orr, T. (1991). Limit States Design: the European perspective.
Proceedings of Geotechnical Engineering Congress, American Society of Civil
Engineers, Special Publication, 27(2), 1341-1352.
56-Ovesen, N. K. (1993). Eurocdoe 7: a European code of practice for geotechnical
design. Proceedings of the International Symposium on Limit State Design in
Geotechnical Engineering, 3, 691-710.
57-Pedroso, D. M., Chao, D. S. and Dong, J.Z. (2009). The concept of reference curves
for constitutive modeling in soil mechanics. Computers and Geotechnics, 36, 149–
165.
58-Pedroso, D. M., Williams, D. J. (2010). A novel approach for modelling soil water
characteristic curves with hysteresis. Computers and Geotechnics 37 (3), 374–380.
59-Petrakian, R., Y.Y. Haimes, E. Stakhiv, and D. Moser. (1989). Risk analysis of dam
failure and extreme floods. American Society of Civil Engineers, New York, NY.
60-Resendiz-Carrillo, D., and L.B. Lave. (1987). Optimizing Spillway Capacity with an
Estimated Distribution of Floods. Water Resources Research, 23(11), 2043-49.
61-Rumelhart, D. E. and McClelland (1986). Parallel Distributed Processing:
Explorations in the Microstructure of Cognition. MIT Press, Cambridge, MA.
62-Schanz, T., Vermeer, P. A. and Bonnier, P. G. (1999). Formulation and verification of
63-Skempton A. W., MacDonald D. H. (1956). The allowable settlements of buildings.
Proceedings I.C.E., 5, 727-768.
64-Terzaghi, K. (1943). Theoretical soil mechanics. John Wiley & Sons, New York
65-Terzaghi, K. and Peck, R. B. (1948). Soil mechanics in engineering practice. John
Wiley & Sons, New York.
66-US Army Corps of Engineers (USACE). (2006). Reliability analysis and risk
assessment for seepage and slope stability failure modes for embankment dams. ETL
1110-2-561.
67-Van Genuchten, M. Th. (1980). A closed-form equation for predicting the hydraulic
conductivity of unsaturated soils. Soil Science Society of America Journal, 44, 892–
898.
68-Von Thun L. (1987). Use of risk-based analysis in making decision on dam safety.
Engineering Reliability and Risk in Water Resources, 205-221.
69-Zain, N. H., Ahmad, J., Ashaari, Y., Shaffie, E. and Mustaffa, N. K. (2011).
Modelling of lateral movement in soft soil using hardening soil model. Proceedings,
UKSim 13th International Conference on Modelling and Simulation, 195-200.
70-Zaretskii, Yu, K. and Karabaev, M. I. (1985). Limit-state design of cast-in-place piles.
Soil Mechanics and Foundation Engineering, 22, 169-175.
71-Zhai, Q. and Rahardjo, H. (2012). Determination of soil-water characteristic curve
CHAPTER 3. EVALUATION OF FEMA RISK TOOL AND ESTIAMTION OF PROBABILITIES OF EXCEEDING LIMIT STATES FOR EMBANKMENT DAMS
3.1 Abstract
Climate change is causing a rise in sea level, which increases the likelihood of recurring
damaging floods from storm surges for embankment structures (i.e., dams and levees). To help
mitigate these damages, precise techniques must be developed for risk assessment and
probability of exceeding limit states estimation for these structures; being the first defense line
against flood all over the country. Existing risk estimation tool estimates probabilities of
exceeding limit states in a qualitative manner that doesn’t necessarily represent actual structure
behavior or damage level. It also has no way of taking storm cycles history or soil profile into
consideration. This along with limited allocated nation’s budget for remediation, urges the
need for development of approaches that estimates probabilities in a quantitative way.
Therefore, work inhere evaluates existing risk tool that was developed for the Federal
Emergency Management Agency (FEMA) for risk estimation for dams along with sensitivity
analysis using contour plots. An approach for quantitative probability estimation using
PLAXIS 2D numerical analysis and a probability estimation sheet is proposed. The Howard
A. Hanson (HHD), located on the Green river near Seattle, Washington, is used as a case study.
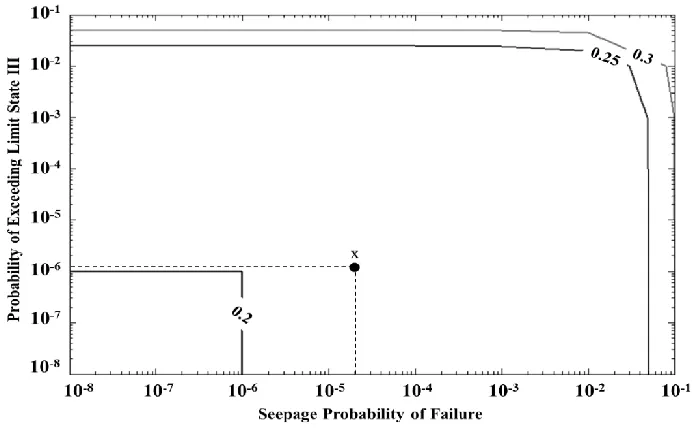
Numerical analysis results showed a probability of exceeding limit state III of 1.2*10-6 for
normal stability and 2*10-5 for seepage after 6 storm cycles and a loss of life risk ranging from
0.001 to 0.25 for an overtopping probability of failure from 1*10-1 to 1*10-8 (Point x on the
contour plot). Also, increasing storm cycles increased the probability of exceeding LSI from
2*10-6 to 3.9*10-3, LSII from 1.2*10-10 to 4.5*10-5, LSIII from 5.3*10-14 to 1.2*10-6 going from
3.2 Introduction
Climate change and global warming are leading to rise in the sea level. In the coming
centuries, Sea level rise will be a threat to coastal land, infrastructures and ecosystems
(Overpeck et al. 2006; Titus et al. 1991; Wu et al. 2009). More than 160 million people lives
in a coastal region that are less than 1 m below sea level (Allison et al. 2009; Peters et al. 2013).
Several researchers predicted sea level rise projections in the 21st century to be in the range of
50 to 150 cm (Chang et al. 2015). A recent study in Nature magazine showed that Antarctica
alone will contribute with more than 1 m of sea-level rise by 2100 and more than 15 meters by
2500 (DeConto et al. 2016). The climate central report (2012) showed that global warming more than doubles the odds of severe floods to happen over the coming 18 years.
Rising sea level will increase the likelihood of recurring damaging floods from storm
surges and will necessitate the precise assessment of risk related to severe surge storms. Across
the country, nearly 5 million people live in 2.6 million houses on land less than 4 feet above
high tide (Ben Strauss et al. 2012). This population is at risk in case of flooding without
efficient protection and emergency response plan. On the other hand, earth embankment
structures (dams and levees) are a main defense line that are used to mitigate flooding damage
all over the country. The emerging climate change and sea level rise implies the need for
accurate estimation of the probability of exceeding limit states defining distinct levels of
structural stability, and its consequences due to storms, surges or flooding. Existing FEMA
risk estimation tool (URS, 2007) estimates probabilities of exceeding limit states in a
qualitative manner that doesn’t necessarily represent structure actual behavior or damage level.