Study and Analysis of Recast Layer
Formation during Wire Electro Discharge
Machining Process
Bhosale Sachin 1, Shelge Shrinivas 2, Bhagwat Vishal3
Assistant Professor, Dept. of Mechanical Engineering, V.P.’s College of Engineering, Baramati, Maharashtra, India1
Assistant Professor, Dept. of Mechanical Engineering, V.P.’s College of Engineering, Baramati, Maharashtra, India2
Assistant Professor, Dept. of Mechanical Engineering, V.P.’s College of Engineering, Baramati, Maharashtra, India3
ABSTRACT: Wire-electrical discharge machining (WEDM) is a non-traditional machining process in which a pulsed voltage difference between a wire electrode and a conductive workpiece initiates sparks which erode workpiece material. Removing material in such a way is often advantageous when the workpiece material would be difficult to machine with traditional machine tools due to high strength, hardness, toughness, etc. This process has been used in commercial machine tools for nearly half a century. It is well known that the EDM process has a detrimental impact on the surface integrity of machined surfaces. Each spark melts a small portion of the workpiece. A portion of this molten material is ejected and flushed away. The remaining material re-solidifies to form a surface layer known as the recast layer. This layer can contain an altered microstructure, tensile stresses, microcracks, impurities which can lead to premature part failure when put to service. Surface integrity effects are dependent upon both the wire-EDM process parameters and the chemical composition of the workpiece. Experimentation has been done using Taguchi’s L9 orthogonal array. Each experiment was conducted under different combinations of pulse on time, pulse off time and Wire feed. The optimum machining parameter combination was obtained by using the analysis of signal-to-noise (S/N) ratio, analysis of means and analysis of variance (ANOVA) in Minitab 15 software. The analysis of variance (ANOVA) was carried out to study the effect of process parameters on process performance
KEYWORDS: WEDM, Recast Layer, micro-hardness, Taguchi method, Design of Experiment.
I. INTRODUCTION
of the morphologies revealed great deference between the two cases. Over the ranges examined, short current pulse durations created craters by vaporization, while long current pulse durations generated craters through melting.
II. MATERIAL SELECTION
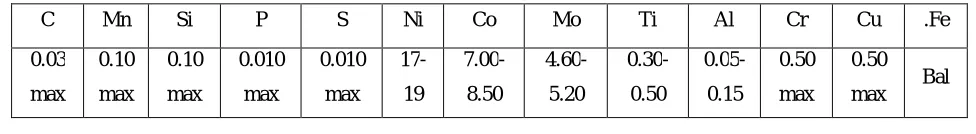
Much work has been devoted to the study of surface integrity in wire-EDM of common steel alloys, particularly tool and die steels. However, little research has been reported on the effects of wire-EDM on high nickel content superalloys. Specifically, no significant literature has been found by the author relating to surface integrity of MDN 250. Maraging is a 18% nickel, cobalt strengthened steel (C-type), with excellent mechanical properties, workability and heat treatment characteristics. Typical applications for maraging include missile and rocket motor cases, landing and takeoff gear, munitions, aerospace, extrusion tooling, die casting, high Performance shafting, gears and fasteners. Spectroscopic analysis was done to find the chemical composition of material. The limiting chemical composition of MDN 250is listed in Table 1.
Table1. Chemical composition of MDN 250
C Mn Si P S Ni Co Mo Ti Al Cr Cu .Fe
0.03 max 0.10 max 0.10 max 0.010 max 0.010 max 17-19 7.00-8.50 4.60-5.20 0.30-0.50 0.05-0.15 0.50 max 0.50
max Bal
III. EXPERIMENTATION
Experiments were conducted to find the available parameters and the range over which they could be varied. An experiment was designed and conducted to test the effect of each variable. The measured output, recast layer thickness and Micro hardness were analyzed. Through these experiments, the major contributing factors could be identified. All of the wire-EDM cuts were made on Electronica Spreintcut 734 Wire-EDM machine. This machine is capable of CNC motion in two-axes and with the appropriate wire guides can accept wire from a diameter of 100 µm to 300 µm. For actual Experimentation Brass wire with diameter of 0.25mm is used. The machine has a reservoir of water, which acts both as a dielectric and as a flushing medium for the swarf. The machine controls the conductivity of the water by de-ionizing it with a resin tank. A chiller maintains the water at a constant temperature. While the parameters and their levels selected for the work given in Table 2. The two material Strips of size 100mm x 25mm x 8 mm were used as workpiece material. Small cuts of 5mm x 5mm x 8mm along the length of work piece were taken on CNC WEDM and for the same CNC Program were feed to machine. The design of experimentation is used for actual Practice; The Parameters values are selected from available machine (Electronica Sprintcut 734) parameter range.
Table 2. Parameters and their levels selected for work
Symbol Levels Parameters
unit
Level 1 Level 2 Level 3
A Pulse on time (Ton)
µs
120 115 125
B Pulse off time (Toff)
µs
60 55 50
C Wire Feed m/min 2 3 4
get photograph on PC. Due to the variable nature of the recast layers observed, an average must be taken. The best results were obtained when an average recast layer thickness was calculated by measuring the area of the recast material and dividing by the length of the measurement. The average values of Recast layer thickness were measured and tabulated in Table 3.
Table.3 Experimental design using L9 orthogonal array for Response as Avg. RL Thickness of MDN 250.
RUN/ Experiment
No
Parameters
Observed Avg.gap
current
Response
Ton
(µs)
Toff
(µs)
Wf
(m/min)
Avg RL thickness(µm)
1 120 60 2 2 11
2 120 55 3 3.5 20
3 120 50 4 5 16
4 115 60 3 2 11
5 115 55 4 2.5 17
6 115 50 2 3 10.5
7 125 60 4 4 21
8 125 55 2 4.5 20
9 125 50 3 5 14
IV. MICRO HARDNESS EXPERIMENTS
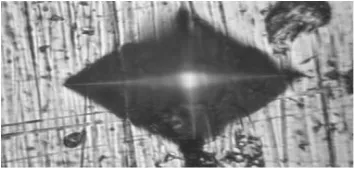
Micro Vickers hardness tester (model HV 10009, Sr. No 75/2014) Manufactured by ACME ENGINEERS, Dhayri, Pune, India, is used for Micro hardness testing of all cut specimens. The term micro-hardness test usually refers to static indentations made with loads not exceeding 1 kgf. The load value of 0.5N for dwell of 10 sec was used on the Vickers micro hardness indenter in present study. Fig. 1 shows a sample indentation of a diamond indenter. Vickers hardness is also sometimes called Diamond Pyramid Hardness (DPH) owing to the shape of the indenter. The test samples should have a smooth surface and beheld perpendicular to the indenter. All things being equal, a lighter indenter load will require a smoother surface for a satisfactory test. Indentation is done on each and every cut specimen and results as Micro hardness are tabulated as shown in Table 4.
Table.4. Experimental design using L9 orthogonal array for Response as Micro hardness of MDN 250 RUN/ Experiment No Parameters Observed Avg.gap current Response Ton (µs) Toff (µs) Wf (m/min) Micro Hardness (VH)
1 120 60 2 2 187.6
2 120 55 3 3.5 183.9
3 120 50 4 5 110
4 115 60 3 2 233.6
5 115 55 4 2.5 217.5
6 115 50 2 3 231.4
7 125 60 4 4 224.3
8 125 55 2 4.5 235.1
9 125 50 3 5 237.4
It can be seen from the table that for a RL thickness & Micro hardness is maximum followed by Ton, Wf and Toff. Hence
in the same order rank is given to the control factors
.
V. RESULT ANALYSIS
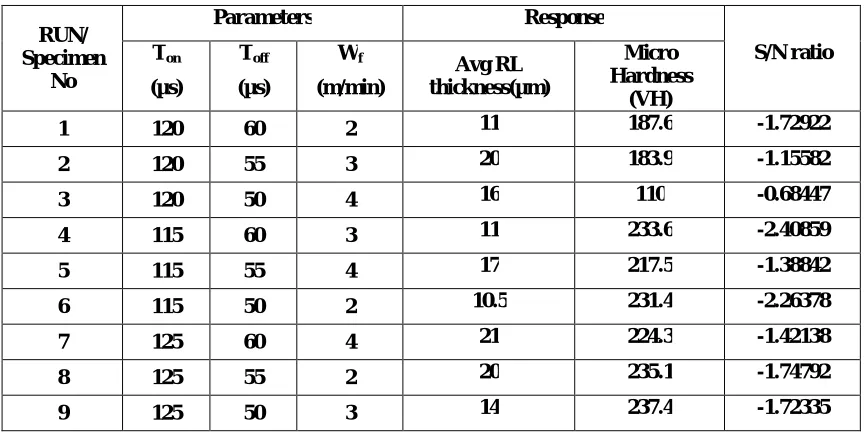
The observed RL thickness& Micro hardness is entered as a response for this analysis. The results generated by the MINITAB 15 in terms of S/N ratio are used to draw the conclusions. The Table 5 indicates the S/N ratio for nine experimental runs with factor level set for each trial as per MINITAB 15 software.
Table 6.1 S/N ratio given by MINITAB for RL thickness& Micro hardness as a response
RUN/ Specimen
No
Parameters Response
S/N ratio Ton (µs) Toff (µs) Wf (m/min) Avg RL thickness(µm) Micro Hardness (VH)
1 120 60 2 11 187.6 -1.72922
2 120 55 3 20 183.9 -1.15582
3 120 50 4 16 110 -0.68447
4 115 60 3 11 233.6 -2.40859
5 115 55 4 17 217.5 -1.38842
6 115 50 2 10.5 231.4 -2.26378
7 125 60 4 21 224.3 -1.42138
8 125 55 2 20 235.1 -1.74792
The result shows that the Minimum RL thickness i.e. 12µm is obtained at 115 µs Ton, 60Toff, 2m/min Wf . This is the
optimum conditions in which the experiments performed.
5.1 Effect of pulse on time, wire feed and pulse off time on the Recast Layer
Fig.2 Contour Plots for RL v/s Pulse on time, pulse off time
Fig.3 Contour Plots for RL v/s Pulse on time, Wire Feed
Contour plots are useful to determine output Values at intermediate input parameter levels. Fig 2 & Fig. 3 shows the effect of each parameter at various intermediate levels. It shows effect of two parameters on the RL at intermediate levels. The result shows that the Minimum RL thickness i.e. 12µm is obtained at 115 µs Ton, 60Toff, 2m/min Wf . This is
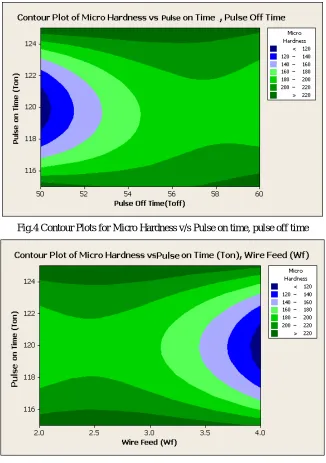
5.2 Effect of pulse on time, wire feed and pulse off time on the microhardness
Fig.4 Contour Plots for Micro Hardness v/s Pulse on time, pulse off time
Fig.5 Contour Plots for Micro Hardness v/s Pulse on time, Wire Feed
Fig. 4 & Fig. 5 shows the effect of each parameter at various intermediate levels. It shows effect of two parameters on the micro hardness at intermediate levels. The result shows that the Minimum micro hardness i.e. ≤120 HV is obtained
Fig.6 Line Plot for Means of RL & Micro hardness vs Ton,Wf,Toff
From the line plots obtained from Minitab software it s found that as Pulse on time and Wire feed increase Recast layer thickness and micro hardness increases.
VI. CONCLUSION
An extensive experimental study has been conducted to investigate the effect of the machining parameters on machining characteristics in WEDM on MDN 250. The machining parameters are the pulse duration (Ton), pulse
interval (Toff), Wire Feed (Wf), While, the machining characteristics are the recast layer (RL) and Micro hardness.
The following conclusion was drawn from the study.
1. Pulse on time (ON) was appeared to be the main effect for all two responses investigated in this study. This means that, ON is the most significant and dominant factor than other factors in affecting the surface integrity such as RL & Micro hardness. Thus, in order to minimize RL when machining MDN 250, one can employ
low pulse on time 115 μs, pulse off time 60 μs& wire feed of 2 m/min.
2. The results images obtained in SEM in this investigation also reveals that RL normally caused by different process parameters causes surface integrity like uneven fusing structure, globules of debris, shallow craters, pockmarks and voids. These effects become more evident when ON increased.
3. From the experimental results, the most significant factor for RL was pulse on, wire feed and then pulse off. It is observed that thickness of RL rapidly increased when pulse on increased while pulse off decreased. This happened due the molten materials builds up and resolidified on the machined surface during cooling period. Recast layer also contributed to the micro hardness increment during machining MDN 250.
4. From the micro hardness for cut specimens were observed as having increased values from that of Base metal’s Micro hardness value, thus it is clear that as RL is present after machining it consist altered microstructure which results in increased Micro hardness.
ACKNOWLEDGEMENT
REFERENCES
[1] Thomas R. Newton, Shreyes N. Melkote, Thomas R.Watkins, Rosa M. Trejo, Laura Reister “Investigation of the effect of process parameters on the formation and characteristics of Recast layer in wire-EDM of Inconel 718”,Materials Science and Engineering A 513–514 (2009) 208– 215.
[2] Y. Liao, J. Huang, and H. Su, “A study on the machining-parameters optimizationof wire electrical discharge machining”, Journal of Materials ProcessingTechnology, 71:487–493, 1997.
[3] A. Hascalyk and U.C, “Experimental study of wire electrical dischargemachining of AISI D5 tool steel”, Journal of Materials Processing Technology, 148:362–367, 2004.
[4] S. Kuriakose and M. Shunmugam, “Characteristics of wire-electro discharge machinedTi6Al4V surface”, Materials Letters, 58:2231–2237, 2004.
[5] J. Huang, Y. Liao, and W. Hsue, “Determination of finish-cutting operation number and machining-parameters setting in wire-electrical discharge machining”, Journal of Materials Processing Technology, 87:69–81, 1999.
[6] B. Yan, H. Tsai, F. Huang, and L. Lee, “Examination of wire electrical dischargemachining of AL2O3/6061Al composites”, International Journal of Machine Tools& Manufacture, 45:251–259, 2005.
[7] Danial Ghodsiyeh, Abolfazl Golshan, Jamal Azimi Shirvanehdeh, “Review on Current Research Trends in Wire Electrical Discharge Machining (WEDM)”,Indian Journal of Science and Technology, Vol: 6 Issue: 2 February 2013 ISSN:0974-6846.
[8] Kumar Anish, Dr. Kumar Vinod, Dr. Kumar Jatinder, “A review on effect of WEDM performance, recast layer and wire accuracy”, First National Conference on Advances in Mechanical Engineering (NCAME-2011), 20TH - 21st May 2011, UIET, Punjab University, Chandigarh. [9] Rajeev Kumar and Shankar Singhgives “Current Research Trends in Wire Electrical DischargeMachining: An Overview” in International
Journal on Emerging Technologies 3(1): 33-40(2012)
[10] C.D. Shah, J.R.Mevada and B.C.Khatri, “Optmization of Process Parameter of WEDM By Response Surface Methodology on Inconel-600”International Journal of Emerging Technology and Advanced Engineering, Volume 3, Issue 4, April 2013.
[11] S. Jeelani and M. Collins,“Effect of electric discharge machining on the fatigue life of Inconel 718. International Journal of Fatigue”, 10(2):121–125, 1988.
[12] R. Williams and K. Rajurkar, “Study of wire electrical discharge machined surface characteristics. Journal of Materials Processing Technology”, 28:127–138, 1991.
[13] J. Kruth and P. Bleys, “Measuring residual stress caused by Wire EDM of tool steel”, International Journal of Electrical Machining, 5:23–28, 2000.
[14] Warren, Y. Guo, and M. Weaver,“The influence of machining induced residual stress and phase transformation on the measurement of subsurface mechanical behaviour using nanoindentation”, Surface Coatings & Technology, 200:3459–3467, 2006.
[15] Brinksmeier, E, Koning, W, Leskover P and Tonshoff H. K,“Residual Stress Measurement and Causes in Machining Process”, Ann. of CIRP, Vol. 31, No. 2, pp. 491 510, 1982.
[16] C. Wilkins,“EDM wire covers all the angles”, Cutting Tool Engineering, pages40–45, April 1996.
[17] A. Schoth, R. Forster, and W. Menz, “Micro wire EDM for high aspect ratio 3Dmicrostructuring of ceramics and metals”, Microsystem Technologies, 11:250–253, 2005.
[18] Tapan Bagachi, "Taguchi Methods Explained: Practical Steps to Robust Design ", Prentice-Hall India Ltd., 1992. [19] Phillip J. Ross, "Taguchi technique for quality engineering" McGraw-Hill publication.
[20] Rodge M. K, Sarpate S. S and Sharma S. B “ Investigation on Process Response and parameters in Wire Electrical Discharge Machining of Inconel 625”, International Journal of Mechanical Engineering and Technology, ISSN 0976 -6340, volume4, Issue 1, January-February (2013), pp.54-56.