Comparative Study of Frequency Vs Spacial
Domain for Multi Sensor Image Fusion
Leelavathi H P
1, Ram Manohar Nisarg
2Assistant Professor, Department of Electronics and Engineering, Vivekananda Institute of Technology, Bangalore,
Karnataka, India1
Assistant Professor, Department of Computer Science and Engineering, Vivekananda Institute of Technology,
Bangalore, Karnataka, India2
ABSTRACT: In the field of remote sensing, satellite imaging and medical imaging, images captured are often noisy, blurred and may exhibit in-sufficient resolution. Due to this instability, super imposing of Multi-sensor images has become imperative to obtain clear image, which is more appropriative for human visual perception. Image fusion has become a discipline, which demands more formal solution in different situations. Several situations in image processing require both high Spatial and high Spectral information in single image itself. This paper reviews the existing advanced pixel based Spatial domain image fusion techniques such as Average and Weighted Average method, Select Maximum, Brovey Transform, Intensity Hue Saturation(IHS), Principal Component Analysis (PCA) and Frequency domain image fusion techniques such as Fast Fourier Transform, Laplacian Pyramid, Local regression, Smoothing filter (SF), etc. Our paper is organized in the following way: Section-1: Gives introduction to image fusion. Section-2: Provides details of different fusion techniques used in both Spatial and Frequency domain. Section-3: Provides details of Measuring Techniques. Section-4: Provides comparisons of fusion methods in Spatial and Frequency domain. Finally, Section-5: Provides a Summary of the paper and its main conclusions.
KEYWORDS:Image Fusion, Spatial and Spectral domain, Average method, Principal Component Analysis (PCA), Frequency Filters, Discrete Wavelet Transform (DWT).
I. INTRODUCTION
Due to the imperfections in imaging devices, such as optical degradations, limited resolution of CCD sensors and instability of the observed scene like object motion, media turbulence etc., acquired images are often blurred, noisy and may exhibit in-sufficient Spatial resolution. So, Multi-Sensor image fusion is a method of merging relevant information from several images into a single image [7]. The objective of image fusion is to extract all vital information from Multi-Sensor images and allow the integration of different information source. Images acquired from the visual sensors need additional local processing to convey only the useful information. By using Spatial and Frequency domain techniques several observation constraints can be overcome.
The image fusion applications are extensively used in medical imaging, microscopic imaging, remote sensing, computer vision, and robotics [5]. Several approaches to image fusion can be distinguished, depending on whether the images are fused in the spatial domain or Spectral domain. The actual fusion process can take place at different levels of information representation adopted in several approaches. These approaches can be divided into two types, spatial domain method and Frequency domain method.
In Frequency domain methods [13], the input images are decomposed into Multi-scale coefficients initially. Various fusion rules are used in the selection or manipulation of these coefficients and synthesized via inverse transforms to form the fused image. The goal of our paper is to perform a comparative analysis of various Spatial and Frequency domain image fusion techniques/methods on Multi-sensor images.
II. FUSIONMETHODS
The general requirement of an image fusing process is to preserve all valid and useful information from the source images, while at the same time it should not introduce any distortion in resultant fused image. There are various methods that have been developed to perform image fusion. These methods can be divided into two types, spatial domain method and frequency domain method.
1. Spatial Domain: The term spatial domain refers to the image plane itself, i.e. aggregate of pixels of composing an image, and approaches in this category are based on direct manipulation of pixels in an image. There are various techniques that have been developed to perform image fusion in spatial domain. Some well-known image fusion techniques [12] are listed below: - (1) Average method (2) Select Maximum (3) Weighted Average Method (4) Principal component analysis (PCA) based fusion (5) Intensity-hue-saturation (IHS) transform based fusion (6) Brovey method.
2. Average Method: In this method, the resultant image is obtained by averaging every corresponding pixel in the input images. It is one of the simplest method and easy to understand and implement. It works well when images to be fused from same type of sensor and contain additive noise [11]. This method is very good for certain particular cases where in the input images have an overall high brightness and high contrast. However, it leads to undesirable side effect such as reduced contrast and some noise can easily introduced into the fused image, which will reduce the resultant image quality consequently.
The average value is assigned to the corresponding pixel of the output image which is given in below equation. P( i,j) = {A (i,j) +B (i,j)}/2
Where A (i,j) and B(i,j) are two input images. This is repeated for all pixel values.
3. Select Maximum: The greater the pixel values the more focus the image. Thus this algorithm chooses the in-focus regions from each input image by choosing the greatest value for each pixel, resulting in highly in-focused output [11]. The value of the pixel P (i, j) of each image is taken and compared to each o ther. The greatest pixel value is assigned to the corresponding pixel.
P( i,j) = ∑ ∑ Where A (i,j) and B (i,j) are the input images & P(i,j) is the resultant image.
4. Weighted Average Method: In this method the resultant fused image is obtained by taking the weighted average intensity of corresponding pixels from both the input images.
P(i,j) = ∑ ∑
Where A (i,j) and B (i,j) are the input images & P(i,j) is the resultant image and w is weight factor.
5. Principal Component Analysis Method: Principal component analysis is a vector space transform often used to reduce multidimensional data sets to lower dimensions for analysis. It reveals the internal structure of data in an unbiased way. This method [11] is very simple to use and the images fused by this method have high spatial quality. It prevents certain features from dominating the image because of their large digital numbers. The main advantage of PCA is that once we have found these patterns in the data, and we compress the data, i.e. by reducing the number of dimensions, without much loss of information. It suffers from spectral degradation. This method is highly criticized because of the distortion of the Spectral characteristic between the fused images and the original low resolution Images.
Stepwise procedure for PCA method is given below: Step 1: Get some data
Step 2: Subtract the mean
Step 3: Calculate the covariance matrix
Step 4: Calculate the eigenvectors and Eigen values of the covariance matrix Step 5: Choosing components and forming a feature vector
Fig.1Flow diagram of PCA
6. IHS Transform: Methods based on the Intensity Hue Saturation (IHS) transform [6] are probably the most popular approaches used for enhancing the spatial resolution of Multi-sensor images. The IHS method is capable of quickly merging the massive volumes of data. IHS transform refers to a transformation between RGB space and IHS space, it can transform the colour space from red (R), green (G), blue (B) to hue (H), saturation (S) and intensity (I). The former describe the colour from physics while the latter from human subjective vision. Firstly, the Spatial characteristic (I) and Spectral characteristics (H, S) is separated. Secondly, the high-resolution image is stretched according to I component, and then I was substituted by the high-high-resolution image. At last, IHS inverse transform is carried out to improve resolution and enhance Spectral characteristics. Aside from its fast computing capability for fusing images, this method can extend traditional three-order transformation to an arbitrary order.
Advantages
1) It provides high spatial quality.
2) It is a simple method to merge the images attributes. 3) It provides a better visual effect.
4) It gives the best result for fusion or remote sensing images. Disadvantages
1) It produces a significant colour distortion with respect to the original image. 2) It suffers from artefacts and noise which tends to higher contrast.
3) The major limitation that only three bands are involved
7. Brovey Transform: Brovey transform is also called colour normalization transform because it involves a red-green-blue (RGB) colour transform method [4]. It is a simple method for combining data from different sensors. It is a combination of arithmetic operations and normalizes the spectral bands before they are multiplied with the
Produce the column vectors from input images
Calculate the covariance matrix of the two column vectors formed in 1
Calculate the Eigen values and the Eigen vectors of the covariance
Normalize the column vector
Normalized Eigen vector act as the weight values which, multiply it with
each pixel of the input images
images. It retains the corresponding spectral feature of each pixel, and transforms all the luminance information into a Multi-sensor image of high resolution
The formulae used for the Brovey transform can be described as follows
Red = (band1/Σ band n) ∗ High Resolution Band
Green = (band2/Σ band n) ∗ High Resolution Band
Blue = (band3/Σ band n) ∗ High Resolution Band
III.SPECIALDOMAINBASEDIMAGEFUSIONMETHODS
One of the important pre-processing steps for the fusion process is image registration. Image registration is the process of transforming different sets of data into one coordinate system. In Spectral domain the original image is first transformed into a Fourier domain [13], processed using frequency filter and return to the original domain by performing inverse transformation without losing any information. To transform a given image into Fourier domain we commonly use the following transformation techniques:
Wavelet Transforms, Curve let Transforms, Discrete Fourier Transforms, Fast Fourier Transforms, Pyramid and High pass Filtering Methods.
Input Image Output Image
Fig.2Flow diagram of spectral domain based image fusion methods
1. Wavelet Transforms: Wavelets are finite duration oscillatory functions with zero average value. The irregularity and good localization properties make them better basis for analysis of signals with discontinuities. Wavelets can be described by using two functions viz. the scaling function and wavelet function. Wavelet transform has good spatial and frequency localization characteristics which showit mainly at three aspects: frequency feature compression, space compression and structure similarity of wavelets coefficients [2] among different scales. Frequency compression feature means that the energy of the original image concentrates at low frequency sub-band. Space compression means that the energy of high frequency sub band mainly distributes at corresponding positions of the edges of the original image. Structural similarity of wavelet coefficients refers to the general consistence of the distribution of wavelet coefficients in high frequency sub-bands [9] of the same orientation.
2. Discrete Wavelet Transform Method: Wavelet transforms are multi-resolution image decomposition tool that provide a variety of channels representing the image features by different frequency sub-bands at multi-scale [9]. It is a famous technique in analysing signals. When decomposition is performed, the approximation and detail component can be separated 2-D Discrete Wavelet Transformation (DWT) converts the image from the spatial domain to frequency domain. The image is divided by vertical and horizontal lines and represents the first-order of DWT, and the image can be separated with four parts those are LL, LH, HL and HH.
General process of image fusion using DWT
Step 1. Implement DWT on both the input image to create wavelet lower decomposition. Step 2. Fuse each decomposition level by using different fusion rule.
Step 3. Carry inverse discrete wavelet transform on fused decomposed level, which means to reconstruct the image, while the image reconstructed is the fused image
Pre Processing Direct Transformation
Frequency Filter Inverse Transformatio
n
P
DW T
(I,J)
(DWT(I,J)) 23. Stationary Wavelet Transform (SWT): The SWT is the translation invariant DWT transform. The SWT decomposes the 2D image into four sub-band structures as A, V, H, D namely Approximate, Vertical, Horizontal and Diagonal [2]. The approximate sub-band is used for next level of the decomposition. The fusion process is similar to DWT. Instead of DWT, here SWT transform is applied.
4. Curvelet Transform: Curvelet Transform is a non-adaptive technique for multi-scale object representation. Curvelet transform is also a multi-resolution decomposition technique [14]. The 2D-FFT (Two dimensional Fast Fourier Transform) is applied on images to obtain the Fourier samples. The Fourier samples are wrapped around the origin. Finally the image is reconstructed by performing the inverse FFT transform.
The main benefit of curvelets is its capability of representing a curve as a set of superimposed functions of various lengths and widths. The curvelet transform, unlike wavelet transform, is a multi-scale transforms, but, unlike wavelets, contains directional elements. Curvelets are based on multi-scale ridge lets with a band pass filtering to separate image into disjoint scales. The side length of the localizing windows is doubled at every other dyadic sub-band. The steps that are being followed by the Curvelet Transform Process are explained with the help of flow diagram as shown below
Sub band decomposition
Smooth portioning
Renormalizing
Ridget Analysis
5. Fast Fourier Transform: Fourier Transform decomposes an image into its real and imaginary components which is a representation of the image in the frequency domain. If the input signal is an image then the number of frequencies in the frequency domain is equal to the number of pixels in the image or spatial domain. The inverse transform re-transforms the frequencies to the image in the spatial domain. Computational reduction afford by the FFT are impressive indeed [15]. For example, computing the 2-D FFT of 1024*1024 image would require on the order of 20 million multiplication and addition, which is significant reduction from the one trillion computation required by DFT.
Multi-resolution image analysis by fast Fourier transform (MFFT) is very much similar to wavelets transform, where signal is filtered separately by low pass and high pass finite impulse response (FIR) filters and the output of each filter is decimated by a factor of two to achieve first level of decomposition. The decimated low pass filtered output is filtered again separately by low pass and high pass filter followed by decimation by a factor of two provides second level of decomposition. The idea behind the MFFT is to replace the FIR filters with FFT. The image to be decomposed is transformed into frequency domain by applying FFT in column wise.
6. High Pass Filtering Methods: High pass filtering methods are used for image sharpening in frequency domain. Because edges and other abrupt changes in intensities are associated with high frequency components, image sharpening can be achieved in the frequency domain by High pass filtering, which attenuates low frequency components without disturbing high frequency information in the Fourier transform [8]. Some of the popular Frequency Filtering methods for image sharpening are the High-Pass Filter additive (HPFA), High Frequency Modulation (HFM).
7. A. the High-Pass Filter Additive (HPFA) technique is a method used to reduce data quantity and increase spatial resolution for Multi-Spectral (MS) image data [1]. HPF basically consists of an addition of spatial details, taken from a high-resolution Panchromatic (PAN) observation, into the low resolution MS image. The high frequencies information is computed by filtering the PAN with a high-pass filter through a simple local pixel averaging, i.e. box filters. It is performed by emphasizing the detailed high frequency components of an image and deemphasizes the more general low frequency information. The HPF method uses standard square box HP filters.
B. High Frequency Modulation (HFM)
The problem of the addition operation is that the introduced textures will be of different size relative to each multispectral channel, so a channel wise scaling factor for the high frequencies is needed. The alternative high frequency modulation method HFM extracts the high frequencies and then adds them to each multispectral channel via multiplication.
8. Pyramid Methods: The pyramid offers a useful image representation for a number of tasks. It is efficient to compute: indeed pyramid filtering is faster than the equivalent filtering done with a fast Fourier transform. The information is also available in a format that is convenient to use, since the nodes in each level represent information that is localized in both space and spatial frequency. There are two types of pyramid methods [7]:
A. Gaussian Pyramid
B. Laplacian Pyramid
The Laplacian pyramid is a fundamental tool in image processing. The Laplacian pyramid is derived from the Gaussian pyramid representation, which is basically a sequence of increasingly filtered and down-sampled versions of an image. The set of difference images between the sequential Gaussian pyramid levels, along with the first i.e. most down-sampled level of the Gaussian pyramid, is known as the Laplacian pyramid of an image. The difference levels are commonly referred to as the detail levels, and the additional level as the approximation level. The Laplacian pyramid transform is specifically designed for capturing image details over multiple scales. Laplacian pyramid represents the edge of the image detail at every levels, so by comparing the corresponding Laplace-level pyramid of two images, it is possible to obtain the fused image which merge their respective outstanding detail, and makes the integration of the image retaining the amount of information as rich as possible [8]. The source image is decomposed into a series of resolution spaces, and how to choose integration factor and fusion rule will directly affect the final quality of fused image.
IV. MEASURINGTECHNIQUES
1. Peak Signal to Noise Ratio (PSNR): PSNR is the ratio between the maximum possible power of a signal and the power of corrupting noise that affects the fidelity of its representation [8]. PSNR measure is given by
PSNR (dB) =20log
∑ ∑
Where A(i,j) is perfect image, A'(i,j) is the fused image
2. Entropy (En): Entropy is an index to evaluate the information quality contained in an image. If the value of the entropy becomes higher after fusing, it indicates that the information increases and fusion performances are improved. entropy is defined as follows
E=-
∑
3. Mean Squared Error (MSE): The mathematical equation of MSE is given by the equation
MSE
=
∑
∑
)2
Where A(i,j) is perfect image, B(i,j) is the fused image4. Normalized Cross Correlation (NCC): Normalized cross correlation are used to find out similarities between fused image and registered image is given by as follows
NCC
==
∑ ∑∑ ∑
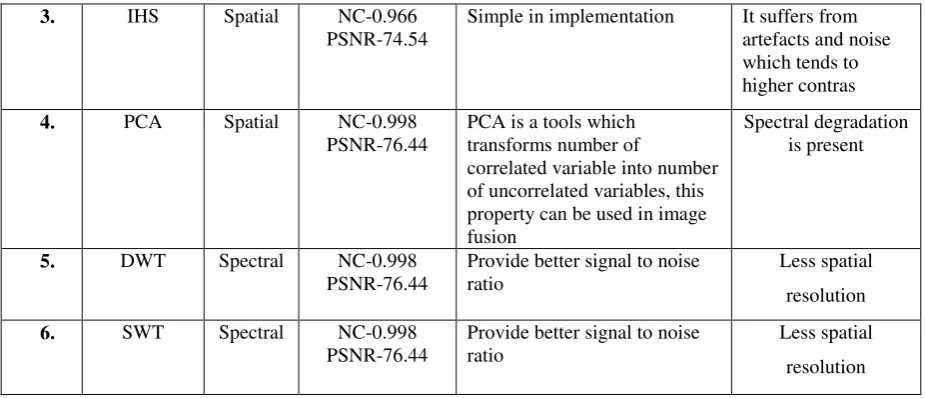
V. COMPARISONBETWEENVARIOUSFUSIONTECHNIQUES
In the Comparisons of different fused images, we found that the value of the PSNR and Entropy in average method is less than as compared to value of other frequency domain [14] method like SWT and Laplacian, which means fused images are not exactly to registered image. That is why transform domain methods are more suitable as compared to spatial domain method. But in some case spatial domain play a very important role in image fusion that contain high Spatial [3] information in fused image.
S.N Fusion
method
Domain Measuring
Parameter
Advantage Disadvantage
1. Average Method
Spatial PSNR-25.48 EN-7.22
Simple in implementation Resultant fused image is not clear
2. Maxima Spatial PSNR-26.86 EN-7.20
Fused image is highly focused image
Blurring effect is
3. IHS Spatial NC-0.966 PSNR-74.54
Simple in implementation It suffers from artefacts and noise which tends to higher contras
4. PCA Spatial NC-0.998 PSNR-76.44
PCA is a tools which transforms number of
correlated variable into number of uncorrelated variables, this property can be used in image fusion
Spectral degradation is present
5. DWT Spectral NC-0.998 PSNR-76.44
Provide better signal to noise ratio
Less spatial
resolution
6. SWT Spectral NC-0.998 PSNR-76.44
Provide better signal to noise ratio
Less spatial
resolution
Table 1 Comparison between various fusion techniques
VI. CONCLUSION
This review results shows that the Spatial domain provides high Spatial resolution and easy to perform, but they have image blurring problem and their outputs are less informative. The Spectral domain techniques are very good techniques for the image fusion and provide a high quality Spectral content, but they exhibit a less Spatial resolution. Combination of Spatial and Spectral domain fusion method provides better image quality and performance [10].
REFERENCES
[1] Younggi Byun, Jaewan choi, Youkyung han, " An Area-Based Image Fusion Scheme for the Integration of SAR and Optical Satellite Imagery", IEEE Journal, vol 6, issue 5, Year 2013.
[2] Huaxun zhang, Xu cao, “A Way of Image Fusion Based on Wavelet Transform", IEEE Conference, Year 2013.
[3] Al-Wassai, Kalyankar, Al-zaky, " Spatial and spectral Quality Evaluation Based on Edges Regions of Satellite: Image Fusion", IEEE Conference, Year 2012.
[4] Gupta V.K, Neog, Katiyar, “Analysis of Image Fusion Technique over Multispectral and Microwave SAR images", IEEE Conference, Year 2013.
[5] Yu Zeng, van genderen, Jixian Zhang, “Evaluation Criteria for Image Fusion Performance in Different Applications", IEEE Conference, Year 2012.
[6] Nizam, Telatar, “Multispectral image fusion based on the Multiwavelet and HIS transforms", IEEE Conference, Year 2012.
[7] JinlingWang, Kefei Song, Xiaojun He, “Multi-spectral image fusion based on the characteristics of image system", IEEE Conference, Year 2013.
[8] Wenjing Pei, Guian Wang, Xianchuan, “Performance evaluation of different references based image fusion quality assessment of remote sensing image fusion", IEEE Conference, Year 2012.
[9] Lixin Liu, Hongyu Bian, Guofeng Shao, "An effective waavelet-based scheme for multifocus image fusion", IEEE Conference, Year 2013. [10] Mingjing Li, Yubing Dong, "Review on technology of pixel-level image fusion", IEEE Conference, Year 2013.
[11] Anita, Moses, "Survey on Pixel level image fusion techniques", IEEE Conference, Year 2013.
[12] Prof. Keyur N. Brahmbhatt, Dr. Ramji M. Makwana, “Comparative Study on Image Fusion Methods in Spatial Domain”, International Journal of Advanced Research in Engineering and Technology (Ijaret), Volume 4, Issue 2, March – April (2013).
[13] Subitha.V, Jenicka.S, “Efficient Image Fusion In Color Images Using Multi-resolution Transform Techniques", International Journal Of Advanced Research In Computer And Communication Engineering, Vol. 2, Issue 7, July 2013.
[14] Y. Kiran Kumar, " Comparison Of Fusion Techniques Applied To Preclinical Images: Fast Discrete Curvelet Transform Using Wrapp ing Technique & Wavelet Transform", Journal Of Theoretical And Applied Information Technology © 2005 - 2009 Jatit. All Rights Reserved. [15] VPS Naidu, " Multi-Resolution Image Fusion by FFT " , 2011 International Conference on Image Information Processing (ICIIP 2011) [16] Navneet Kaur, Jaskiran Kaur, "A Novel Method For Pixel Level Image fusion Based on Curvelet Transform", International Journal of