Importance
Sampling
for the Efficient Simulation
of Adaptive Systems in
Frequency Nonselective
Slow Rayleigh Fading
w.
A.
Al-Qaq
J.
K. Townsend
~nter
for Communications
and
Signal Processing
Department of Electrical
and
Computer Engineering
---North Carolina State University
TR-94j4
Technical Area: Modeling and Simulation Techniques
Importance Sampling for the Efficient Simulation of Adaptive
Systems in Frequency Nonselective Slow Rayleigh Fading
1Wael A. AI-Qaq 2 J. Keith Townsend 3
Center for Communications and Signal Processing, Department of Electrical & Computer Engineering, North Carolina State University, Raleigh, NC 27695-7914
Tel: (919)515-7353 Fax: (919)515-5523
Abstract
Importance sampling (IS) is recognized as an efficient technique in reducing the simulation run time needed to estimate low bit error rates (BER's) in digital communication systems. However, IS applications presented in the literature thus far have been primarily limited to systems with additive white Gaussian noise (AWGN).
In this paper, we present an IS stochastic technique for the efficient simulation of adaptive systems which employ diversity in the presence of frequency nonselective slow Rayleigh fading and AWGN. After accounting for the overhead of the optimization algorithm, average speed-up factors of up to 6 orders of magnitude (over conventional Monte Carlo (MC)) were attained for error probabilities as low as 10-11
•
lThiswork was supportedin part by the Center for Communications&Signal Processing, North Carolina State University.
2W. A. Al-Qaq is an IBM Graduate Fellow.
1
Introduction
As the demand for wireless data communications increases, so will the need for low bit error
rate (BER) wireless links. Since the wireless channel is frequently characterized by Rayleigh
fading and AWGN, adaptive reception as well as diversity combining schemes [1, 2, 3] are
techniques useful for mitigating time variations in the channel and of achieving lower BER's
for data applications. Unfortunately, this added complexity makes closed form analysis of
the BER infeasible and renders MC simulation as the primary substitute for performance
evaluation. However, utilizing conventional MC for low BER estimation can in itself be a
prohibitive task due to long run times.
As an alternative,
Me
based IS techniques are frequently applied to significantly reducesimulation run time for a given estimator precision. This substantial reduction, however,
is normally accompanied by the difficulty of specifying an efficient IS scheme and the
cor-responding optimal parameter settings. For the diversity system considered in here, the
cumulative memory behavior of the adaptive receiver, the decision-directed phenomenon,
and the nonlinearity of the adaptive algorithm render analytical optimization techniques
[4, 5, 6] as ineffective. In addition, it is unclear if and how numerical optimization (large
deviations) techniques [7, 8, 9, 10] are applicable in this case.
The main contribution of this paper is to introduce a stochastic IS methodology for
the efficient simulation of systems characterized by diversity and adaptive receivers in the
presence of nonselective slow Rayleigh fading and AWGN.This IS stochastic gradient descent
(SGD) algorithm, which we first presented in
[11],
is utilized in here to determine thenear-optimal IS parameters that characterize the dominant fading process. The fading model
assumed in this paper obeys a first order Markovian process [1, 12, 13, 14]. Using a simple
illustrative example, we show that for this case, the IS simulation technique is mostly efficient
when the statistics of the fading model obey a modified Markov chain distribution [7,8, 15].
A fourth order diversity system was simulated at three different time instants and using
the corresponding optimal IS parameters. In addition, two signaling formats were considered,
speed-up factors of up to 6 orders of magnitude (over conventional Monte Carlo (MC)) were
attained for error probabilities as low as 10-11 .
2
System Description
Consider a carrier-modulated real-valued signal S(
t)
transmitted over L independent diver-sity channels, whereS(t)
=
Re
{t,
d(k)g(t - kT) exp(jwct)}
(1) where L~od(k)g(t- kT) is the complex lowpass envelope with d(k) being the kth datasymbol (real or complex), and
g(t)
being the impulse response of the transmit filter. We is the carrier frequency in rad/ sec. Each channel introduces a frequency nonselective and slowRayleigh fading in addition to AWGN. The equivalent lowpass and complex time-varying
impulse response of each channel is given by [16]
hi (r,t)
==
c;(t )t5(r ), i==
1, . . . ,L(2)
where for i
=
1, ... ,L, Ci(t) is a complex-valued Gaussian random process. The slow fadingprocess is assumed to be constant for the duration of one symbol period [1, 12,16]. Employing
this piecewise constant approximation for the fading process, the received signal over the ith
channel can be expressed as [1, 16]
Xi(t)
=
Re {
l~
ci(k)d(k)g(t - kT)
+
ni(t)] exp(jwct) } ,
i=
1, ... ,L
(3)
where [L~oci(k)d(k)g(t - kT)
+
ni(t)] represents the received complex lowpass envelope.The fading gain of the ith (1
:S
i ::;L)
fading channel ci(k) is a complex Gaussian random variable (CGRV) with E{Ci(k)} == 0 and E{lci(k)12}=
20"2. For ii=
i,
ci(k) and cj(k) areindependent processes. In this paper, the complex fading process ci(k)
==
3.i(k)+
jbi(k) hasan even Doppler power spectrum [17] which implies that {Ri(k)} and {bi(k)} are independent
Gaussian processes with a zero mean and an identical autocorrelation function R(l), where
The fading model assumed in this paper obeys a first order Markovian process [1, 12, 13, 14],
namely
(5)
The correlation parameter pis a measure of the rate of the fading channel fluctuations. This
parameter is primarily determined by the product of the symbol period T and the fading
bandwidth fd (i.e., the 3dB cutoff frequency of the Doppler power spectrum). In the case of
a first order Butterworth Doppler power spectrum
[18],
the correlation parameter is givenby
(6)
where for a slow Rayleigh fading channel, we have 0 < fdT
«
1. For example, a symbolrate of 50 KHz and a fading bandwidth of 10 Hz would correspond to p
=
0.9998. Otherexpressions for p can be found in [18] for several commonly encountered Doppler power
spectra.
The autocorrelation function in (5) yields the following state equation
(7)
where for i
=
1, . . .,L,{Wi(k)}
is a sequence ofiid zero-mean CGRV's with E{lwi(kW}=
2er
2(1-
p2), and for i =1= j,{wi(k)}
and{wj(k)}
are independent processes.The complex additive noise at the ith antenna is given by
ni(t),
where eachni(t)
is a complex AWGN process, withE{ni(t)}
=
0 andE{ni(t)niH(t
+
T)}
=
No5(T) (H
denotes the complex conjugate), withni(t)
andnj(t)
being independent processes for i =1= j.The received signal is demodulated by a local carrier exp(
-jwct),
match-filtered byg(T-t), and sampled every T seconds. Thus, the resulting ith output (input to the ithequalizer)
during the kth symbol period is given by
~(k)
=
ci(k)d(k)+
ni(k), i == 1, ... ,L(8)
In the above equation, it is assumed that the transmit filter is normalized (i.e.,
J{
Ig(t)\2dt
=1), therefore, E{lni(k)12 } =
No-
A block diagram of the the digital communication systemexp (-j We t )
exp(-j ~ct)
Update Algorithm
Update Algoritlun
"
d
Figure 1: A block diagram of a digital communication system with diversity and adaptive filtering in the presence of nonselective slow Rayleigh fading and AWGN.
A partially coherent reception technique was employed in
[1, 12]
using a decision-directedadaptive Kalman filter. This receiver assumes full knowledge of the statistics of the incoming
signal. In this paper, a decision-directed recursive least square [19, 20] adaptive receiver is utilized to compensate for the fading process on the ith diversity. this partially coherent
algorithm does not assume any prior knowledge of the statistics of the input signal, and is
therefore more practical to implement. Define the random data vector at instant k as
D(k)
=
[d(k),d(k-1), ... ,d(O)],the ith AWGN vector at the output of the receive matched-filter at instant k as
and the corresponding vector
N(k)
of the iid random vectors{Ni(k)}t:l
aswhere
and
and let C(k) be the corresponding vector of the iid random vectors {Ci (k )}~1' namely
C(k)
=
A(k)+
B(k)==
[C1(k),C2(k),... , CL(k)] (9)where A(k) and B(k) are defined in a fashion similar to C(k). In addition, define the received
random vector at instant k as
and the corresponding vector X(k) of the iid random vectors {X.,: (k)}f:l as
(10)
The output of the ith adaptive receiver for the kth transmitted symbol d(k) (k
2:
ko ) isgiven by [19, 21]
y.,:(k)
i=l, ... ,L(ll)
where ko is the number of symbols used to train the equalization algorithm (training
se-quence), and 5 is a small positive number. 0
<
A ::;1represents the forgetting factor of thealgorithm. The purpose of this factor is to weight the most recent symbols more heavily and
thus allow the equalizer to track time variations in the channel. The input to the decision
device is given by
L
y(k) LYi(k)
i=l
L
Lg(~(k))
=
G(X(k))i=l
At the end of the training period, a decision-directed adaptive algorithm is employed whereby
decisions made on the output sequence {y(
k)}
(i.e., {d(k)})
are used to replace the actual transmitted symbol sequence {d(k)}. This will effectively aid the adaptive receiver intrack-ing channel variations, but may increastrack-ingly hinder the tracktrack-ing capability with time due
error propagation. This error propagation effect will be demonstrated later on when
consid-ering a fourth order diversity example.
3
IS
Formulation
The adaptive system considered in the previous section clearly possesses a cumulative
mem-ory behavior as evident from
(11).
This behavior is quite common to all adaptive algorithms where the decision made at each time instant k utilizes a weighted version of all the past received samples up to time zero. In addition to this behavior, the decision-directedphe-nomenon, the strong correlation present in the input signal, and the non-linearity of the
adaptive algorithm make closed form analysis of the BER infeasible. As an alternative,
Me
simulation is commonly applied to estimate the BER performance.
Since the statistical distribution of the complex random vector X(k) is dependent on the
correlation parameter p and the power in the fading process 20"2, it would be appropriate to
denote its corresponding probability density function (pdf) as fX(k)(JY(k), 0), where
and
6-E>
=
[p , 0-]
fC(Ie) (C(k),8 )fN(k)(N( k))fD(k)(D( k))
fA(lc)(A( k),0 )fB(lc)(B(k),0 )fN(lc)(N(k) )fD(lc)(D(k))
(13)
(14)
For the fading model assumed in (5), the distribution of the ith independent random vectors
Ai(k) and Bi(k) are identical with the ith marginal pdf fA;(lc)(Ai(k), 0) being given by
Ie-I
(15)
1 {
a~(O)
}
(27l"u2)(k+1)/2(1 _ p2 )k/2exp - 2u2 x
ex {_
L:j:ci(ai(j
+
1) -pai(j))2}
p 2(1 _ p2)U2 , i
=
1,. · ·,LObserve that the notation fX(k)(JY(k),8) was only chosen to explicitly show the dependence
on (3 since for most practical cases and cases where IS is applicable (i.e., high signal to
noise ratio
(SNR)),
the slow Rayleigh fading process is the dominant factor. Therefore, weconsider biasing only the fading processes A(k)and B(k)leaving the AWGNrandom process
N( k)
unbiased. In addition, the parameter vectore
is related to the biasing scheme whichwe adopt and address in the next section.
Let the expectation with respect to the marginal pdf fX(k)(~y(k), e) be denoted as
Ek,e{.}.
The subscript k is used to emphasize the time-dependent nature of theexpec-tation. In addition, let I(G(X( k)) be equal to 1 when the detected symbol is in error and
zero otherwise, where G(X(k)) is given by
(12).
The probability of making a decision errorat some time instant kis given by the following instantaneous BER expression
(16)
where 10(k) is the indicator function of the set Q(k)
=
{X(k) : I(G(X(k)))=
1}.To apply IS, note that
(16)
can be written as(17)
whereEIc,eO(k){ .} denotes the expectation operator with respect to the IS pdffX(k)(X( k), e*( k))
with the time-dependent parameter vector
and
WX(k)
(X(
k),e,
e
* (k))e
* (k)=
[p
* (k) ,0"* (k)]=
WA(k)(A(k),e,
e*(k))WB(k)(B(k),e,
e*(k)) fA(Ic)(A(k),e)
fB(Ic)(B(k),e)
- fA(k)(A(k), e*(k)) fB(k)(B(k), e*(k))
(18)
Observe that the random vectors A(k) and B(k) are iid with
L
fA(k)(A(k),8) ==
II
fAi(k)(Ai(k),0)i=l
and
L
fA(k)(A(k), 8*(k)) ==
II
fAi(k)(Ai(k), E)*(k))i=l
Upon incorporating the preceding two equations into (19), we get
(20)
(21)
L
WX(k)(X(k),
e,
e*(k))=
II
WA.(k)(Ai(k),e,
e*(k))WB;(k)(Bi(k),e,
8*(k)) (22)i=l
where WAi ( k ) ( Ai(k),8,8*(k)) and WB i(k)(Bi(k),E),8*(k)) have an identical distribution,
with
w . (A·(k) 8 e*(k))
=
fA.(k)(Ai(k), e)A.(k) , , , f A.(k)( Ai( k), 8*( k))
A Me-based IS estimator of (17) is given by
A 1 Nx
p(k,e)
=
N
:L
I(G(X (k,i )))wX(k)(X (k,i ), 8 , 8 *(k))X i=l
(23)
(24)
It is straight forward to show that the estimator in
(24)
is an unbiased estimator of P( k,8)(i.e., Ek.e.Ck){F(k,
en
=
P(k,8)). The variance of the IS estimator in(24)
is givenV{F(k,8)} == V(k,8,8*(k))
- ;x
Vk,eOCk) {lnCk)wXCk)(X(k),8,e*(k))}(25)
where V : R2 X ~2 ~ [0,00), and VJc,e.(k){.} denotes the time-dependent variance
opera-tor with respect to the simulation pdf fX(Jc)(X(k),0*(k)). The empirical precision of the
estimator in (24) may be found by using the sample variance estimator
A A 1 Nx . * P2(k,8)
V{P(k,8)}
=
- 2:L
I(G(X (k,i )))w5CCk)(X (k,1. ), 8 , e (k)) - N (26)Nx i=l x
For a given relative precision ao > 0, the simulation is terminated when the condition
3.1
The IS Biasing
Scherne
Two important issues are worth addressing at this point. First, note that for i = 1, ... ,
L,
the in-phase and quadrature Gaussian processes Ai (k) and Bi (k) are identically modifiedaccording to the parameter vector e*(
k).
This is the case since Ai (k)
and Bi(k)
are equallyweighted in the real and imaginary parts ofYi(k) in (11). In addition, each of the random
processes {Ai
(k )}t:l
and{B
i(k )}f: l
must be equally biased as well since according to (12),the output
y(
k) is the sum of the equally weighted iid outputs {Yi( k)}f=l. This implies thatthe modification of the underlying density function fX(k)(X(k), e) is entirely governed by
the parameter vector 8*(k ).
Second, observe that altering the parameter vector 0 implies that the adopted IS
sim-ulation technique is performed under a modified Markov chain distribution [15, 8, 7]. At a
given time instant k, this technique effectively transforms the original unbiased
autocorrela-tion funcautocorrela-tion R(l) of (5) into
R*(l,k)
==
(T*2(k)p*lll(k), 0<
p*(k)<
1(27)
In the simple case of a memoryless nonlinearity followed by an integrate and dump receiver, and when the input samples have a Markov chain distribution, it was shown [7]
that the above simulation technique is more efficient than translating the mean
[4, 10]
orscaling the variance [5,6] of the iid random variables {wi(k)} in (7). The ineffectiveness of
the of the mean translation and variance scaling techniques is primarily attributed to the
fact that the random process X(k) has a zero mean and X(k)
==
0 E f2(k).This can be illustrated by Considering the system discussed in the previous section with
a first order diversity and binary signaling (d(k)
==
±1). Furthermore, consider the timeinstant k
=
1, and let the SNR==
00 (i.e., N1(1)==
0) along with the quadrature randoma1(l)
Figure 2: A contour plot of the original pdf,
fA
1(1)( A 1(1), 0 ) and the corresponding error region.A plot of the contours of
fA
1(1)( A 1(1),
0) and the error region (E1U
E2 ) for 0=
[0.99 , 1]
is shown in Fig. 2. The probability of error in this case is equal to P(1,0) = 4.51 X 10⁻² •
Note that as the value of p ---+- 1, the contours area over the region E1
U
E2 will graduallyvanish and as a result, P(l, 0) ---+
o.
This should be the case since it can be shown that1
[~1
-
p2]
P(1,0)=;tan-1 p
Clearly, limp--+l P(l,0)
=
o.
Even though translating the contours diagonally into E1 or E2 will increase the raw (i.e.,
unweighted) error count, the variance of the IS weight function over the entire error region
(E1
U
E2 ) will rather increase since the modified pdf can only concentrate its mass on eitherEl or E2 but not both. Uniform variance scaling (i.e., biasing (72 only) will, on the other
hand, proportionally scale the contours in all dimensions and the net increase in the raw error count will be zero. This conclusion can also be deduced from the fact that P(l,0), as
given above, is independent of a,
The difficulty encountered with the above two schemes can be surmounted by modifying
a1(1)
Figure 3: A contour plot of the modified pdf,
fA
1(1)( A 1(1),e~t(1)), e~t(1)
[0.4674 , 0.0211].realize a good IS biasing scheme, namely increasing the raw error count and evenly distribute
the weight function over the error region E1
U
E2•The IS variance (Eq. (25)) for this simple case can be attained in a closed form and
minimized to yield e~t(l). Instead, the search for e~t(1) was conducted stochastically
using the SGD algorithm, which we first presented in [11], with
e
being the starting point.The search yielded 8*(1) ~ 8~t(1)
=
[0.4674 , 0.0211], and a plot of the contours of themodified pdf is shown in Fig. 3.
4
Optimizing the IS Distribution
In
order to attain a significant reduction in the number of detector decisions Nx neededto estimate P(k,0) with a given accuracy, the optimal parameter setting 8~t(k) which
minimizes the variance in (25) must be determined. Since a closed form expression of (25) is
not available, analytical optimization techniques [4, 5, 6] are rendered ineffective. In addition,
as we illustrated earlier, having a zero mean random process
X(k)
andX(k)
=
0 En(k)
adaptive algorithm make it unclear how numerical optimization (large deviations) techniques
[10, 7, 8, 9, 10] can be modified to accommodate the current application.
As an alternative, the IS SGDalgorithm which we first presented in [11, 22] is utilized to
search for the optimal IS parameter vector 8~t(k)in a two dimensional space. Insummary,
the SGD algorithm is based on the fact that for any vector 8~t(k) to be a local or global
minimum of V(k, 8,0*(k)) in
(25),
the following equation must hold(28)
Thus, the search for the optimal IS setting is conducted by the SGD algorithm in a descending
fashion according to
0*(k,
n
+
1)
= 8*(k,n) - (3(n)\7
e·(k)V(k,0,8*(k))le·(k)=e·(k,n) (29)where
(3(
n)is the step size taken at the nth iteration, and V" e·(k)V( k,8,8*(k)) is an unbiasedestimate of the left-hand side of
(28).
It was shown[11],
that such an estimate can beconstructed using the following estimator
VeO(k)V(
e,
e*(k))=
~
I:
I(
G(X(k, i)))WX(k)(X(i, k),e,
e*(k)) XNx ;=1
\7eO(k)WX(k)(X(k, i),
e,
e*(k)) (30)In order to implement the above estimate, we need to compute the gradient of the IS weight
function.
* [8WX(k)(X(k),
e,
e*(k)) 8WX(k)(X(k),e,
e*(k))] (31)\7eO(k)WX(k)(X(k),
e,e
(k))=
8p*(k) , 8(j*(k)Introducing the following definitions will help simplify the expression of the above
gra-dient. Let for i
=
1, .. ·,L,
6. p*(k)(j*2(k)I:j~ci(ai(j
+
1) -
p*(k)ai(j))2R1(Ai(k), e*(k)) = (1 _ p*2(k))2(j*4(k)
(1 - p*2(k))(j*2(k)E;':~(ai(j
+
l)ai(j) - p*(k)ai(j)2)R2(Ai(k),8*(k))
~ L:j::~(ai(j
+
1) - p*(k)ai(j))2 (33)(1 - p*2(k))u*3(k))
with R1(Bi(k),e*(k)) and R2(Bi(k),e*(k)) being defined in a fashion similar to
(32)
and (33)respectively. After taking the derivative of both sides in
(22)
and utilizing the abovedefini-tions, it can be shown that
8WX(k)(X(k),8,8*(k))
8p*(k)
and
8WX(k)(X(k),0,e*(k))
80-*(k)
{
2L(k + l ) }
•
=
0"* (k) WX( k) (X (k),8, 8 (k))-L [(
al
(0)
+
b~(0))]
* ~ 0"*3 (k) WX( k) (X (k),8, 8(k))-L
L
[R2(Ai(k), 0·(k))+
R2(Bi(k), 8*(k))] xi=l
WX(k)(X(k),
e,
e*(k))(35)
Observe that during the nth iteration of the SGD algorithm in
(29),
the IS estimatorsof all the three quantities P(k,8), V{P(k,8)}, and "Ve.(k)V{ P (k, 8 )} are obtained by
sampling from the simulation pdf at the nth iteration, namely fX(k)(X(k),8*(k,n)). In
addition to yielding an optimal estimator of P(k,8) asn - 00, this approach will generally
provide suboptimal estimates of V{P(k,
e)}
and "Ve- V{p}, which are sufficiently accurateto successfully perform the SGn algorithm.
Let the SNR per diversity be defined as
E{ld(k)Ci(k)12
} E{ld(k)12} 20-2
I = E{ni(k)} = No i = 1, ...,L.
(36)
For a given diversity order 1 ::;i ::; L ,a SNR,and a time instant k
2:
ko , the SGn algorithmis applied for some value of 8 such that P(k,8) rv 10-2• this technique will help circumvent
(Nx ~ 1000) can be sufficient to accurately compute 'V'e.(k)V{p(k,8n!e.(k)=e.(k,l). The
optimal parameter vector e~t determined for a high P(k,8) is then used to choose a starting
point 8*(1) at higher values of P(k,8). This "extrapolation" technique was shown to be
very effective in a variety of practical digital communication and queing systems applications
[11,22] and for highly nonlinear systems with large dimensionality
[23].
with this techniqueapplied efficiently, the overhead (in number of decisions) involved in determining 8~t(k) will
be insignificant compared to the savings in number of decisions Nx needed to accurately
estimate a low P(k,8).
As an example, consider a second, and a fourth order diversity systems with BPSK
signaling and a per-diversity SNR of I
==
30 dB. The equalizer was trained using a fixedtraining sequence of 12 symbols and the BER was measured 10 symbols after training (i.e.,
P(22,8)). Due to the absence of intersymbol interference (lSI) and the symmetry of the
signal constellation about the origin, the probability of error is insensitive to the choice of
the data sequence after the training period. This effectively results in an optimal IS setting
that is sequence-independent, as was empirically verified. In each case, 8 was chosen to
attain a high P(22,8). Since the BER being considered is high, the improvement will not
be significant, and the optimal vector is identified by the convergence of the SGD algorithm.
The search for the near-optimal vector 8~t(22) was executed iteratively using the SGD
algorithm with
Nx
=
1000 decisions per estimate of 'V'e.(k)V{P(k,8n
per iteration. The step sizef3(
n) at the nth iteration was chosen according to~
(3(n)
== , .-IIV
{P( k,e)}!ee(k)=ee(k,n)II
(37)
On the nth iteration, this step size will result in a maximum incremental or decremental
change of .6. to the components of the parameter vector 8*(k,n). As observed in
[11,23],
selecting a small .6. will result in a slow convergence but a higher accuracy in locating the
optimal setting as opposed to a larger .6. that yields a faster convergence rate but may cause
some deviation from the the correct path of the gradient descent. Typical values of ~ may
Diversity (L) 0 0~t(22) P(22,0) Raw count
1 [0.992, 0.7071] [0.9637 , 0.3295] 4.34 X 10⁻² 17.3%
2 [0.98, 0.7071] [0.9602, 0.504] 2.78 X 10⁻² 8.75%
4 [0.96, 0.7071] [0.947, 0.6042] 1.19 X 10⁻² 2.7%
Table 1: The optimal IS parameters for k == 22. The signaling format is BPSK andI == 30dB.
0.5 :.~
/ \\R(I)
//~4
\\00\.
-50 -30 -10 10 30 50 0)
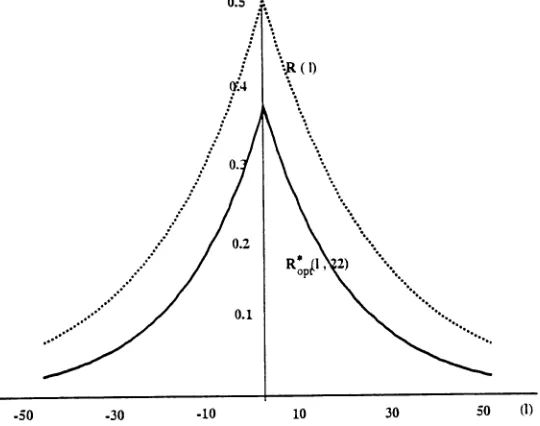
Figure 4: A plot of the original and optimal IS autocorrelation functions for BPSK. L
=
4,e
= [0.96 , 0.7071], and I = 30 dB.to p, and C= 4 X 10⁻⁵ • The results are shown in Table 1. e*(k) :::::: e~t(k,n). For each
case considered in Table 1, the optimal IS autocorrelation function R~t(l, k) yields a less
correlated fading signal, as compared to R(l), with a reduced mean power (i.e., less SNR).
This effectively translates into an increase in the Doppler frequency bandwidth (i.e., faster
fading) and a reduction in the energy of the fading power spectrum. A plot of the original
and modified autocorrelation functions for the case L
=
4 is shown in Fig. 4.Two important observations can be deduced from Table 1. First, the raw error count at
the optimal IS setting decreases as the diversity order increases. Moreover, it was
experi-mentally observed that the error count corresponding to the different diversities in Table 1
is roughly maintained at the same level for different values of p and k.
equation
(38)
where k
==
22. In fact, as our empirical results will show later, the above equation holdsfor other time instants as well, and its accuracy increases as the correlation parameter p
approaches unity. Clearly, the above equation can be exploited to transform a 2-D search
into a 1-D search, however, we only chose to utilize the above equation in identifying a good
starting point prior to conducting the SGD search.
Thus, for a given SNR, a correlation function R(1)
==
(1"2pili, a time instant k12:
ko ,and a diversity order L, the near-optimal parameter setting 8~t(k), or equivalently, the
near-optimal autocorrelation function R~t(l,k1 ) is determined as follows:
• Choose a p'
<
p and a <7'==
(J" such that P(k1 ,8') ~ 10-2•• U sing the IS SGD algorithm, determine the near-optimal setting for the system with
8'
==
[p' ,
<7'],
• Choose a starting point 8*(k1, 1) such that
(39)
where
(40)
• Perform a 2-dimensional search using the SGD algorithm to locate e~t(kl)
The optimal setting e~t(kl) can then be used as the starting point of the SGD algorithm
to locate the optimal parameters at a time instant k2
>
k1 , and so on.4.1
A Fourth Order Diversity Example
Consider a fourth order diversity system
(L
= 4). The simulation algorithm discussed in the previous section was applied to simulate the HER at the time instants, k1=
22, k2=
32,and k
k 0~t(k) P(k,0) V{F(k,0)}
Sp(k)
Raw Count 22 [0.9708, 0.0417] 1.894X 10 11 1.852 X 10⁻² 2 8.236 X 10⁷ 2.28%32 [0.9753, 0.0455] 4.567X 10 11 2.372 X 10⁻²¹ 1.53 X 10⁷ 2.9%
42 [0.9802, 0.0503] 1.621 X 10 10 2.135 X 10⁻¹⁹ 1.6X 10⁵
2.82%
Table 2: The optimalIS parameters and the corresponding estimated probabilities, variances, and speed-up factors. 0
=
[0.9999, 0.7071] andI=
30 dB, and the signaling format is BPSK.k 0~t(k) P(k,0) V{P(k,0)}
Sp(k)
Raw Count22 [0.9873, 0.0631] 2.74 X 10⁻⁹ 4.97 X 10⁻¹⁷ 1.82 X 10⁴ 2.96%
32 [0.9910, 0.0745] 5.64 X 10⁻⁹ 3.46 X 10⁻¹ 7 1.169 X 10⁵ 2.7% 42 [0.9921 , 0.0792] 1.725 X 10⁻⁸ 1.56 X10⁻¹⁵ 4.1X 10³ 3.11%
Table 3: The optimalIS parameters and the corresponding estimated probabilities, variances, and speed-up factors. 0 = [0.9999, 0.7071], I = 30 dB, and the signaling format is QPSK.
was always normalized to unity (E{lci(k
)1
2} = 1). The symbol rate was set to 50 KHz, the fading bandwidth fD was assumed to be 2.2 Hz which corresponds to p
=
.9999, and a SNRof I
=
30 dB was considered. In addition, two signaling formats were considered, BPSK andQPSK. In each case, the forgetting factor of the adaptive algorithm A was set equal to the
correlation parameter p and 5 = 4 X 10⁻⁵• The starting point for the first entry in Table 2 was 0*(22,1) = [.9476, .0313] which was determined using Table 1 and Eq. (40). In addition,
for the given 0, " and k, the near-optimal IS parameters determined for the BPSK case
were also used as a starting point for the QPSK case. In each case, the step size was chosen
according to (37) and the values of ~ ranged from 0.0003 to 0.001. Another interesting case
to consider is when /
=
00 since it represents the irreducible BER performance. This casewas simulated for QPSK and 0
=
[0.9999 , .7071], and the results are shown in Table 4.The estimates of the variance V{"p(k,0n and the instantaneous BER P(k,0) were
computed using an ensemble of NE
=
50 estimates of Nx=
1000 decisions per estimate.The time-dependent speed-up factor Sp(k), corresponding to V{..P(k, 0n and the estimator
in (24), was calculated according to
k 0~t(k) P(k,0)
V
{.P(k, 0)} Sp(k) Raw Count22 [0.9879 , 0.0635] 1.89 X 10 9 2.15 X 10⁻¹⁷ 3.17 X 10⁴ 1.17%
32 [0.9910, 0.0745] 3.82 X 10 9 2.31 X 10⁻¹⁷ 1.15 X 10⁻⁵ 1.56%
42 [0.9922, 0.0804] 1.3368 X 10 8 8.205X 10⁻¹⁶ 6.134 X 10³ 2.09%
Table 4: The optimalISparameters and the corresponding estimated probabilities, variances, and
speed-up factors. 0 = [0.9999, 0.7071], /
=
00, and the signaling format is QPSK.where NM C is the conventionallVIC number of decisions required to attain the same accuracy
as our IS scheme. NM C was computed based on a 95% confidence interval [24]. The overhead
(in number of decisions) was not included in the computations of the speed-up factor. The
reduction in speed-up factors due to overhead ranged from 1 to 2.5 orders of magnitude.
This reduction is clearly dependent on the choice of ~.
Several interesting observations can be made from the results In Tables 2, 3, and 4. First note the increase in P(k,0) as time (k) increases. This increase is due to the error
propagation effect of the decision-directed algorithm ( i.e., feeding back erroneous decisions
while updating the adaptive algorithm). As time increases, P( k,e) will also increase until it eventually reaches an intolerable rate, and transmitting a new training sequence would
become necessary to improve the adaptation algorithm. This signaling technique which
periodically interleaves training and data sequences is frequently used by adaptive algorithms
[2, 25]. Inaddition, observe that the increase in P( k,
e)
is also accompanied by a decrease inSp( k) as would have been expected. Any further decrease in Sp( k) might also be attributed
to an increase in the memory of the algorithm as k increases.
Another two important observations pertaining to the optimal IS setting e~t(k)are the
decrease in the bias as k increases, and how well
e:,
i
k ) satisfies Eq. (38). A plot of the optimal trajectory (p~t(k), O";"t(k)) in Table 2 vs. time is shown in Fig. 5.5
Conclusion
In this paper, we presented a stochastic IS methodology for the efficient simulation of
n'" 'k) t""opt(
0.982
0.98 k:= 42
0.978
0.976
k=32
0.974
0.972
k =22
0.05 0.052 0.042 0.044 0.046 0.048
0.97 '---~ 0.04
Using a first order Markovian model for the fading channel, the search for the optimaly
modified Markov distribution was accomplished by the robust SGD algorithm. Extending
this technique to accommodate adaptive algorithms other than the RLS algorithm is straight
forward. Speed-up factors of up to 6 orders of magnitude over conventional MC were achieved
for error probabilities as low as 10-11 after accounting for overhead of the SGD algorithm.
References
[1]
Pooi Yuen Kam. Adaptive Diversity Reception Over a Slow Nonseleetive FadingChan-nel. IEEE Trans. Commun., 35(5):572-574, May 1987.
[2] N. W. K. Lo, D. D. Falconer, and A. U. H. Sheikh. Adaptive Equalization and Diversity Combining for Mobile Radio Using Interpolated Channel Estimates. IEEE Trans. Veh.
Technol., 40(3):636-645, Aug. 1991.
[3] P. Balaban and J. Salz. Dual diversity Combining and Equalization in Digital Cellular
Mobile Radio. IEEE Trans. Veh. Technol., 40(2):342-354, May 1991.
[4] D. Lu and K. Yao. Improved Importance Sampling Technique for Efficient Simulation of Digital Communication Systems. IEEE J. Select. Areas Commun., 6(1), Jan. 1988.
[5] K.S. Shanmugan and P. Balaban. AModified Monte-Carlo Simulation Technique for the
Evaluation of Error Rate in Digital Communication Systems. IEEE Trans. Commun.,
COM-28(11):1916-1924, Nov. 1980.
[6]
B. R.
Davis. An Improved Importance Sampling Method for Digital CommunicationSystem Simulations. IEEE Trans. Commun., COM-34(7):715-719, Jul. 1986.
[7] R. K.
Bahr and J. A. Bucklew. Quick Simulation of Detector Error Probabilities in thePresence of Memory and Nonlinearity. IEEE Trans. on Commun., 41:1610-1617, Nov.
[8] J. A. Bucklew, P. Ney, and J. S. Sadowsky. Monte Carlo Simulation and Large
Devia-tions Theory for Uniformly Recurrent Markov Chains, J. App.I Pro.,b 27 44 59 M: - , are
1990.
[9]
J.
S. Sadowsky and J.A.
Bucklew. On Large Deviation Theory and AsymptoticallyEfficient Monte Carlo Estimation. IEEE Trans. Inform. Theory, IT-36(3):579-588, May
1990.
[10] J-C. Chen, D. Lu, J. S. Sadowsky, and K. Yao. On Importance Sampling in
Digi-tal Communications - Part I: Fundamentals. IEEE J. Select. Areas in Commun.,
11(3):289-299, Apr. 1993.
[11] W. AI-Qaq, M. Devetsikiotis, and J. K. Townsend. Simulation of Digital Communication
Systems Using a Stochastically Optimized Importance Sampling Technique. In Proc.
IEEE Global Telecom. Conf., GLOBECOM '93, Houston, Dec. 1993.
[12] P. Y. Kam. Optimal Detection of Digital Data Over the Nonselective Rayleigh Fading
Channel with Diversity Reception. IEEE Trans. Commun., 39(2):214-219, Feb. 1991.
[13] Pooi Yuen Kam. Optimal Detection of Digital Data Over the Nonselective Rayleigh
Fading Channel with Diversity Reception. IEEE Trans. Commun., 39(2):214-219, Feb.
1991.
[14] M. Stojanovic,
J.
G. Proakis, andJ.
Catipovic. Analysis of the Performance of aDecision Feedback Equalizer on Fading Multipath Channels in the Presence of Channel
Estimation Errors. In Proc. ofCISS, Chicago, June 1993.
[15] J. A. Bucklew. Large Deviation Techniques in Decision, Simulation, and Estimation.
New York: John Wiley & Sons, 1990.
[16] John
G.
Proakis. Digital Communications. New York: McGraw-Hill, 1989.[18]
Pooi Yuen Kam. Bit Error Probabilities of MDPSK Over the Nonselective RayleighFading Channel with Diversity Reception. IEEE Trans. Commun., 39(2):220-224, Feb.
1991.
[19] S. S. Haykin. Adaptive Filter Theory. Englewood Cliffs, New Jersey: Prentice-HaIl,
1986.
[20] E. Eleftheriou and D. D. Falconer. Tracking Properties and Steady-State Performance
of RLS Adaptive Filter Algorithms. IEEE Trans. Acoust., Speech, Signal Processing,
34(5):1097-1109, Oct. 1986.
[21]
John G. Proakis and Dimitris G. Manolakis. Digital Signal Processing. New York:Macmillan, 1988.
[22] M. Devetsikiotis, W. Al-Qaq, J. A. Freebersyser, and J. K. Townsend. Stochastic
Gra-dient Techniques for the Efficient Simulation of High-Speed Networks Using Importance
Sampling. In Proc, IEEE Global Telecom. Con!., GLOBECO!v1 '93, Houston, Dec. 1993.
[23] W. Al-Qaq and J. K. Townsend. AStochastic Importance Sampling Methodology for the Efficient Simulation of Digital Communication Systems with RLS Adaptive Equalizers.
To be presented at IEEE Int. Con]. Commun., ICC
'94.
[24] M. C. Jeruchim. Techniques for Estimating the Bit Error Rate in the Simulation of
Digital Communication Systems. IEEE J. Select. Areas Commun., SAC-2(1):153-170,
Jan. 1984.
[25] Pooi Yuen Kam and Cho Huak Teh. Reception of PSK Signals Over Fading Channels
Via Quadrature Amplitude Estimation. IEEE Trans. Commun., 31(8):1024-1027, Aug.