Copyright2001 by the Genetics Society of America
Nucleotide Polymorphism and Natural Selection at the Pantophysin (Pan
I)
Locus in the Atlantic Cod,
Gadus morhua
(L.)
Grant H. Pogson
Department of Ecology and Evolutionary Biology and Institute of Marine Sciences, University of California, Santa Cruz, California 95064
Manuscript received September 24, 1999 Accepted for publication September 25, 2000
ABSTRACT
Molecular studies of nucleotide sequence variation have rarely attempted to test hypotheses related to geographically varying patterns of natural selection. The present study tested the role of spatially varying selection in producing significant linkage disequilibrium and large differences in the frequencies of two common alleles at the pantophysin (PanI) locus among five populations of the Atlantic cod,Gadus morhua.
Nucleotide sequences of 124PanI alleles showed strong evidence for an unusual mix of balancing and directional selection but no evidence of stable geographically varying selection. The alleles were highly divergent at both the nucleotide level (differing on average by 19 mutations) and at amino acid level (each having experienced three amino acid substitutions since diverging from a common ancestral allele). All six amino acid substitutions occurred in a 56-residue intravesicular loop (IV1 domain) of the vesicle protein and each involved a radical change. An analysis of molecular variation revealed significant heteroge-neity in the frequencies of recently derived mutations segregating within both allelic classes, suggesting that two selective sweeps may be presently occurring among populations. The dynamic nature of thePan
I polymorphism inG. morhuaand clear departure from equilibrium conditions invalidate a simple model of spatially varying selection.
S
TUDIES examining nucleotide sequence variation across their geographic ranges, and the extent to which selection can produce local adaptation at the molecular in natural populations have provided importantin-level, particularly in opposition to ongoing gene flow, sights into the role of natural selection in shaping the
remains poorly understood. The majority of studies that patterns of polymorphism within species and the
pat-have examined spatial patterns of selection at the DNA terns of divergence between species (Hudson 1990;
level have focused on loci exhibiting clinal variation Kreitman 1991; Kreitman andAkashi 1995). When
(e.g.,BerryandKreitman1993;Karotamet al.1995; combined with genealogical information, data on the
KatzandHarrison1997;Schulteet al.1997). How-existing levels and distribution of nucleotide sequence
ever, only the detailed molecular dissection of theAdh variation among populations can provide unparalleled
cline inDrosophila melanogasterbyBerryandKreitman information on the past and present selective forces
(1993) explicitly tested the role of selection in main-that may be acting at a locus. Evidence accumulating
taining clinal variation in the frequencies of the fast/ from Drosophila has suggested that natural selection
slow polymorphic site by examining patterns of silent has played an important role in affecting the patterns
polymorphisms segregating within and between allelic of nucleotide variation at a substantial fraction of loci
groups. (Moriyama and Powell 1996; Hey 1999). However,
Unlike the situation for clines, localized selection fa-the inability to reject fa-the null hypofa-thesis of no selection
voring different alleles in different environments may (i.e., neutrality) is not uncommon (seeSchaefferand
produce heterogeneous patterns, and loci exhibiting Miller1992;KlimanandHey1993) and other factors,
unusually high levels of variation might indicate the most notably the extent of recombination, exert strong
possible action of selection (Cavalli-Sforza 1966). effects on the standing levels of nucleotide variation
One such locus has been identified in the Atlantic cod, (Begun and Aquadro 1992; Aquadro et al. 1994;
Gadus morhua (originally called GM798), that unlike Charlesworth1998).
other nuclear or mitochondrial markers exhibits sig-Few studies examining DNA sequence variation have
nificant differentiation among populations at large and attempted to test hypotheses related specifically to
geo-small geographic scales (Pogsonet al.1995;Fevolden graphically varying patterns of selection. Most species
andPogson1997;Jonsdottiret al.1999). This locus are unlikely to experience similar selection pressures
was also unusual in not showing a relationship between inferred levels of gene flow and geographic distance at large geographic scales (Pogson et al. 2001) and
Corresponding author:Grant H. Pogson, Department of Ecology and
in exhibiting nearly complete linkage disequilibrium Evolutionary Biology, Earth and Marine Sciences Bldg., University of
California, Santa Cruz, CA 95064. E-mail: [email protected] among three restriction site polymorphisms in the gene
region (Pogson and Fevolden 1998). The gene was originally identified as the cod synaptophysin (Syp I) locus by Fevolden and Pogson (1997) but is more likely to represent a recently discovered cellular isoform of synaptophysin called pantophysin (Haasset al.1996). Pantophysin is an integral membrane protein found in microvesicles of both neuroendocrine and nonneuro-endocrine tissues that function in a variety of shuttling,
secretory, and endocytotic recycling pathways (Haass Figure1.—Restriction map of thePanI gene region
show-et al. 1996;Windofferet al. 1999). Although the role ing the locations of polymorphic restriction sites. Exons are represented by solid boxes. The locations of theBstXI and of pantophysin in these pathways is poorly understood,
SacII sites used to cutPanIAIBheterozygotes prior to PCR and
its highly conserved structure of four transmembrane
the positions of primers used for sequencing are shown below domains, two intravesicular loops, and two cytoplasmic the coding region.
tails allows all mutations identified at the molecular level to be localized to distinct domains.
The objective of the present study was to determine populations are identical to those described inPogsonet al.
(1995). if geographically varying selection was acting at the
pan-Southern blot analyses: Three restriction site polymor-tophysin (PanI) locus ofG. morhua.To test this
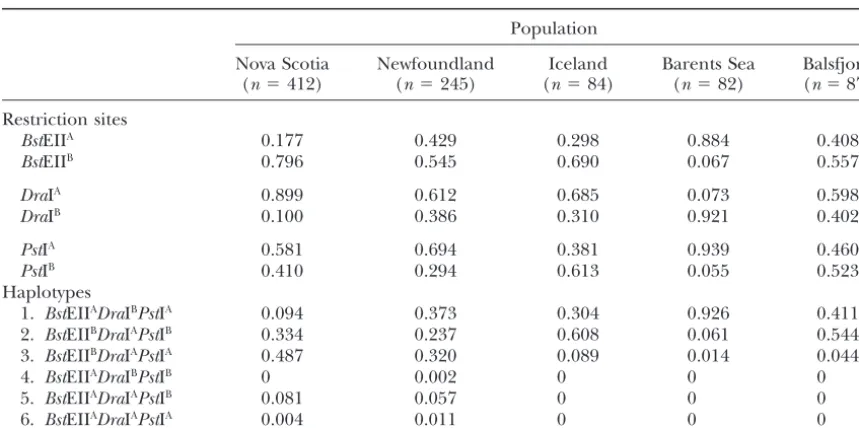
hypothe-phisms in the vicinity of the Pan I locus (BstEII, DraI, and sis, 124PanI alleles (1.85 kb in length) were sequenced PstI) were scored in 998 individuals on Southern blots as from five populations distributed throughout the north described inPogsonet al.(1995). A map of thePanI gene Atlantic region. The levels of nucleotide polymorphism region showing the locations of these polymorphic restriction sites is presented in Figure 1. The BstEIIB, DraIB, and PstIA
and spatial distribution of variable sites segregating
“alleles” refer to the presence of sites for each enzyme and within and amongPanI allelic classes were then
com-alternate alleles refer to their absence. Frequencies of the pared among the populations. Three predictions of the three polymorphic restriction sites and the resulting haplo-variable selection hypothesis were tested. First, to ac- types are listed in Table 1 and form the basis of the sampling
scheme outlined below. count for the geographically varying selection,
differ-PCR and DNA sequencing:The cDNA clone representing ences must exist between the two Pan I alleles at the
the PanI locus (GM798) was sequenced on an ABI Model nucleotide and/or amino acid levels. If a prolonged
373 automated DNA sequencer. The full-length sequence was period of selection has favored different Pan I alleles obtained from both strands using modified KS (5⬘-CGAGGTC in different regions then a genealogical signature of GACGGTATCGATAAG-3⬘) and SK primers (5⬘-TCTAGAACT AGTGGATCCCCCG-3⬘) that flanked theEcoRI cloning site and balancing selection may be present and statistical tests
two internal sequencing primers (B, 5⬘-TTGGTCCTCTAT should reject neutral expectations. Second, if the
selec-CTGGGCTTCG-3⬘; G, 5⬘-GTGCTACTATGCTTGTGGGGC-3⬘). tive regime has been stable over time and sufficient gene
Two PCR primers were then designed from the clone that flow is occurring among populations, no differences amplified a 1.94-kb fragment from genomic DNA (4, 5⬘ -should exist in the frequencies of neutral sites segregat- CTTCCATTCATCCGAGTTCTG-3⬘; 7, 5⬘-CGTAGCAGAAGA GTGACACAT-3⬘). PCR reactions were performed in 20m Tris-ing withinPanI allelic classes because these would be
HCl (pH 8.8 at 25⬚), 10 mmKCl, 10 mm(NH4)2SO4, 2.5 mm
invisible to selection (the “selective equivalence” test of
MgSO4, 0.1% Triton X-100, 100 ng/l bovine serum albumin,
Berry and Kreitman 1993). Third, greater peaks of 200meach dNTP, 0.25mforward and reverse primers, 0.4 diversity within the region(s) of thePanI locus experi- units ofTaq2000 DNA polymerase (Stratagene, La Jolla, CA), encing selection should be present between, rather than 0.4 unitsTaqextender PCR additive (Stratagene), and 100 ng template DNA in 10-l sealed glass capillary tubes in an Idaho within, populations (Charlesworth et al. 1997).
Al-Technology (Idaho Falls, ID) A1605 air thermal-cycler. After though the nucleotide sequence data provide strong
an initial denaturation step of 45 sec at 94⬚ the tubes were support for a long-lived polymorphism at thePanI locus, exposed to 35 cycles of denaturation at 94⬚for 1 sec, primer selection on recently derived mutations in both allelic annealing at 52⬚for 1 sec, and primer extension at 72⬚for 1 min and 40 sec followed by a hold at 72⬚ for 2 min. PCR classes appears responsible for the heterogeneity among
products were visualized on 1% agarose gels stained with ethid-populations thus invalidating a model of spatially
vary-ium bromide. ing selection.
The 1.94-kbPanI genomic fragment was sequenced from individuals known to be homozygous for the polymorphic
DraI restriction site located in the fourth intron of the gene (hereafter called thePanIAandPanIBalleles corresponding
MATERIALS AND METHODS
to the absence or presence of this site, respectively). Consensus Samples:Populations ofG. morhuawere sampled through- restriction maps were then constructed from 4–5 homozygotes out the North Atlantic region and random subsamples were for both alleles, and mutations that produced unique restric-taken from these larger groups for sequencing. Subsamples tion sites were identified. The presence of these sites allowed from the NW Atlantic were randomly chosen from two large individual alleles to be amplified for sequencing from known regional groups, Nova Scotia (NS) and Newfoundland (NF), Pan IAIB heterozygotes by digesting genomic DNA with the
as described inPogsonet al.(2001). Subsamples taken from appropriate restriction enzyme before PCR. To amplify the
PanIAallele, heterozygotes were digested withBstXI (cutting
TABLE 1
PanI restriction site and haplotype frequencies
Population
Nova Scotia Newfoundland Iceland Barents Sea Balsfjord (n⫽412) (n⫽245) (n⫽84) (n⫽82) (n⫽87)
Restriction sites
BstEIIA 0.177 0.429 0.298 0.884 0.408
BstEIIB 0.796 0.545 0.690 0.067 0.557
DraIA 0.899 0.612 0.685 0.073 0.598
DraIB 0.100 0.386 0.310 0.921 0.402
PstIA 0.581 0.694 0.381 0.939 0.460
PstIB 0.410 0.294 0.613 0.055 0.523
Haplotypes
1. BstEIIADraIBPstIA 0.094 0.373 0.304 0.926 0.411
2. BstEIIBDraIAPstIB 0.334 0.237 0.608 0.061 0.544
3. BstEIIBDraIAPstIA 0.487 0.320 0.089 0.014 0.044
4. BstEIIADraIBPstIB 0 0.002 0 0 0
5. BstEIIADraIAPstIB 0.081 0.057 0 0 0
6. BstEIIADraIAPstIA 0.004 0.011 0 0 0
thePanIBallele at nucleotide position 646) prior to PCR. To Tajima’s (1989) andFuandLi’s (1993) tests of neutrality, I
followed the approach ofHudsonet al.(1994) and assembled amplify thePanIBallele, digestions were performed withSacII
(cutting thePanIAallele at position 909) prior to PCR. Thirty- 50 constructed random samples (CRSs) from each population.
These were made by randomly subsamplingPanIAandPan
five cycles of PCR usingBstXI-digested DNA as template and
the two flanking PCR primers (4 and 7) resulted in the ampli- IBalleles from each population in proportion to their known
frequencies. The CRS sizes were identical to the total number fication of thePanIAallele whereasSacII-digested DNA allowed
preferential amplification of the Pan IB allele. To test the of Pan I alleles sequenced per population (24 or 26). The
CRSs generated from each population were pooled to create veracity of this methodPanIAandPanIBalleles were amplified
and sequenced in duplicate from two heterozygotes at two 50 “global” constructed random samples that would have been representative of sampling across the entire species range. different dates. No differences among replicate sequences
were detected. Heterogeneity of Pan I allele and haplotype frequencies among populations were tested usingFSTestimates obtained
Templates for sequencing were gel purified from 0.4%
aga-rose gels and spun through spin columns containing 0.8 ml from BIOSYS-1 (SwoffordandSelander1989). An analysis of molecular variation (AMOVA) was used to test for differ-of Sephadex G-50. Complete sequences differ-of both DNA strands
were obtained from eight sequencing reactions per template. ences in the patterns of nucleotide polymorphism segregating within thePanIAandPanIBallelic classes between populations
In addition to the two flanking primers, three additional
for-ward (11, 5⬘-GCTGGATTTCCCGATGTTGATA-3⬘; 3, 5⬘-CGTT (Excoffieret al. 1992). PhiSTstatistics were estimated from p-distances amongPanIAandPanIBhaplotypes obtained from
GGTCCTCTATCTGGGCTTC-3⬘; 23, 5⬘-GTTTCTCTGCAAGG
ATCTGTTTG-3⬘) and reverse primers were used in sequencing MEGA ver. 1.01 (Kumaret al.1993) and were tested for sig-nificance by performing 5000 permutations of the null distri-(33, 5⬘-TCACAAATAGATCCTTGCAGAG-3⬘; 1, 5⬘-CGAAGAGT
GGTTGCCAATAAGG-3⬘; 9, 5⬘-GCTGCATCAACCTAAAGTAG butions of each variance component. Composite measures of linkage disequilibrium among restriction sites in thePan I GAG-3⬘). Sequences were edited with SequenceNavigator,
compiled into consensus sequences using AutoAssembler gene region were obtained using the LD86.FOR program of Weir (1990). D values were tested for significance by chi-(both programs from Applied Biosystems, Foster City, CA),
and aligned by eye. Nucleotide sequences have been deposited square tests and standardized toD⬘values to allow comparisons among populations differing in allele frequencies. Mantel in GenBank under accession nos. AF288943–AF288977.
Statistical analyses:Samples ofPanIAandPanIBalleles were tests were done using the ISOLDE subprogram of GENEPOP
ver. 1.2 (RaymondandRousset1995). obtained from five populations of G. morhua by randomly
selecting 12 or 13PanIAIBheterozygotes previously identified Phylogenetic analyses ofPanI alleles were performed using
the neighbor-joining algorithm of Saitou and Nei (1987) from Southerns. For thePanIBalleles this involved sampling
only one haplotype (numbered 1 in Table 1). BecausePanIA implemented by MEGA and by maximum parsimony using
PAUP ver. 3.1 (Swofford1993). Both trees were rooted using alleles were distributed among three haplotypes (numbered
2, 3, and 5 in Table 1) samples of this allele were randomly the Greenland cod,Gadus ogac, as an outgroup. Estimates of nucleotide polymorphism (bothand) present withinPan
selected from each population to ensure accurate
representa-tion of these haplotypes. Although this sampling protocol I alleles and in the CRSs were obtained using DnaSP ver. 2.2 (RozasandRozas1997). The DnaSP program was also used allows for statistical tests amongPanI allelic classes it is
inap-propriate for tests of neutrality that assume a random sampling to perform Tajima’s (1989) andFu andLi’s (1993) tests of neutrality (the latter usingG. ogacas the outgroup sequence). of alleles. It also may not provide accurate estimates of
nucleo-tide polymorphism in different populations because allele fre- An intraspecificMcDonald andKreitman (1991) test also was performed using DnaSP treating the twoPanI alleles as quencies are extremely variable. To allow for comparisons
Figure2.—Deduced amino acid structure of cod pantophy-sin (PanI) aligned with mouse and human pantophysin and synaptophysin (Syp I) se-quences. The complete 3⬘ cyto-plasmic tails of the mouse and human synaptophysins are not presented. Solid lines indicate positions of the four mem-brane-spanning domains (la-beled M1–M4) and the dotted lines show the positions of the two intravesicular loops (IV1 and IV2) and the cytoplasmic tail (CYT2).
RESULTS (Haasset al.1996). Both physins belong to a growing family of integral membrane proteins found in synaptic or cytoplasmic vesicles that are characterized by four
Amino acid sequence and structure of cod
pantophy-sin:cDNA clone GM798 had an open reading frame of membrane-spanning domains, two intravesicular loops, and two cytoplasmic tails (Fernandez-Chacon and 222 amino acids and a 186-bp translated but
untran-scribed 3⬘tail. The gene was originally identified as the Su¨ dhof 1999). Figure 2 presents the deduced amino acid structure of the cod physin aligned with pantophy-cod synaptophysin (SypI) locus (FevoldenandPogson
1997) but may represent the cod homologue of a re- sin sequences from mouse and human (both from Haasset al.1996) and the closely related synaptophysin cently discovered Syp I isoform called pantophysin
TABLE 2
Linkage disequilibrium in thePanI gene region
Population
Nova Barents
Restriction Scotia Newfoundland Iceland Sea Balsfjord sites Statistic (n⫽412) (n⫽245) (n⫽84) (n⫽82) (n⫽87)
PstIA-BstEIIB D 0.0096 0.0680*** 0.1821*** 0.0479*** 0.2066***
SE 0.0061 0.0121 0.0144 0.0161 0.0111
D⬘ 0.129 0.524 0.989 0.935 0.919
PstIA-DraIB D ⫺0.0406*** ⫺0.1105*** ⫺0.1787*** ⫺0.0476*** ⫺0.2064***
SE 0.0040 0.0076 0.0146 0.0160 0.0108
D⬘ 0.991 0.973 0.933 0.934 0.970
BstEIIB-DraIB D ⫺0.0924*** ⫺0.2021*** ⫺0.2010*** ⫺0.0612*** ⫺0.2307***
SE 0.0082 0.0070 0.0140 0.0169 0.0087
D⬘ 0.989 0.939 0.978 0.983 0.998
Figure3.—Nucleotide polymorphism at thePanI locus ofG. morhua.Sequences are presented for the 34 uniqueG. morhua
haplotypes and for the outgroup,G. ogac.Base positions of each variable site and the locations of introns (labeled I2–I5) and exons (labeled E3–E6) are indicated at the top of the figure. Four insertion/deletion mutations identified in the second intron are also shown:䉮1, a single CA insertion;䉮2, a 12-bp deletion of GCATAGTAAAAA;䉮3, a 6-bp insertion of TGTTTT;䉮4, a 6-bp insertion of TTTTTT. Amino acid replacement mutations have been underlined. BF, Balsfjord; BS, Barents Sea; IC, Iceland; NF, Newfoundland; NS, Nova Scotia.
sequences from both species (fromSu¨ dhofet al.1987 two mammalian proteins, it is more likely to be panto-physin on the basis of (i) its truncated carboxy terminus andGaitanouet al.1997, respectively). Excluding the
27 amino acids missing from the amino terminus of the (22 amino acids in length), which is lacking the charac-teristic proline- and tyrosine-repeating motifs present cod clone, amino acid identities between theG. morhua
protein and pantophysin from mouse (49.8%) and hu- in all synaptophysins characterized to date and (ii) its isolation from liver tissue where synaptophysin expres-man (50.5%) are only marginally higher than between
the synaptophysins from both species (46.1 and 48.1%, sion is expected to be absent (except in nerve fibers).
Linkage disequilibrium inPanI gene region:Table 2 respectively). Identities are highest in the four
mem-brane-spanning domains (labeled M1–M4) and the presents estimates of linkage disequilibrium between three polymorphic restriction sites that span a 5.7-kb charged residues that flank these regions as noted in
previous studies (Johnston et al. 1989; Cowan et al. region of thePanI gene region (see Figure 1). Highly significant disequilibrium was detected between all pairs 1990). The two intravesicular loops of the protein
(called IV1 and IV2) and the short 3⬘ cytoplasmic tail of sites in all populations with the exception of the flanking BstEIIB and PstIA sites in Nova Scotia. This
were highly diverged and difficult to align. Although
haplo-TABLE 3
Nucleotide polymorphism inPanIAandPanIBalleles from different populations
PanIAalleles PanIBalleles
Population n S k n S k
Nova Scotia 13 7 1.67 0.00090 0.00122 13 6 1.64 0.00089 0.00105 Newfoundland 13 6 1.69 0.00091 0.00104 13 4 1.56 0.00085 0.00070 Iceland 12 9 2.18 0.00118 0.00161 12 2 0.33 0.00018 0.00036 Balsfjord 12 9 2.02 0.00109 0.00161 12 1 0.30 0.00016 0.00018 Barents Sea 12 10 2.71 0.00147 0.00179 12 3 0.50 0.00027 0.00054
Pooled 62 26 2.26 0.00122 0.00299 62 11 1.02 0.00055 0.00127
S is the number of segregating sites, kis the average number of nucleotide differences, is nucleotide diversity, andis theta per site.
types to predominate in most populations (numbered absence of a 12-bp deletion at position 236 in the second intron.
1 and 2 in Table 1). Dvalues were consistent in sign
across all populations and the standardized coefficients A total of 52 polymorphic nucleotide sites were identi-fied in the total sample. Twenty-six segregating sites approached their maximum theoretical limits
every-where except the two NW Atlantic populations. In Nova (and one insertion) were detected in the sample ofPan IAalleles distributed among 25 haplotypes. In contrast,
Scotia, this was caused by the high frequency of one
haplotype (numbered 3) formed by a recombination only 11 segregating sites (and one deletion) were found in the samplePanIBalleles represented among 9
haplo-event between the DraIA and PstIA sites that had the
effect of uncoupling the two flanking sites. In New- types. In the pooled sample thePanIAalleles exhibited
levels of nucleotide diversity () andthat were more foundland, this recombinant haplotype was less
fre-quent and the disequilibrium between the two flanking than twice that observed for thePanIBalleles (Table 3).
Levels of nucleotide polymorphism varied considerably restriction sites was diminished but still significant.
Nucleotide polymorphism: A total of 62 Pan IA and among populations from the NW and NE Atlantic. For
the Pan IA alleles variability was lowest in Nova Scotia
62 Pan IB alleles were sequenced from five different
populations ofG. morhua.The gene region sequenced and Newfoundland and highest in the three NE Atlantic populations. ThePanIBalleles exhibited extremely low
contained four exons (208 amino acids) and four
in-trons whose locations were identical to those described levels of polymorphism in the NE Atlantic but ap-proached the levels of variability shown by thePan IA
in mammalian pantophysin and synaptophysin genes
byHaasset al.(1996). Polymorphic sites are presented alleles in the NW Atlantic. A negative relationship was seen between the levels of nucleotide diversity and the in Figure 3 (along with sequence from the outgroupG.
ogac) and the levels of nucleotide polymorphism present population frequency of bothPanIAalleles (r⫽ ⫺0.873, P⫽ 0.053) andPanIBalleles (r⫽ ⫺0.511,P⫽ 0.379)
within thePanIAandPanIBalleles in different
popula-tions are summarized in Table 3. AllPanIAalleles were but neither correlation was significant.
In contrast to the minimal variation present within 1851 bp in length with the exception of one allele
(BA140-A), which contained three rather than two cop- thePanIAandPanIBallelic groups, 15 nucleotide
muta-tions and a 6-bp insertion were fixed between the two ies of a CA repeat. ThePanIBalleles were either 1845
or 1857 bp in length depending on the presence or alleles (Figure 3). The average number of nucleotide
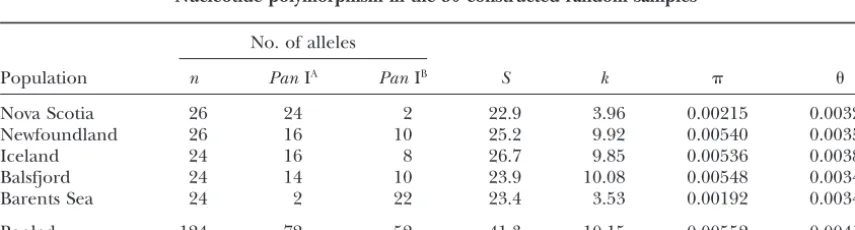
TABLE 4
Nucleotide polymorphism in the 50 constructed random samples
No. of alleles
Population n PanIA PanIB S k
Nova Scotia 26 24 2 22.9 3.96 0.00215 0.00326
Newfoundland 26 16 10 25.2 9.92 0.00540 0.00359
Iceland 24 16 8 26.7 9.85 0.00536 0.00389
Balsfjord 24 14 10 23.9 10.08 0.00548 0.00348
Barents Sea 24 2 22 23.4 3.53 0.00192 0.00341
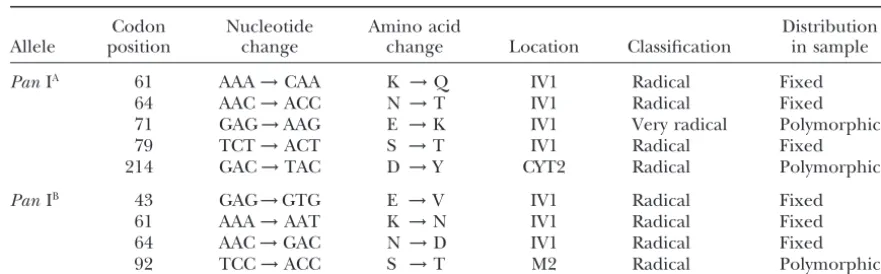
TABLE 5
Amino acid replacement mutations
Codon Nucleotide Amino acid Distribution
Allele position change change Location Classification in sample
PanIA 61 AAA→CAA K →Q IV1 Radical Fixed
64 AAC→ACC N →T IV1 Radical Fixed
71 GAG→AAG E →K IV1 Very radical Polymorphic
79 TCT→ACT S →T IV1 Radical Fixed
214 GAC→TAC D →Y CYT2 Radical Polymorphic
PanIB 43 GAG→GTG E →V IV1 Radical Fixed
61 AAA→AAT K →N IV1 Radical Fixed
64 AAC→GAC N →D IV1 Radical Fixed
92 TCC→ACC S →T M2 Radical Polymorphic
Classification of amino acid changes is based onTaylor(1986).
IV1, first intravesicular domain; CYT2, carboxy-terminus cytoplasmic domain; M2, second transmembrane domain.
differences between any two randomly sampledPanIA the 19 haplotypes previously identified as recombinants
between theDraIAandPstIAsites (haplotype 3 in Table
andPanIBalleles (19.0) far exceeded that found within
either allelic group (2.3 and 1.0, respectively). Because 1) that were chosen for sequencing. It was also found in 3 of the 5 nonrecombinantPanIAhaplotypes
(haplo-the majority of (haplo-the variation was present between ra(haplo-ther
than within allelic classes, nucleotide diversity levels type 2 in Table 1) sampled from Nova Scotia but not in the same haplotype sampled from any other population. were strongly affected by the differences in allele
fre-quencies among populations shown in Table 1. Esti- The distribution of polymorphism across the Pan I gene region was examined by the sliding window ap-mates of nucleotide polymorphism in the five
popula-tions are presented in Table 4 from 50 constructed proach of Kreitman andHudson(1991). Nucleotide diversity exhibited little heterogeneity across the panto-random samples that reflected a priori known
differ-ences inPan I allele frequencies. Nucleotide diversity physin gene region when the PanIA andPanIB alleles
were analyzed separately (Figure 4). However, when was highest in the three populations with intermediate
frequencies of both alleles (Newfoundland, Iceland, both alleles were included in the analysis two peaks of polymorphism were identified. The first peak corre-and Balsfjord) corre-and fell sharply in populations with high
frequencies of either Pan IA (Nova Scotia) or Pan IB sponded to a 30-bp region in the second intron
(posi-tions 236 to 265) that was capable of forming a stem-(Barents Sea). In contrast, was relatively invariant
among populations because the number of segregating loop structure inPanIAalleles but had been disrupted
by two insertion/deletion events inPan IB alleles (see
sites was largely determined by the presence of both
alleles. Figure 3). The second peak of polymorphism occurred
in the region of the IV1 domain of the protein in the One-quarter of the polymorphisms detected in the
study (13) fell within coding DNA and nine involved fourth exon that was segregating for six amino acid replacement mutations (positions 745 to 799 in Figure amino acid replacements (Table 5). Six of the nine
replacement mutations were fixed between the twoPan 3). When only silent positions were included in the sliding window analysis, the latter peak of polymorphism I alleles (three within each allelic lineage) and all
oc-curred within the first intravesicular (IV1) domain of disappeared (not shown).
Phylogenetic analyses: Genealogies of Pan I alleles the protein. Two codon positions (61 and 64) had each
experienced two mutations so that at the protein level were reconstructed by maximum parsimony and neigh-bor-joining approaches. A total of 32 parsimony-infor-the twoPanI alleles differed by four amino acids. Based
on the classification scheme ofTaylor(1986) all nine mative sites that produced a single most parsimonious tree of 74 steps with a consistency index of 0.987 were amino acid replacement mutations were radical changes
(six involving charged residues). Three replacement identified. The parsimony and neighbor-joining (NJ) trees were identical except for the position of a small mutations were also detected segregating withinPanIA
andPanIBallelic groups. Two were singletons found in subclade ofPanIAalleles (not shown) and the NJ tree
is presented in Figure 5. ThePanIA andPanIB alleles
Norwegian waters (positions 92 and 214). However, the
third mutation involved a very radical change (aspartic formed two highly distinct clades of closely related se-quences each having 100% bootstrap support. ThePan acid to lysine) in the IV1 domain of the protein and
was detected in 22 of the 62PanIA alleles sequenced. IB clade was dominated by a group of 52 alleles that
PanI locus exhibit highly significant differences among populations ofG. morhua(Pogsonet al.1995).FSTvalues
estimated for the BstEII, DraI, and PstI site polymor-phisms in the five populations included in the present study are 0.229, 0.300, and 0.157, respectively. IfPanI haplotypes are considered instead of individual restric-tion sitesFSTis 0.229. AllFSTvalues are highly significant
(P⬍0.001). To examine whether heterogeneity existed among PanIA andPan IB allelic classes from different
populations, an AMOVA was performed using p -dis-tances estimated among haplotypes. Table 6 shows that significant differentiation was observed among popula-tions for the variable sites identified withinPanIAand PanIBallelic classes even though Phi
STwas low for both
groups (0.119 and 0.152, respectively). This heterogene-ity was caused by differences in the frequencies of the PanIA⬘and䉮2PanIBalleles described in the previous
section.
Unlike the majority of nuclear restriction fragment length polymorphism (RFLP) loci examined inG. mor-Figure4.—Sliding window analysis of nucleotide
polymor-hua, the individual restriction site polymorphisms phism across the PanI gene region. Insertion/deletions in
scored in thePanI gene region do not exhibit relation-the second intron have been included as single mutational
events. Analyses are presented for the 62PanIAalleles (dashed ships between gene flow and geographic distance over
line), the 62PanIBalleles (dotted line), and the complete
the North Atlantic region (Pogson et al. 2001). The data set (solid line). The window size was 75 bp and the step slope of the regression of log (gene flow)vs. log (geo-size was 20 bp. The positions of introns and exons (labeled
graphic distance) for thePanI locus was positive, sug-E3–E6) are shown at the top of the figure.
gesting that populations sampled at greater geographic distances are genetically more similar than populations sampled at shorter geographic distances. However, this alleles that were restricted to the NW Atlantic region.
conclusion derived from analyses performed on the fre-The former group (hereafter called䉮2PanIB alleles)
quencies of single restriction sites among populations, was characterized by a 12-bp deletion in the second
not the relatedness of the alleles themselves. To exam-intron (position 236 in Figure 3) and two mutations in
ine whether allelic similarity was related to geographic the fifth intron (positions 1580 and 1650 in Figure 3).
distance, the average number of nucleotide substitu-The ancestral subclade of 10PanIBalleles from the NW
tions per site (dXY) between Pan IA and Pan IB alleles
Atlantic were identical to allPanIAalleles at these two
sampled from different populations was regressed positions. The clade of PanIA alleles was considerably
against the distance separating the populations. Strong more variable and possessed several subclades that
ex-positive correlations between (dXY) and distance were
hibited limited geographic distribution. The most
present for bothPanIA(r⫽0.629,P⫽0.047) andPan
widely distributed subgroup was represented by thePan
IB alleles (r⫽ 0.573;P⫽0.066) although Mantel tests
IA⬘ alleles characterized by the aspartic acid to lysine
indicated that the relationship was significant only for mutation in the IV1 domain. This mutation occurred
the former. The positive relationships observed between at high frequencies in the NW Atlantic (0.687 in Nova
allelic similarity and geographic distance for bothPan Scotia and 0.320 in Newfoundland) but was rare in the
I alleles considered individually contrasts with the pat-NE Atlantic. Figure 5 also shows that thePanIBalleles
terns exhibited by their population frequencies. have experienced a faster rate of evolution than thePan
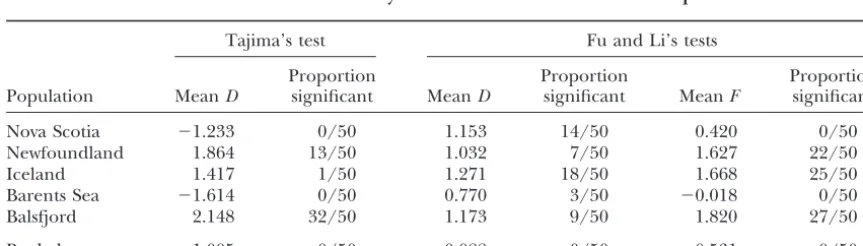
Tests of neutrality: Results of Tajima’s and Fu and IA alleles. The genealogy underestimates the changes
Li’s tests for neutrality on the 50 constructed random that have occurred in the lineage of PanIBalleles
be-samples are presented in Table 7. Tajima’s D statistic cause it does not include the insertions/deletions shown
was negative in Nova Scotia and the Barents Sea (indicat-in Figure 3.
ing an excess of low-frequency sites) but was not
signifi-Differentiation among populations:The frequencies
of the three restriction sites scored in the vicinity of the cant in 100 individual tests. Positive values of Tajima’sD
Figure5.—Neighbor-joining tree of 124PanI alleles. Numbers indicate the percentages of 100 bootstrap replicates supporting a specific clade. Bootstrap values below 60% are not shown. Clades corresponding to thePanIA⬘and䉮2PanIBalleles are marked.
TABLE 6 the highly significant linkage disequilibrium present among three restriction site polymorphisms spanning AMOVA results
the gene region (Table 2). Examination of nucleotide sequences of 124PanI alleles sampled from five popula-Observed
Allele Variance component variancea Phi
ST P tions of G. morhua has provided compelling evidence
that this locus is indeed experiencing strong natural PanIA Among populations 0.07420 0.119 0.002
selection. ThePanIAandPanIBalleles are highly
differ-Within populations 0.54812
entiated at both the nucleotide level (differing on aver-PanIB Among populations 0.04264 0.152 0.012
age by 19 mutations) and the protein level (each having Within populations 0.23874
undergone three amino acid substitutions since
diverg-aValues⫻103.
ing from a common ancestral allele). All 6 replacement mutations cluster in the 56-amino-acid IV1 domain of the protein and each involves a radical substitution (Ta-were found in the other populations but only Balsfjord
ble 5). Recently derived mutations are also detected produced a substantial number of significant test
statis-segregating with Pan IA andPan IB allelic groups that
tics (all 50 tests yieldingP⬍0.10 of which 32 were less
exhibit significant heterogeneity among populations. than 0.05). Highly variable results were also observed
Both mutations occur in regions of the gene exhibiting for Fu and Li’s D and F statistics. Some populations
peaks of divergence between alleles, suggesting that his-produced significant values forDbut not F(Nova
Sco-torical and contemporary forms of selection acting at tia) and forFbut notD(Balsfjord). The Iceland
popula-this locus are equivalent. The linkage disequilibrium tion produced a moderate number of positive tests for
and heterogeneity among populations thus do not ap-both statistics. Surprisingly, no significant test results
pear to result from stable spatially varying selection but were found in the 50 constructed random samples
from the recent appearance and spread of selectively pooled from all five populations despite the fact that
favored mutations in both allelic groups in different these samples were five times larger than the single
geographic areas. population CRSs. Although the statistical meaning of
There are two explanations for the large number of these tests is unclear, the negative results obtained for
fixed differences detected between the two common the pooled CRS of 124 alleles was unexpected given the
PanI alleles. One possibility is that thePanI locus has strong signal of selection in the data. An intraspecific
experienced a prolonged period of balancing selection McDonald and Kreitman test did, however, produce a
during which time recombination has played a minimal significant result (Table 8) due to the proportion of
role in confounding the evolutionary histories of the fixed replacement differences between Pan I alleles
two alleles. The other explanation is that the two alleles (66.7%) being much higher than that of fixed silent
have spent most of their evolutionary histories in geo-differences (21.4%).
graphical isolation and have only recently been mixed together in extant populations. This “historical isola-DISCUSSION
tion” hypothesis can account for (i) the high divergence between alleles (i.e., strong directional selection fa-Spatial patterns of variation have commonly been
voring different mutations in different regions) and (ii) used to identify genetic loci responding to some form of
the strong linkage disequilibrium in the Pan I gene natural selection. In the present study, the pantophysin
region (i.e., recombination has yet to break apart the (Pan I) locus of G. morhua was chosen for molecular
historical associations). Although intuitively appealing, characterization because of its exceptionally high
differ-entiation among populations (Pogsonet al.1995) and the historical isolation hypothesis makes two predictions
TABLE 7
Results of tests of neutrality on the 50 constructed random samples
Tajima’s test Fu and Li’s tests
Proportion Proportion Proportion
Population MeanD significant MeanD significant MeanF significant
Nova Scotia ⫺1.233 0/50 1.153 14/50 0.420 0/50
Newfoundland 1.864 13/50 1.032 7/50 1.627 22/50
Iceland 1.417 1/50 1.271 18/50 1.668 25/50
Barents Sea ⫺1.614 0/50 0.770 3/50 ⫺0.018 0/50
Balsfjord 2.148 32/50 1.173 9/50 1.820 27/50
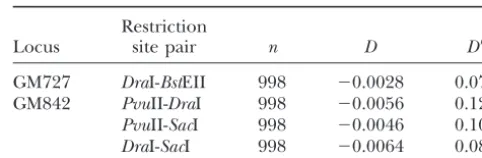
TABLE 9 TABLE 8
McDonald and Kreitman test Linkage disequilibrium in the GM842 and GM727 gene regions
Replacement Silent
Restriction
Fixed between alleles 6 9 Locus site pair n D D⬘
Polymorphic within alleles 3 33
Gtest with William’s correction⫽6.23,P⬍0.0125 GM727 DraI-BstEII 998 ⫺0.0028 0.072 GM842 PvuII-DraI 998 ⫺0.0056 0.129
PvuII-SacI 998 ⫺0.0046 0.107
DraI-SacI 998 ⫺0.0064 0.081 that are not supported by the available data. First, it
predicts that linkage disequilibrium should be common throughout the genome ofG. morhua because all loci
in Nova Scotia ( ⫽ 0.00089) but are present at a fre-would have experienced similar histories of isolation.
quency of only 0.100. These patterns are consistent with This prediction can be tested by examining linkage
dis-recent increases in the frequencies of selectively favored equilibrium in the vicinity of two other nuclear loci
alleles at the expense of previously common alleles that (GM727 and GM842) scored for multiple restriction
had accumulated some silent polymorphism. Although site polymorphisms by Pogson et al. (1995). Table 9
this scenario hardly guarantees a stable balanced poly-shows that no detectable linkage disequilibrium exists
morphism, it suggests that evolutionary change can oc-at either RFLP locus. The historical hypothesis also
pre-cur rapidly within both allelic groups without the need dicts that RFLP alleles at loci other thanPanI should
for geographic isolation. exhibit differentiation at the nucleotide level (albeit at
A usual combination of balancing and directional reduced levels) even if recombination has broken apart
selection is suggested from the genealogy of the two associations assessed at larger distances. Preliminary
se-Pan I alleles shown in Figure 5. These two forms of quence data collected for a 960-bp region of the G.
selection are known to exert opposing effects on the morhuaGM842 locus has found no differences among
predicted levels of silent polymorphism and the struc-RFLP alleles (G. H. Pogson,unpublished data). These
tures of allelic genealogies. Balancing selection is ex-observations fail to support the historical isolation
hy-pected to significantly extend coalescence times ( Taka-pothesis and suggest that the Pan I locus has
experi-hata1990; TakahataandNei 1990) and lead to an enced a very different evolutionary history from other
accumulation of neutral polymorphism surrounding genes.
the site(s) affected by selection (Strobeck1983; Hud-Evidence that natural selection can act at the PanI
sonandKaplan1988). In contrast, directional selection locus while both alleles coexist in the same population
is expected to shorten coalescence times and signifi-is provided by the dsignifi-istributions of recently derived
muta-cantly reduce linked silent variation through hitchhik-tions segregating within both allelic classes. These
distri-ing effects (Maynard SmithandHaigh1974;Kaplan butions suggest that two selective sweeps may be
oc-et al. 1989) that may extend large distances from the curring among populations ofG. morhua: the eastward
selected locus (see Hudson et al. 1997). If balancing movement of thePanIA⬘allele and the westward spread
selection is responsible for the long lineages ofPan I of the 䉮2 Pan IB allele. ThePan IA⬘ allele (having an
alleles, it has clearly not led to an elevation of linked aspartic acid to lysine mutation in the IV1 domain of
silent polymorphism. The two allelic groups differ, on the protein) probably originated in the Nova Scotia
average, by only a few mutations and exhibit levels of region where it is distributed among two haplotypes and
nucleotide diversity well below that typically found at occurs at high frequency (P ⫽ 0.687). The 䉮2Pan IB
autosomal loci in Drosophila (reviewed byMoriyama allele (characterized by a 12-bp deletion in the second
andPowell1996). The low within-allele diversity com-intron) is likely to have originated in the Barents Sea
pared to the high between-allele divergence can only region where it is nearly fixed (P⫽0.921). Two
observa-be explained by diversity-reducing processes like popu-tions suggest that both alleles have recently displaced
lation bottlenecks, selective sweeps, or background se-previously abundant alleles in their centers of origin.
lection (Charlesworthet al.1993). Some support ex-First, thePanIA⬘ and䉮2PanIBalleles exhibit very low
ists for selective sweeps as the cause of the reduced nucleotide diversities ( ⫽0.0049 and 0.00020,
respec-diversity because the amino acid substitutions required tively) compared to the inclusive allelic groups
summa-to purge linked silent polymorphism have occurred rized in Table 3. Second, in geographic regions where
within both allelic groups. the Pan IA⬘ and 䉮2 Pan IB alleles are most abundant,
The molecular evidence to date indicates that long-the alternate alleles exhibit long-their highest nucleotide
di-versities.PanIAalleles are most variable in the Barents lived balanced polymorphisms are rare. Notable
excep-tions include theMhcclass I and II loci in vertebrates Sea ( ⫽ 0.00147) where they occur at a frequency of
number of alleles that commonly have long coalescent tion producing the fast/slow allozyme polymorphism in eastern North America (Berry and Kreitman 1993). times that transcend species boundaries (reviewed by
Kleinet al. 1998). If a prolonged period of balancing If epistatic selection is acting at thePanI locus between the second intron and fourth exon it is too restrictive selection has been acting at thePanI locus inG. morhua,
it differs from Mhc and S loci by apparently favoring to explain the disequilibrium detected over the entire gene region. Only selective sweeps driven by mutations only two alleles that have each undergone repeated
amino acid substitutions. Therefore, the mechanisms in the second intron and/or fourth exon, or perhaps at closely linked genes, can account for the linkage favoring high allelic diversity atMhcand S loci do not
appear to be operating at the pantophysin locus ofG. disequilibrium present in thePanI gene region. The biochemical basis of how natural selection may morhua.The rapid turnover of alleles at thePanI locus of
G. morhuais, however, consistent with data accumulating be acting at thePan I locus ofG. morhuais unknown. Pantophysin is a recently discovered cellular isoform of from Drosophila suggesting that many balanced
poly-morphisms may have evolved recently and not accumu- the neuroendocrine integral membrane protein synap-tophysin (Haass et al. 1996). Using immunoelectron lated silent polymorphism around the selected site like
theAdhlocus inD. melanogaster(KreitmanandHudson microscopy, pantophysin has been localized to small (⬍100 nm) cytoplasmic microvesicles that likely func-1991). The list of allozyme polymorphisms studied at
the molecular level in D. melanogasterthat fail to show tion in various membrane-trafficking pathways of vari-ous cell types (seeHaasset al.1996). The tissue-specific statistical support for persistent balancing selection
include Est6 (Cooke and Oakeshott 1989), Gpdh expression of pantophysin appears variable and not closely paralleled by other vesicle-associated membrane (Takanoet al.1993), 6Pgd(BegunandAquadro1994),
G6pd(Eaneset al.1993, 1996),Sod(Hudsonet al.1994, proteins such as VAMPS and SCAMPS (Windoffer et al.1999). Although nothing is known of the functioning 1997), andTpi(Hassonet al.1998).
A striking feature of the genealogy of Pan I alleles of pantophysin in fishes, the differences detected be-tween the Pan I alleles of G. morhua suggest that the is the apparent absence of intragenic recombination.
Although this gene may occur in a region of low recom- polymorphism could be related to the differential ex-pression and/or functioning of the protein in different bination, this result is surprising because recombination
was detected among three polymorphic restriction sites tissues. This possibility can be tested by comparing the in situlevels and/or distribution of pantophysin in dif-scored in the vicinity of the Pan I locus (especially in
the NW Atlantic where four recombinant haplotypes ferent tissues for differentPanI genotypes. The intrave-sicular loops of physins (notably synaptophysin) have were present). No intragenic recombination events were
detected within either allelic group. However, 1PanIA not previously been identified as being important
do-mains of the protein (seeJohnston et al.1989). How-allele (NS28-A) had an A to G mutation at position 1407
that was fixed in all 62PanIBalleles (Figure 3). A group ever, the strong footprint of selection in the IV1 domain
of pantophysin in G. morhua strongly suggests that it of 10PanIBalleles were also found in the NW Atlantic
having mutations at positions 1580 and 1650 that were must be performing some critical function(s).
The form of balancing selection that could be op-both fixed inPan IA alleles. Both may represent cases
of interallelic recombination or gene conversion in the erating at the Pan I locus is also unclear. The recent origin and spread of thePan IA⬘and䉮2PanIBalleles
3⬘region of the gene. No recombination was detected
at the 5⬘ end of the gene where the pattern of fixed suggest that stable spatially varying selection is not fa-voring different alleles in different regions. Overdomi-differences between alleles suggests that such events
could be disadvantageous. nance also appears unlikely because the Pan I locus was the only marker not to contribute to a correlation The two PanI alleles are most highly differentiated
in a 30-bp region of the second intron and a 54-bp between DNA heterozygosity and growth rate inG. mor-hua (Pogson and Fevolden 1998) and because the region in the fourth exon where five of the six amino
acid replacements have occurred. The intron region is near fixation of PanI alleles in the Barents Sea, Nova Scotia, and the North Sea is inconsistent with a general capable of forming a stem-loop structure and thus may
affect pre-mRNA stability and/or processing. All intron fitness advantage expected for heterozygotes. Fre-quency-dependent selection may be operating at the insertion/deletion mutations have occurred within the
Pan IB lineage approximately 400 bp upstream from Pan I locus but the mechanism(s) that would prevent
complete fixation of alleles is unknown. The recent three amino acid changes. It is possible that epistatic
natural selection is maintaining the association of the spread of selectively favored mutations in both allelic classes demonstrates the extremely dynamic nature of intron and amino acid mutations in thePan IBalleles
thus generating linkage disequilibrium. A similar link the Pan I polymorphism of G. morhua. Hitchhiking events that are not occurring uniformly across species between intron and amino acid polymorphisms has
been made for the Adh locus of D. melanogasterwhere ranges have also been described in D. melanogaster (Begun and Aquadro 1993) and D. ananassae ( Ste-a compound insertion/deletion mutSte-ation (䉮1) in the
first intron exists in linkage disequilibrium with the fast phanandMitchell1992).
muta-DNA polymorphism correlate with recombination rates in D.
andFuandLi’s (1993)FandDstatistics have reasonable
melanogaster.Nature356:519–520.
power in detecting selective sweeps caused by the fixa- Begun, D. J.,andC. F. Aquadro,1993 African and North American populations ofDrosophila melanogasterare very different at the tion of advantageous mutations (Bravermanet al.1995;
DNA level. Nature356:519–520. Simonsenet al.1995). Although the genealogies of both
Begun, D. J.,andC. F. Aquadro,1994 Evolutionary inferences from
Pan I alleles show evidence for selective sweeps, both DNA variation at the 6-phosphogluconate dehydrogenase locus in natural populations ofDrosophila: selection and geographic tests of neutrality failed to produce consistent results
differentiation. Genetics136:155–170. for the CRSs assembled from the five populations and
Berry, A.,andM. Kreitman,1993 Molecular analysis of an allozyme
neither test produced a single significant result for the cline: alcohol dehydrogenase in Drosophila melanogasteron the east coast of North America. Genetics134:869–893.
pooled CRS of 124 alleles. This unexpected result was
Braverman, J. M., R. R. Hudson, N. L. Kaplan, C. H. Langleyand
apparently caused by combining bothPanI alleles into
W. Stephan,1995 The hitchhiking effect on the site frequency
the analyses, which had the effect of eliminating the spectrum of DNA polymorphisms. Genetics140:783–796.
Cavalli-Sforza, L.,1966 Population structure and human
evolu-signal from the data. When the alleles are considered
tion. Proc. R. Soc. Lond. Ser. B Biol. Sci.164:362–379. separately, Tajima’s test is significant for Pan IA
Charlesworth, B.,1998 Measures of divergence between
popula-(D⫽ ⫺1.883,P⬍ 0.05) and nearly significant forPan tions and the effects of forces that reduce variability. Mol. Biol. Evol.15:538–543.
IB (D ⫽ ⫺1.583, 0.10 ⬎ P ⬎ 0.05) while Fu and Li’s
Charlesworth, B., M. T. MorganandD. Charlesworth,1993
DandF statistics are significant for bothPan IA alleles
The effect of deleterious mutations on neutral molecular varia-(D⫽ ⫺2.954 andF⫽ ⫺3.045, bothP⬍0.02) andPan tion. Genetics134:1289–1303.
Charlesworth, B., M. Nordborgand D. Charlesworth, 1997
IBalleles (D⫽ ⫺2.952 andF⫽ ⫺2.916, bothP⬍0.02).
The effects of local selection, balanced polymorphism and back-These results demonstrate that strong departures from
ground selection on equilibrium patterns of genetic diversity in neutral genealogies need not necessarily produce sig- subdivided populations. Genet. Res.70:155–174.
Cooke, P. H.,andJ. G. Oakeshott, 1989 Amino acid
polymor-nificant test statistics. The sigpolymor-nificant McDonald and
phisms foresterase-6inDrosophila melanogaster.Proc. Natl. Acad. Kreitman test (Table 8) was caused by the long
indepen-Sci. USA86:1426–1430.
dent evolutionary histories of the two alleles, which be- Cowan, D., M. LinialandR. H. Scheller,1990 Torpedo synaptophy-sin: evolution of a synaptic vesicle protein. Brain Res.509:1–7. haved as if they were sampled from different species. If
Eanes, W. F., M. KirchnerandJ. Noon,1993 Evidence for adaptive
recombination between alleles had been more
exten-evolution of the G6pd gene in theDrosophila melanogasterand sive, this test would likely have not been significant. Drosophila simulanslineages. Proc. Natl. Acad. Sci. USA90:7475–
7479. In summary, nucleotide sequence variation at thePan
Eanes, W. F., M. Kirchner, J. Noon, C. H. Biermann, I.-N. Wang
I locus inG. morhuahas provided strong evidence for an
et al., 1996 Historical selection, amino acid polymorphism and unusual mixture of balancing and directional selection. lineage-specific divergence at theG6pdlocus inDrosophila
melano-gasterandD. simulans.Genetics144:1027–1041. The significant linkage disequilibrium and large
differ-Excoffier, L., P. E. SmouseandJ. M. Quattro,1992 Analysis of
ences in the frequencies ofPanI alleles among
popula-molecular variance inferred from metric distances among DNA tions do not appear to be caused by stable spatially haplotypes: application to human mitochondrial DNA restriction
data. Genetics131:479–491. varying selection but by the recent appearance and
Fernandez-Chacon, R.,andT. C. Su¨ dhof,1999 Genetics of
synap-spread of selectively favored mutations in both allelic
tic vesicle function: toward the complete functional anatomy of groups in different geographic areas. Although the two an organelle. Annu. Rev. Physiol.61:753–776.
PanI alleles have had long evolutionary histories, they Fevolden, S. E.,andG. H. Pogson,1997 Genetic divergence at the synaptophysin (SypI) locus among Norwegian coastal and north-have not accumulated polymorphism at linked silent
east Arctic populations of Atlantic cod. J. Fish Biol.51:895–908. sites because of repeated amino acid substitutions within Fu, Y.-X.,andW-H. Li,1993 Statistical tests of neutrality of muta-each allelic lineage. The type of balancing selection that tions. Genetics133:693–709.
Gaitanou, M., A. Malaki, E. MerkouriandR. Matsas,1997
Puri-could be acting at thePanI locus is presently unknown.
fication and cDNA cloning of mouse BM89 antigen shows that However, the discovery of this polymorphism at 1 of it is identical with the synaptic vesicle protein synaptophysin. J. the 11 anonymous cDNA-based RFLP markers initially Neurosci. Res.48:507–514.
Haass, N. K., J. KartenbeckandR. E. Leube,1996 Pantophysin is
chosen for population studies byPogsonet al.(1995)
a ubiquitously expressed synaptophysin homologue and defines suggests that long-lived polymorphisms may be more constitutive transport vesicles. J. Cell Biol.134:731–746. common than previously believed. Hasson, E., I.-N. Wang, L.-W. Zeng, M. KreitmanandW. F. Eanes,
1998 Nucleotide variation in the triosephosphate isomerase I thank C. T. Taggart, I. Hunt Von Herbing, M. Tupper, A. K.
(Tpi) locus ofDrosophila melanogasterandDrosophila simulans.Mol. Danielsdottir, and S. E. Fevolden for their help in obtaining popula- Biol. Evol.15:756–769.
tion samples, K. A. Mesa for technical assistance, and two anonymous Hey, J.,1999 The neutralist, the fly and the selectionist. Trends reviewers for their helpful comments on improving the manuscript. Ecol. Evol.14:35–38.
Funding for the study was provided by the Ocean Production Enhance- Hudson, R. R.,1990 Gene genealogies and the coalescent process, pp. 1–44 in Oxford Surveys in Evolutionary Biology, edited byD.
ment Network (NSERC Canada) and by the University of California.
FutuymaandJ. Antonovics.Oxford University Press, Oxford.
Hudson, R. R.,andN. L. Kaplan,1988 The coalescent process in
models with selection and recombination. Genetics120:831–840.
Hudson, R. R., K. Bailey, D. Skarecky, J. KwiatowskiandF. J.
LITERATURE CITED
Ayala,1994 Evidence for positive selection in the superoxide
dismutase (Sod) region ofDrosophila melanogaster.Genetics136:
Aquadro, C. F., D. J. BegunandE. C. Kindahl,1994 Selection,
recombination and the levels of DNA polymorphism in Drosoph- 1329–1340.
Hudson, R. R., A. G. Sa´ezandF. J. Ayala,1997 DNA variation at
ila, pp. 45–56 inNon-neutral Evolution: Theories and Molecular Data,
edited byG. B. Golding.Chapman & Hall, New York. the Sodlocus ofDrosophila melanogaster: an unfolding story of natural selection. Proc. Natl. Acad. Sci. USA94:7725–7729.
Johnston, P. A., R. JahnandT. C. Su¨ dhof,1989 Transmembrane Rozas, J.,andR. Rozas,1997 DnaSP version 2.2: a novel software package for extensive molecular population genetics analysis. topography and evolutionary conservation of synaptophysin. J.
Biol. Chem.264:1268–1273. Comput. Appl. Biosci.13:307–311.
Saitou, N.,andM. Nei,1987 The neighbor-joining method: a new
Jonsdottir, O. D. B., A. K. Imsland, A. K. Danielsdottir, V.
ThorsteinssonandG. Naevdal,1999 Genetic differentiation method for reconstructing phylogenetic trees. Mol. Biol. Evol.
4:406–425. among Atlantic cod in south and south-east Icelandic waters:
synaptophysin (SypI) and haemoglobin (HbI) variation. J. Fish Schaeffer, S. W.,andE. L. Miller,1992 Estimates of gene flow inDrosophila pseudoobscuradetermined from nucleotide sequence Biol.54:1259–1274.
Kaplan, N. L., R. R. HudsonandC. F. Langley,1989 The “hitchhik- analysis of the alcohol dehydrogenase region. Genetics132:471–
480. ing effect” revisited. Genetics123:887–899.
Karotam, J., T. M. BoyceandJ. G. Oakeshott,1995 Nucleotide Schulte, P. M., M. Go´ mez-ChiarriandD. A. Powers,1997
Struc-tural and functional differences in the promoter and 5⬘flanking variation at the hypervariable esterase 6 isozyme locus of
Drosoph-ila simulans.Mol. Biol. Evol.12:113–122. region ofLdh-Bwithin and between populations of the teleost,
Fundulus heteroclitus.Genetics145:759–769.
Katz, L. A.,andR. G. Harrison,1997 Balancing selection on
elec-trophoretic variation of phosphoglucose isomerase in two species Simonsen, K. L., G. A. ChurchillandC. F. Aquadro,1995 Proper-ties of statistical tests of neutrality for DNA polymorphism data. of field cricket:Gryllus veletisandG. pennsylvanicus.Genetics147:
609–620. Genetics141:413–429.
Stephan, W., and S. J. Mitchell,1992 Reduced levels of DNA
Klein, J., A. Sato, S. NaglandC. O’Huigin,1998 Molecular
trans-species polymorphism. Annu. Rev. Ecol. Syst.29:1–21. polymorphism and fixed between-population differences in the centromeric region ofDrosophila ananassae.Genetics132:1039–
Kliman, R. M., andJ. Hey,1993 DNA sequence variation at the
period locus within and among species of theDrosophila melanogas- 1045.
Strobeck, C.,1983 Expected linkage disequilibrium for a neutral
tercomplex. Genetics133:375–387.
Kreitman, M.,1991 Detecting selection at the level of DNA, pp. locus linked to a chromosomal arrangement. Genetics103:545–
555. 204–221 inEvolution at the Molecular Level, edited byR. K.
Sel-ander, A. G. ClarkandT. S. Whittam.Sinauer, Sunderland, Su¨ dhof, T. C., F. Lottspeich, P. Greengard, E. MehlandR. Jahn,
1987 A synaptic vesicle protein with a novel cytoplasmic domain MA.
Kreitman, M.,andH. Akashi,1995 Molecular evidence for natural and four transmembrane regions. Science238:1142–1144.
Swofford, D. L.,1993 PAUP: Phylogenetic Analysis Using Parsimony,
selection. Annu. Rev. Ecol. Syst.26:403–422.
Kreitman, M.,andR. R. Hudson,1991 Inferring the evolutionary version 3.1. Illinois Natural History Survey, Champaign, IL.
Swofford, D. L.,andR. B. Selander,1989 BIOSYS-1: A Computer
history of the Adhand Adh-duploci in Drosophila melanogaster
from patterns of polymorphism and divergence. Genetics127: Program for the Analysis of Allelic Variation in Population Genetics and Biochemical Systematics. Illinois Natural History Survey, Cham-565–582.
Kumar, S., K. TamuraandM. Nei,1993 MEGA: Molecular Evolution- paign, IL.
Tajima, F.,1989 Statistical method for testing the neutral mutation
ary Genetic Analysis, version 1.02. Pennsylvania State University,
University Park, PA. hypothesis by DNA polymorphism. Genetics123:585–595.
Takahata, N., 1990 A simple genealogical structure of strongly
Maynard Smith, J.,andJ. Haigh,1974 The hitch-hiking effect of
a favorable gene. Genet. Res.23:23–35. balanced allelic lines and trans-species evolution of polymor-phism. Proc. Natl. Acad. Sci. USA87:2419–2423.
McDonald, J. H.,andM. Kreitman,1991 Adaptive protein
evolu-tion at theAdhlocus inDrosophila.Nature351:652–654. Takahata, N.,andM. Nei,1990 Allelic genealogy under overdomi-nant and frequency-dependent selection and polymorphism of
Moriyama, E. N.,andJ. R. Powell,1996 Intraspecific nuclear DNA
variation in Drosophila. Mol. Biol. Evol.13:261–277. major histocompatibility complex loci. Genetics124:967–978.
Takano, T. S., S. Kusakabeand T. Mukai,1993 DNA
polymor-Pogson, G. H.,andS. E. Fevolden,1998 DNA heterozygosity and
growth rate in the Atlantic cod,Gadus morhua(L.). Evolution52: phisms and the origin of protein polymorphism at theGpdhlocus 915–920. ofDrosophila melanogaster, pp. 170–190 inMechanisms of Molecular
Pogson, G. H., K. A. Mesa andR. G. Boutilier, 1995 Genetic Evolution, edited byN. Takahata andA. G. Clark. Sinauer,
population structure and gene flow in the Atlantic cod Gadus Sunderland, MA.
morhua: a comparison of allozyme and nuclear RFLP loci. Genet- Taylor, W. R.,1986 The classification of amino acid conservation. ics139:375–385. J. Theor. Biol.119:205–218.
Pogson, G. H., C. T. Taggart, K. A. MesaandR. G. Boutilier, Weir, B. S.,1990 Genetic Data Analysis.Sinauer, Sunderland, MA.
2001 Isolation-by-distance in the Atlantic cod,Gadus morhua, at Windoffer, R., M. Borchert-Stuhltrager, N. K. Haass, S.
large and small geographic scales. Evolution (in press). Thomas, M. Hergtet al., 1999 Tissue expression of the vesicle
Raymond, M.,andF. Rousset,1995 GENEPOP (version 1.2): popu- protein pantophysin. Cell Tissue Res.296:499–510.
lation genetics software for exact tests and ecumenicism. J. Hered.