18th International Conference on Structural Mechanics in Reactor Technology (SMiRT 18) Beijing, China, August 7-12, 2005 SMiRT18-K13-5
STUDY ON THE SEISMIC RESPONSES OF AN EXPERIMENTAL
LMFBR INCLUDING FLUID-STRUCTURE INTERACTION
Liang Lu*, Xilin Lu, Jiang Qian, Zhiyuan Weng
Research Institute of Structural Engineering and Disaster Reduction, Tongji University,
Siping Rd 1239, Shanghai, 200092, China
Phone: 0086-21-65982666, Fax: 0086-21-65982668
E-mail: [email protected]
ABSTRACT
A liquid metal fast breeder nuclear reactor (LMFBR) usually contains a huge volume of liquid sodium as reactor coolant. Since most reactor components are submerged in the sodium coolant, the seismic-induced fluid-structure interaction is of great importance to the design of reactor block. This paper presents the result of shaking table test of a scaled reactor block model and analysis for China experimental LMFBR. Experimental and analyzed results contain (1) beam-type vibration frequency of the reactor block; (2) sloshing frequency of the sodium coolant; (3) wave heights of non-linear sloshing under seismic action; (4) fluid pressure exerted on the structure under seismic excitation. Several conclusions are obtained.
Keywords: LMFBR fluid-structure interaction reactor block shaking table test
1. INTRODUCTION
A LMFBR contains a huge volume of liquid sodium as coolant and heat transfer medium. Most of the reactor components such as reactor core, IHXs and preliminary pumps are submerged in the liquid sodium, so the seismic-induced fluid-structure interaction is of great importance to reactor structural integrity and safety assessment of the internal reactor components.
Seismic-induced fluid pressure exerted on surrounding structures generally consists of three components (Ma et al., 1987). These three components are the connective pressure which has a longer period contributed by the fluid sloshing motion, the impulsive pressure that varies synchronously with the input acceleration, and the pressure that was induced by the relative acceleration of the flexible structure with respect to the reactor base.
The nature of the seismic-induced hydrodynamic effects likely to be experienced by a reactor vessel and components depends on the confinement condition of the liquid coolant. Generally, the liquid sodium in a LMFBR reactor vessel can be classified into three categories according to the confinement conditions (Ma et al., 1991).
1. Strongly confined;
2. Between two concentric cylinders;
3. Pool with large free surface and many immersed components.
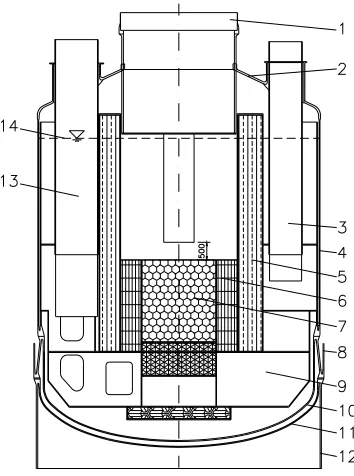
Fig. 1 Vertical section of CEFR test model
1- rotary plug; 2- top closer of the main vessel; 3- IHX; 4- main vessel; 5- internal shield; 6- core tank; 7- core; 8- guard vessel; 9- internal support structure; 10- bottom closer of main vessel; 11- bottom closer of guard vessel; 12- support skirt; 13- primary pump; 14- elevation of liquid sodium
This paper deals with the experimental study of the reactor block stiffness of China Experimental Fast Reactor (CEFR) on the sloshing behavior by comparing the fundamental frequencies of structure and sloshing. And, the maximum sloshing wave heights and fluid pressures are measured under seismic excitations (OBE & SSE). From the measured sloshing wave heights, that can be seen whether the sloshing waves exert an impact force on the reactor top closer. The other seismic responses, such as displacement, liquid pressure and acceleration, etc. are not included herein due to the length limitation of the paper.
2. SHAKING TABLE TEST OF LMFBR MODEL
The prototype of the LMFBR reactor block is a bottom-supported tank structure, which is 12m high, 8m in diameter and 1300 tons in weight. It contains a large amount of internal components and about 265m3 liquid sodium. The reactor vessels and most components for the prototype are made of 304 or 316 stainless steel. The basic test model is a 1/6.25-scaled reactor block, which contains a UIS, four IHXs and two pumps, etc. (see Fig. 1). For practical purposes, the test model is made of aluminum alloy and the liquid sodium is simulated by water. Additional weights, which are made of small lumps of lead, are attached uniformly on the reactor vessel and internal components according to the law of dynamic similitude for liquid-coupled structures. Table 1 shows the similitude ratio of the 1/6.25-scaled test model.
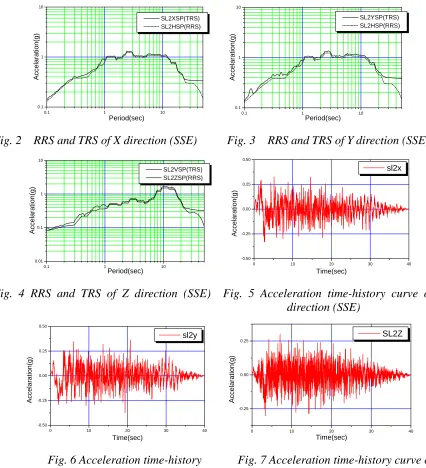
Input seismic excitations used in the tests are floor OBE, SSE and 1940 El Centro earthquake waves. Fig. 2~4 shows the prototype floor response spectrums at the CEFR reactor block base (Elevation +4.20m) of SSE level with a damping ratio ξ=2%. In these figures, dash line represents request response spectrum (RRS) and the continuous line represents test response spectrum (TRS, TRS is up envelops RRS). Synthetic acceleration time-history curves of SSE were generated from these response spectrums, see Fig. 5~7. Shaking table test excitation acceleration curves of SSE level were transformed from Fig.5~7 by the similitude relationships mentioned in Table 1. The amplitude of OBE acceleration curves is 50% of SSE level. The same process was also used on El Centro earthquake waves.
0.1 1 10 0.1 1 10 SL2XSP(TRS) SL2HSP(RRS) A ccel a ra ti o n (g )
Period(sec) 0.1 1 10
0.1 1 10 SL2YSP(TRS) SL2HSP(RRS) Accel a ration(g) Period(sec)
Fig. 2 RRS and TRS of X direction (SSE) Fig. 3 RRS and TRS of Y direction (SSE)
0.1 1 10
0.01 0.1 1 10 SL2VSP(TRS) SL2ZSP(RRS) Accelaration(g) Period(sec)
0 10 20 30 4
-0.50 -0.25 0.00 0.25 0.50 0 sl2x Acc e la ra ti on (g ) Time(sec)
Fig. 4 RRS and TRS of Z direction (SSE) Fig. 5 Acceleration time-history curve of X
direction (SSE)
0 10 20 30 4
-0.50 -0.25 0.00 0.25 0.50 0 sl2y A c ce la ra ti o n (g ) Time(sec)
0 10 20 30 4
-0.25 0.00 0.25 0 SL2Z Accela ra tion (g ) Time(sec)
Fig. 6 Acceleration time-history Fig. 7 Acceleration time-history curve of
curve of Y direction (SSE) Z direction (SSE)
Since the sloshing motion pronounces just in the annulus space between the main vessel and the internal shield above the top plate of internal support structure. Two test configurations are arranged. Configuration 1 is simplified from the actual reactor block by a scale of 1/6.25 in dimension. Configuration 2 excluded the four IHXs and two preliminary pumps described in Fig. 1. Table 2 shows the same exciting steps of the two configurations.
Table 1: Similitude ratio of the 1/6.25 scale test model
Similitude formula Similitude ratio (prototype/model)
Length
S
l 6.250Elastic modulus
S
E 2.757Frequency of structure
S
f 0.293Acceleration
S
l/
S
t2 0.267Frequency of liquid sloshing
(
1
/
S
h)
2 / 1Wave height
S
h 1.669Fluid connective pressure
S
ρfS
h 5.125Fluid impulsive pressure
S
ρfS
hS
a 1.368Fig. 8 Plan locations of level meters
Table 2: Exciting steps for model shaking table tests
Peak acceleration (g)
Step Wave Exciting direction
X Y Z
1 OBE X 0.628
2 OBE 3-D 0.628 0.572 0.491
3 El Centro-1 3-D 0.628 0.386 0.379
4 SSE X 1.256
5 SSE 3-D 1.256 1.144 0.982
6 El Centro-2 3-D 1.256 0.772 0.758
3. THEORETICAL ANALYSIS FOR THE SLOSHING MOTION
In configuration 2, two types of motion dominate the fluid sloshing. One is the radial motion in which the fluid flows in the radial direction of the vessel, and the other is the
cos
θ
tangential motion in which the fluid flows along the tangential direction of the vessel. In configuration 1, the fluid sloshing motion is further complicated by the existence of the off-center components, such as IHXs and pumps; the fluid must change its flow direction when it encounters the off-center submerged components. As it can be seen, the sloshing waves are very complicated and appear to have acos
n
θ
tangential sloshing mode (MA et al., 1991). Since the complexity of thecos
n
θ
tangential sloshing mode, it is impossible to calculate the frequencies of the higher-order sloshing modes by a simple theoretical equation. The frequencies of the radial and thecos
θ
tangential liquid sodium sloshing modes of configuration 2 can be approximately calculated by using the following equation (Ma et al., 1991)
)
58
.
1
tanh(
58
.
1
2
1
l
H
l
g
f
π
=
(1)In which,
l
=
A
−
B
2
for radial sloshing mode, and4
)
(
A
B
π
l
=
+
forcos
θ
tangential sloshing mode.A and B are radius of the reactor vessel and the internal shield, respectively. H is the fluid height above the internal support structure, and g is the gravitational acceleration.
tangential sloshing mode is 0.617Hz, and the second frequency of radial sloshing mode is 1.730Hz.
4. COMPARISON OF THE EXPERIMENTAL AND CALCULATED RESULTS
4.1 Fundamental frequencies of reactor block vibration and the liquid sloshing motion
A 3-dimentional shaking table was used to conduct the reactor model tests. By using FFT of the time-history curves measured by accelerometers under random noise (pink noise) excitation, the fundamental frequency of the beam-type vibration of the reactor block is obtained. Table 3 shows the comparison of the measured and calculated fundamental frequencies. The calculated results are obtained by Qian et al. (2000) using a 3-D FEM model with ANSYS 5.4 code. The experimental frequency of the prototype of the reactor block is deducted by the similitude ratio described in Table 1. Table 4 shows the measured and calculated frequencies of the
cos
θ
tangential sloshing mode and the calculated results were also computed by Qian et al. (2000). As it can be seen, the experimental results are corresponding with the calculated results very well. In configuration 2, the measured frequency ofcos
θ
tangential sloshing mode is 0.6598Hz and the calculated frequency is 0.60Hz, these two values also have a good agreement with the above-mentioned theoretically calculated frequency of 0.617Hz.Table 3: Comparison of the fundamental frequencies of reactor block structure
(configuration 1)
Measured (Hz) Calculated (Hz) Error (%)
1/6.25 model 35.14 37.58 6.5
Prototype 10.30 9.96 3.4
Table 4: Comparison of sloshing frequencies of
cos
θ
tangential mode
Measured (Hz) Calculated (Hz) Error (%)Configuration 1 0.500 0.495 1.0
(Prototype of configuration 1, conducted) (0.200) (0.198) /
Configuration 2 0.6598 0.600 10.0
(Prototype of configuration 2, conducted) (0.264) (0.240) /
All comparisons, showed in Table 3 and Table 4, indicated that the agreement is fairly good. The fundamental frequency of the prototype reactor block is 10.3Hz, which is approximately 50 times of the fundamental frequency 0.2Hz of the
cos
θ
tangential sloshing motion. The effects of the fluid-structure interaction will have very little influence on the sloshing motion of the liquid sodium. A similar conclusion was reported in a literature (DU et al., 1998). That is to say, the reactor main vessel of CEFR reactor can be considered as rigid when calculates the responses of the liquid sloshing motion under seismic excitations.4.2 Measured sloshing wave heights under seismic excitation
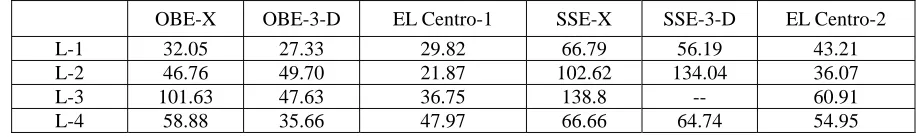
In configuration 1, the measured maximum wave heights are showed in Table 5 under base excitations of OBE, SSE and El Centro earthquake waves (see Table 2). The distance between the liquid surface and the conical top cover of the main vessel of the test model are 232.5mm at points L1, L4, L7, 185.8mm at L2, L5, and 139.2mm at L3, L6, L8 (detailed locations showed in Fig. 8). The sloshing liquid will produce an impact force on the conical top cover when the sloshing wave height exceeds the above-specified free space. It can be seen in the Table 5 and Fig. 9, the highest sloshing wave is 138.8mm at point L3 under SSE-X excitation, while the other values appear much smaller than that and may not exert impact forces on the conical top cover.
Table 5: Maximum sloshing wave heights (mm)
OBE-X OBE-3-D EL Centro-1 SSE-X SSE-3-D EL Centro-2
L-1 32.05 27.33 29.82 66.79 56.19 43.21
L-2 46.76 49.70 21.87 102.62 134.04 36.07
L-3 101.63 47.63 36.75 138.8 -- 60.91
L-5 18.3 28.48 55.78 34.44 34.04 84.46
L-6 -- 34.56 32.7 95.89 107.73 95.89
L-7 26.34 31.93 30.45 44.16 55.81 57.32
L-8 25.09 28.94 68.45 31.95 -- --
L1 L2 L3 L4 L5 L6 L7 L8
20 40 60 80 100 120
140 SL1X SL1T
ELC1 SL2X SL2T ELC2 Sl osh in g wa ve he ig ht (mm) P1 P2 P3 P4 P5
0 2 4 6 8 10 12 14
SL1X SL1T ELC1 SL2X SL2T ELC2 Vertical measure p oin ts
Fig. 9 Sloshing wave heights (mm) Fig. 10 Fluid pressure on the inner wall of
main vessel (kPa)
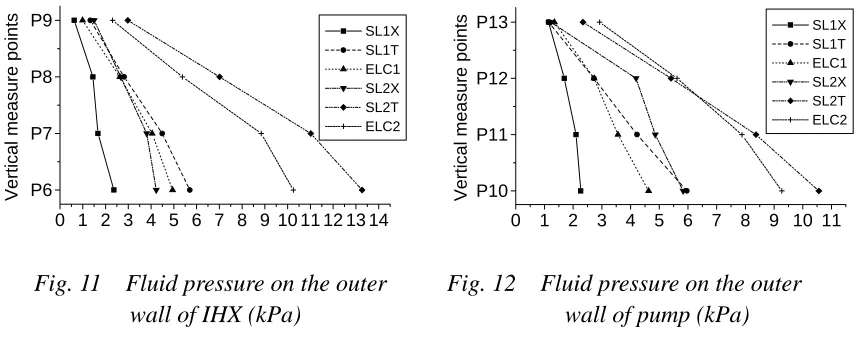
4.3 Fluid pressure under seismic excitation
Four or five fluid pressure transformers were set alone the height of main vessel, preliminary pump and IHX to measure the distribution of fluid pressure. Fig. 10~12 shows the pressure value varies from 1 to 14kPa (static fluid pressure not included). The shapes of the pressure distribution mean that the impulsive pressure is the dominant component of the entire fluid pressure (Qian et al., 2000).
P6 P7 P8 P9
0 1 2 3 4 5 6 7 8 9 10 11 12 13 14
SL1X SL1T ELC1 SL2X SL2T ELC2 Ve rt ical mea s ure po int s P10 P11 P12 P13
0 1 2 3 4 5 6 7 8 9 10 11
SL1X SL1T ELC1 SL2X SL2T ELC2 Vertical me asure po ints
Fig. 11 Fluid pressure on the outer Fig. 12 Fluid pressure on the outer
wall of IHX (kPa) wall of pump (kPa)
5. CONCLUSION
(1) Study of CEFR LMFBR indicates that the fundamental frequency (app. =10.3Hz) of the reactor block is 50 times of the first order frequency (app. =0.2Hz) of sloshing motion of the coolant, so the effects of fluid-structure interaction, exert on the liquid sloshing motion, is negligible.
(2) The impact force on the conical top cover of the reactor main vessel, induced by the liquid sloshing motion under serious seismic excitation, is also quite small.
(3) The impulsive pressure is the dominant component of the entire fluid pressure.
REFERENCES
Ma, D. C., Chang, Y. W. and Seidensticker, R. W., (1991), Transaction of the 11th International Conference on Structural Mechanics in Reactor Technology (SmiRT11), Vol. E, pp 425-436
QIAN, J. and LU, L., (2000), Transaction of the 11th China Conference on Structural Mechanics in Reactor Technology (in Chinese), pp 136-138.