Copyright to IJIRSET www.ijirset.com 10105
A new approach for Classifying land
development in High-Resolution Remote
Sensing Images
Shashidhar.R, Rashmi.K.T
P.G. Student, Dept. of E&C, Don Bosco Institute of Technology, Bangalore, Karnataka, India
Assistant Professor, Dept. of E&C, Don Bosco Institute of Technology, Bangalore, Karnataka, India
ABSTRACT : In this paper present an unsupervised method for discovering compound image structures that are comprised of simpler primitive objects. An initial segmentation step produces image regions with homogeneous spectral content. Then, the segmentation is translated into a relational graph structure whose nodes correspond to the regions and the edges represent the relationships between these regions. Therefore, we employ two different procedures to discover the sub graphs in the constructed graph. During the first procedure the graph is discredited and a graph-based knowledge discovery algorithm is applied to find the repeating sub graphs. Even though a single sub graph does not exclusively correspond to a particular compound structure, different sub graphs constitute parts of different compound structures. We extract a large set of corners from each input image by an improved Harris corner detector. Afterward, we incorporate the extracted corners into a likelihood function to locate candidate regions in each input image. The second procedure involves graph segmentation by using normalized cuts. Since the distribution of significant relations within resulting sub graphs gives an idea about the nature of corresponding compound structure, the sub graphs are further grouped by clustering the histograms of the most significant relations.
Keywords- Built-up area detection, corner detector, graph cut, high-resolution remote sensing image, spectrum clustering.
I.INTRODUCTION
In This paper, a new segmentation method is proposed. The proposed method uses the residuals of morphological opening and closing transforms based on a geodesic metric. The proposed approach may be considered analogous to region growing techniques. However, in contrast to the use of statistical local properties as in region growing approaches, the proposed method uses a pixel similarity rule based on the morphological characteristic of connected components in images. In the proposed approach the morphological residuals between the original grey-level function and the composition of a granulometry and an anti-granulometry by reconstruction are used to build a morphological profile function. Recent theoretical advances in mathematical morphology, such as the definitions of leveling and the morphological spectrum, form a theoretical framework for the formal definition of the morphological profile function. This function is interpreted as a fuzzy membership function related to a set of morphological characteristics of the connected components in the image. A labeling phase is then formalized using a decision rule based on the greatest value of the derivative of the morphological profile function. As can be seen earlier, although existing methods have their own pros and cons, their main limitation is that they all focus on detecting build-up regions from a single image and thus have to label a large volume of training samples to provide sufficient prior information for high detection rate.
Copyright to IJIRSET www.ijirset.com 10106 regions with spectral features to measure built-up areas. Pesaresi and Benediktsson.[2] Introduce a novel mathematical morphological transformation, called different morphological profile, toextract texture information from the image. Its application for built-up region detection can be found.in[3] their later work,[4] a buildup area presence index is proposed for built-up area extraction in panchromatic satellite image, which is based on fuzzyrule- based composition of anisotropic texture co-occurrence measures. In recent years, built-up area detection based on local invariant features has revealed promising results.In[5] Sirmacek and Unsalan develop a method to detect built-up areas and buildings in very high resolution Ikonos satellite images based on scale-invariant feature transform features and graph theory. However, it needs some template building images for training and therefore suffers from a high computing complexity and memory requirement. In Their later work[6]A more direct method is used. However, since it solely depends on local features for recognition, it can often be too weak of a signal to reliably detect the built-up regions in complex satellite image.
II. EXTRACTION OF CANDIDATE BUILT-UP REGIONS
Given a set of high-resolution remote sensing images covering different scenes, our objective is to simultaneously detect built-up regions from them. Generally speaking, urban environment is replete with corners from building roofs, road marks, and other man-made objects. If we could detect all such corner points from images, the built-up regions would be naturally implied from the density of corners. Thus, in this section, I use the corner feature to infer the locations of potential built-up regions in the given images. Corner detection has been a longstanding problem in computer vision. In order to achieve a reliable extraction of corners from built-up areas, we proposed two criterions, which take both Edge points and Corner response into consideration, to validate and filter a large set of initial extracted Harris corners.
A. Edge Points
A corner can be defined as the intersection of two edges. A corner can also be defined as a point for which there is two dominant and different edge directions in a local neighborhood of the point. An interest point is a point in an image which has a well-defined position and can be robustly detected. This means that an interest point can be a corner but it can also be, for example, an isolated point of local intensity maximum or minimum, line endings, or a point on a curve where the curvature is locally maximal. We should easily recognize the point by looking at intensity values within a small window shifting the window in any direction should yield a large change in appearance. The figure shows the edge points in the Edge Point Detector.
B. Corner response
It is the intersection of two edges, it represents a point in which the directions of these two edges change. Hence, the gradient of the image (in both directions) have a high variation, which can be used to detect it. Since corners represents a variation in the gradient in the image, we will look for this “variation”. Consider a grayscale image. We are going to sweep a window (with displacements in the x direction and in the right direction) and will calculate the variation of intensity.
E(u, v) =∑, w(x, y)[I(x + u, y + v)−I(x, y)] (1)
where: w(x,y) is the window at position (x,y),I(x,y)is the intensity at (x,y),I(x+u,y+v) is the intensity at the moved window (x+u,y+v) Since we are looking for windows with corners, we are looking for windows with a large variation in intensity. Hence, we have to maximize the equation above, specifically the term:
Copyright to IJIRSET www.ijirset.com 10107 C Thresholding Method
The output of the thresholding operation is a binary image whose gray level of 0 (black) will indicate a pixel belonging to a print, legend, drawing, or target and a gray level of 1 (white) will indicate the background. The main difficulties associated with thresholding such as in documents or NDT applications occur when the associated noise process is non-stationary, correlated and non-Gaussian. Other factors complicating thresholding operation are ambient illumination, variance of gray levels within the object and the background, inadequate contrast, object shape and size non-commensurate with the scene. Finally the lack of objective measures to assess the performance of thresholding algorithms is another handicap. In fact most authors limit themselves to the visual inspection of a few test cases. A document image analysis and recognition system includes several image processing techniques, beginning with digitization of the document and ending with character recognition and natural language processing
Thresholding is one of the first low-level image processing techniques used, before document analysis step, for obtaining a binary image from its gray scale one. The thresholding step can be quite critical in that it will affect the performance of successive steps such as segmentation of the document into text objects, and the correctness of the OCR (optical character recognition). Improper thresholding causes blotches, streaks, erasures on the document confounding segmentation and recognition tasks.
We categorize the thresholding methods in six groups according to the information they are exploiting. These categories are:
1. Histogram shape-based methods where the peaks, valleys and curvatures of the smoothed histogram are analyzed. 2. Clustering-based methods where the gray level samples are clustered in two parts as background and foreground
(object) or alternately are modeled as two Gaussian distributions.
3. Entropy-based methods result in algorithms, for example, that use the entropy foreground-background regions, the cross-entropy between the original and binarized image etc.
4. Object attribute-based methods search a measure of similarity between the gray-level and binarized images, such as fuzzy similarity, shape, edges, number of objects etc.
5. The spatial methods use the probability mass function models taking into account correlation between pixels on a global scale.
6. Local methods do not determine a single value of threshold but adapt the threshold value depending upon the local image characteristics.
III CLASSIFICATION ON THE CANDIDATE BUILT-UP REGIONS
In each image in the input image collection, I repeat the aforementioned step to locate candidate urban regions.. Some non-built-up region may be wrongly extracted as well. Upon inspection, I find that most of the false-alarm samples are regions that contain many man-made objects inside them, like airport, harbor, etc. Moreover, since we utilize a binarization processing to extract candidate built-up regions, false alarms may be extracted from the image which does not contain any built-up regions.
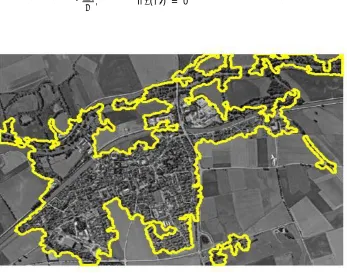
Copyright to IJIRSET www.ijirset.com 10108 Figure 1.Input Image
A. Feature Extraction of Candidate Built-Up Regions
Since the built-up region has unique texture in comparison with a natural area, here, we use the texture feature to describe the built-up region. In our work, the texture feature is obtained by the following three steps.
Step 1) Convolving the panchromatic band of each candidate region Ri with a Gabor filter bank [11] at K scales and S orientations (in the experiment, we set K = 4 and S = 6) to generate filter responses.
Step 2) The resultant filter responses are aggregated and clustered into textons using the k-means algorithm, which are further used to form a text on dictionary Ω.
Step 3) A k-dimensional histogram descriptor hi is constructed for each candidate region Ri by labeling each filter response with the texton which lies closest to it in the dictionary.
B. Grouping Candidate Built-Up Regions Using Spectral Clustering
In this step, we use spectral clustering method to solve the grouping problem. In recent years, spectral clustering has become one of the most popular modern clustering algorithms. It is simple to implement and outperforms traditional clustering algorithms such as the k-means algorithm. Generally, it consists of the following four steps.
a) Suppose that there are M built-up samples extracted from the input image collection in the first stage, and H = {h1, h2, . . . , hM} denotes their corresponding texture histogram. Here, Aij is defined as follows:
Copyright to IJIRSET www.ijirset.com 10109 where hi and hj denote the texture feature histograms extracted from the candidate regions Ri and Rj , respectively (they are defined in Section III-A). Kχ2 (·, ·) represents a χ2 kernel function for two histogram inputs: Kχ2 (x, y) = exp(−(1/2)i((xi − yi)2/xi + yi)), where i indexes the histogram bins.
b) Define D to be the M ∗M diagonal matrix with Dii = j Aij , and then, construct the normalized affinity matrix L = D−1/2AD −1/2.
c) Find u1, u2, . . . , ul, the l largest eigenvectors of L, and form the matrix E = [u1, . . . , ul] ∈ RM∗l by stacking the l eigenvectors in columns.
d) For i = 1, 2, . . .,M, let Oi be the vector corresponding to the ith row of E, and cluster them into l groups B1, . . . , Bl, via the k-means clustering algorithm. Afterward, assign the original point hi to cluster j if and only if the corresponding row i of E is assigned to cluster j, thus obtaining the final clusters C1, . . . , Cl with Cj = {i|hi ∈ Bj}.
Figure2 corner response image
C. Detecting Built-Up Regions via Graph Cut
Copyright to IJIRSET www.ijirset.com 10110 several clusters. To handle this, we formulate the classification problem as a labeling problem, i.e., assigning each cluster Ci with a label L(Ci) as follows:
L(Ci)=1, if ∈ built−up region
0, if ∈ non−built−up region. (4)
To express these desired properties of labeling, I define the cost function of labeling E(L) as
E(L)=∑ (Ci, L(Ci))+∑_ ( , , ( ), ( )) (5)
where the data term measures the possibility of each cluster belonging to a built-up region, which is defined as
Vd (Ci, L(Ci)) =
1 − / , if ( ) = 1
, if ( ) = 0 (6)
Copyright to IJIRSET www.ijirset.com 10111
IV. EXPERIMENTS
A. Data Set Description
I demonstrate the performance of our method using 70 test images, which are composed of 32 satellite images (Ikonos and Quickbird images) and 38 aerial photographs downloaded from Google Earth. In the experiments, we use these images to construct three data sets.
1) The first data set contains 45 images with 1-m spatial resolution.
2) The second data set contains 50 images. Among them, there are 30 images with 1-m spatial resolution and 20 images with 0.61-m spatial resolution. This data set is used to test the detection ability of the proposed method for images acquired by different sensors and different spatial resolutions.
3) The third data set contains ten images. This data set is used to test the robustness of the proposed method when the number of the input images is small.
V. CONCLUSION
In this paper, I have doing an unsupervised framework toward simultaneously discovering built-up regions from multiple high-resolution satellite images. The proposed method includes two major steps: first a likelihood-function based approach to extract candidate built-up regions, in which an improved Harris operation is proposed, and second spectrum clustering- and graph-cut-based unsupervised clustering algorithm for the final built-up area detection. Based on the extensive tests, the proposed approach demonstrates the following main advantages over the previous works. First, it can simultaneously detect built-up regions from multiple images, and our experiment results show that the performance of built-up area detection can be further improved by exploring the cues drawn from multiple images. Second, the entire process is highly automatic and requires no human interaction.
REFERENCES
[1] C. Ünsalan and K. L. Boyer, “Classifying land development in highresolution panchromatic satellite images using straight-line statistics,” [2] IEEE Trans. Geosci. Remote Sens., vol. 42, no. 4, pp. 907–919, Apr. 2004.
[3] M. Pesaresi, A. Gerhardinger, and F. Kayitakire, “A robust built-up area presence index by anisotropic rotation-invariant textural measure,” IEEE J. Sel. Topics Appl. Earth Observ. Remote Sens., vol. 1, no. 3, pp. 180–192, Sep. 2008.
[4] B. Sirmacek and C. Unsalan, “Built-up-area and building detection using SIFT keypoints and graph theory,” IEEE Trans. Geosci. Remote Sens., vol. 47, no. 4, pp. 1156–1167, Apr. 2009.
[5] B. Sirmacek and C. Unsalan, “Built-up area detection using local feature points and spatial voting,” IEEE Geosci. Remote Sens. Lett., vol. 7, no. 1, pp. 146–150, Jan. 2010.
[6] C. G. Harris and M. Stephens, “A combined corner and edge detector,” in Proc. 4th Alley Vis. Conf., 1988, pp. 147–151.
[7] L. M. Fonte, S. Gautama,W. Philips, andW. Goeman, “Evaluating corner detectors for the extraction of man made structures in urban areas,” in Proc. IEEE Conf. IGARSS, 2005, pp. 237–240.
[8] D. H. Douglas and T. Peucker, “Algorithm for the reduction of the number of points required to represent a digitized line or its caricature,” Can. Cartograph., vol. 10, no. 2, pp. 112–122, 1973.
[9] S. Bhagavathy and B. S. Manjunath, “Modeling and detection of geospatial objects using texture motifs,” IEEE Trans. Geosci. Remote Sens., vol. 44, no. 12, pp. 3706–3715, Dec. 2006.
[10] U. Luxburg and M. Planck, “A tutorial on spectral clustering,” J. Stat. Comput., vol. 17, no. 4, pp. 395–416, Dec. 2007. [11 ] L. Vincent, “Graphs and mathematical morphology,” Signal Process., no. 16, pp. 365–388, 1989.
Copyright to IJIRSET www.ijirset.com 10112
BIOGRAPHY
Shashidhar. R: is currently doing M.Tech (VLSI Design and Embedded System) with the department of Electronics and communication engineering, Don Bosco Institute of Technology, Bangalore, V.T.U, belgam, He holds B.E in Telecommunication Engineering in VTU Belgaum.
.