An Analysis of Documents Used by Electronics and Communication Engineering Students at Echelon Institute of Technology
Dr.Dharmveer Singh Bagel R.P.Kulshrestha
Assist. Prof. Library & Librarian
Information Science. Echelon Institute of Technology, Govt. Degree College, Mant, Mathura(U.P.) Faridabad, 121102, Haryana, India.
Introduction
In developing countries like India, Circulation and loan of documents from a library collection is a vital medium for the dissemination of information and knowledge. Circulation of books for home reading maximizes the use of library resources, and helps to meet user needs for research, publication, and instructional activities. Circulation of data is one way of assessing a library. Since circulation of printed material remains important in India, It is appropriate to analyze circulation as a way of guiding the acquisition of books. The growth of information in terms of quality and quantity, the varied subjects of interest to users, increasing costs and limited fiscal resources force librarians to use data for making rational decisions. The present investigation uses circulation records to study the books borrowed from the college library of Echelon Institute of Technology by Electronics and Communication Engineering students.
Echelon Institute of Technology (EIT) is the private Engineering College in the NCR and the state of Haryana, established in 2007, sponsored by Echelon Educational and Welfare Society, Faridabad, Haryana, India. The college has undergraduate course in Electronics Communication Engineering, Mechanical Engineering, Information Technology and Computer Science and Engineering. The college library has 9,000 volumes, 60 National and International journals, DELNET-Database and Library database with Opac, Internet and wi-fi facilities.
Objectives
The following are the objectives of the present study:
To find the number of books used by Second-year Electronics and Communication Engineering students. To determine the authorship patterns, range of publication data’s, and countries of publication of
circulated books.
To prepare a ranked list of most frequently used books. To prepare a ranked list of publishers.
Hypotheses
The following hypotheses have been formulated for testing-
Most books used have a single author and are in the field of Electronics and Communication Engineering. Female students use more books than male students.
All students prefer the newest books.
Students use Indian publications more than those form other countries.
Scope and Limitation
Methodology
Undergraduate students in four areas of Engineering as well as Teaching and Non-Teaching Staff, have access to the library. The investigator selected only Second-year undergraduate students of Electronics and Communication Engineering for this study. The total sample consists of 120 Second -year Electronics and Communication Engineering students, And used the borrowing data of 100 students, based on the entries in their personal borrowing books. Out of these 100 students, 60 are male and 40 are female.
Analysis
Table-1. Books used by gender
Gender
Number of
Students
Number of books
borrowed Percentage Average
Male 60 1442 78.24 22
Female 40 401 21.76 12
Total 100 1843 100 18
Most books (78.24%) were borrowed by male students, with the remaining books (21.76%) borrowed by female students. An average of 18 books was borrowed per student per year.
Table-2. Distribution by number of books used
Seventy percent of students have used twenty or fewer books. S.No
Number of
books Students
Number %
1 1 – 5 22 22
2 6 – 10 17 17
3 11 – 15 21 21
4 16 – 20 10 10
5 21 – 25 7 7
6 26 – 30 6 6
7 31 – 35 5 5
8 36 – 40 3 3
9 41and above 9 9
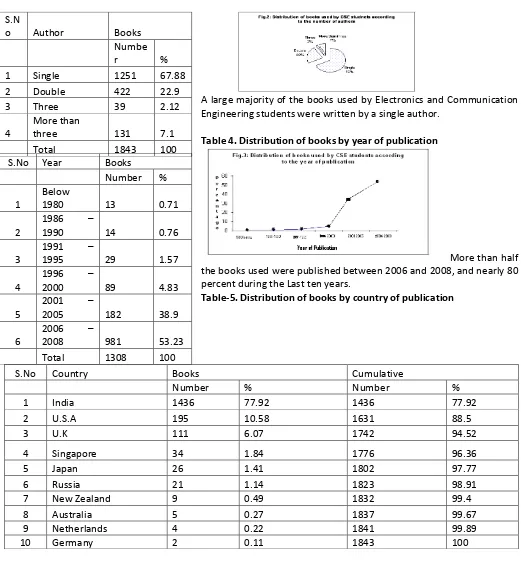
Table 3. Distribution of books by number of authors
A large majority of the books used by Electronics and Communication Engineering students were written by a single author.
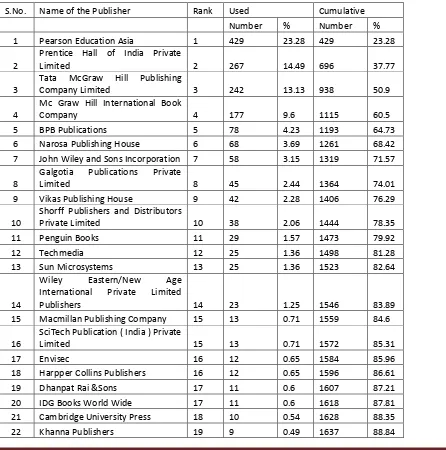
Table 4. Distribution of books by year of publication
More than half the books used were published between 2006 and 2008, and nearly 80 percent during the Last ten years.
Table-5. Distribution of books by country of publication
S.No Country Books Cumulative
Number % Number %
1 India 1436 77.92 1436 77.92
2 U.S.A 195 10.58 1631 88.5
3 U.K 111 6.07 1742 94.52
4 Singapore 34 1.84 1776 96.36
5 Japan 26 1.41 1802 97.77
6 Russia 21 1.14 1823 98.91
7 New Zealand 9 0.49 1832 99.4
8 Australia 5 0.27 1837 99.67
9 Netherlands 4 0.22 1841 99.89
10 Germany 2 0.11 1843 100
S.N
o Author Books
Numbe
r %
1 Single 1251 67.88
2 Double 422 22.9
3 Three 39 2.12
4
More than
three 131 7.1
Total 1843 100
S.No Year Books
Number %
1
Below
1980 13 0.71
2
1986 –
1990 14 0.76
3
1991 –
1995 29 1.57
4
1996 –
2000 89 4.83
5
2001 –
2005 182 38.9
6
2006 –
2008 981 53.23
Table 6. Distribution of books by type of publisher
S.No Publisher Books
Number Percentage
1 Indian 1436 77.92
2 Foreign 407 22.08
Total 1843 100
Going along with the results displayed in the previous table, Table 6 shows that more than three quarters of the books used were published by Indian publishing companies.
Table 7. Distribution of books by ranked list of publishers
S.No. Name of the Publisher Rank Used Cumulative
Number % Number %
1 Pearson Education Asia 1 429 23.28 429 23.28
2
Prentice Hall of India Private
Limited 2 267 14.49 696 37.77
3
Tata McGraw Hill Publishing
Company Limited 3 242 13.13 938 50.9
4
Mc Graw Hill International Book
Company 4 177 9.6 1115 60.5
5 BPB Publications 5 78 4.23 1193 64.73
6 Narosa Publishing House 6 68 3.69 1261 68.42 7 John Wiley and Sons Incorporation 7 58 3.15 1319 71.57
8
Galgotia Publications Private
Limited 8 45 2.44 1364 74.01
9 Vikas Publishing House 9 42 2.28 1406 76.29
10
Shorff Publishers and Distributors
Private Limited 10 38 2.06 1444 78.35
11 Penguin Books 11 29 1.57 1473 79.92
12 Techmedia 12 25 1.36 1498 81.28
13 Sun Microsystems 13 25 1.36 1523 82.64
14
Wiley Eastern/New Age International Private Limited
Publishers 14 23 1.25 1546 83.89
15 Macmillan Publishing Company 15 13 0.71 1559 84.6
16
SciTech Publication ( India ) Private
Limited 15 13 0.71 1572 85.31
17 Envisec 16 12 0.65 1584 85.96
23 Wrox Press Limited 20 8 0.43 1645 89.27 24 S.Chand and Company Limited 20 8 0.43 1653 89.7 25 Arrow Publications 20 8 0.43 1661 90.13
26 LMC 21 7 0.38 1668 90.51
27 Prentice Hall International 21 7 0.38 1675 90.89
28 St. Martin 21 7 0.38 1682 91.27
29 Panram Pub. 22 6 0.33 1688 91.6
30 Bantam 23 5 0.27 1693 91.87
31 Kidarnath and Badarnath 23 5 0.27 1698 92.14 32 Oxford University Press 23 5 0.27 1703 92.41 38 6 publishers 4 each 24 24 1.3 1727 93.71 50 12 publishers 3 each 25 36 1.95 1763 95.66 59 9 publishers 2 each 26 18 0.98 1781 96.64 121 62 publishers 1 each 27 62 3.36 1843 100
Most books that were used were from Pearson Education Asia, followed by Prentice Hall of India (14.49%), Tata McGraw Hill (13.13%), McGraw Hill International (9.60%), and BPB Publications (4.23%)
701 titles and 1,843 volumes were used during the year were used by more students than any other. The top five titles account for 11.55 percent of total borrowing and the 50 titles listed in the table account for 40.68 percent.
Conclusions and Recommendations
There are some conclusions that can be drawn from this data, which could be used to guide acquisition of new material. Students used an average of 18 books during their final year of study. Males used more than females on average (22 vs. 12). Most books had a single author and were published during the ten years preceding the study. In addition, most books were published in India, with Pearson Education Asia being the leading publisher.
Suggestions for Further Research
Studies of a similar nature could be carried out on the use of books by other departments of the college, and at other College Libraries in India. This would add authenticity and a basis for comparative analysis before drawing generalizations and conclusions for optimal use of library resources. Studies could also be undertaken on the use of books by faculty members of this and other college libraries in India.
Reference-1- Ackoff, Russell L., The Design of Social Research, Chicago: University of Chicago Press, 1961.