Registration and quantitative comparison of temporal
mammograms (with application to HRT data)
Konstantinos Marias
BSc, MSc
A thesis submitted in partial fulfilment o f
the requirements for the PhD degree
2002
Registered at
Royal Free Campus and University College Medical School
ProQuest Number: U643223
All rights reserved
INFORMATION TO ALL USERS
The quality of this reproduction is dependent upon the quality of the copy submitted.
In the unlikely event that the author did not send a complete manuscript and there are missing pages, these will be noted. Also, if material had to be removed,
a note will indicate the deletion.
uest.
ProQuest U643223
Published by ProQuest LLC(2016). Copyright of the Dissertation is held by the Author.
All rights reserved.
This work is protected against unauthorized copying under Title 17, United States Code. Microform Edition © ProQuest LLC.
ProQuest LLC
789 East Eisenhower Parkway P.O. Box 1346
Abstract
In order to reduce the high mortality rate of breast cancer, m ost research in mammogram
image analysis aims to develop a CAD (Computer Assisted Detection) system that can
assist the clinician in the difficult task of “early” diagnosis. The comparison of temporal
pairs of mammograms is believed by radiologists to be often crucial for diagnosing
cancer, especially as breast tissue is highly variable across the population making it
difficult to perform diagnosis reliably from a single mammogram. However, changes in
the appearance of mammograms due to differences in compression and imaging
conditions can limit the effectiveness of temporal comparison. In this thesis, a registration
method that aligns temporal (or bilateral) mammograms is presented. This technique has
the potential to assist the clinician to detect changes more efficiently (e.g. interval cancers
in mammogram sequences, architectural distortions or microcalcifications in bilateral
mammograms). In addition, the application of this technique to mammograms of
Hormone Replacement Therapy (HRT) users is investigated. Since long-term use of HRT
can increase the risk of breast cancer (as a side effect o f glandular tissue regeneration),
quantification of temporal tissue density changes (in addition to registration) is needed
for assessing density changes locally. In order to derive quantitative measures of breast
tissue change, the mammogram pairs are processed using the h\nt representation of
interesting tissue. Since such a measure depends on the image information context, we
examine the problems that arise from combining image registration and quantification,
Acknowledgements
I would like to thank the Mike Brady for being always there when I needed him, either as
a supervisor or as a friend. His words never failed to put a smile in my face and to give
me courage.
I would also like to express my sincere gratitude to my supervisors Alex Seifalian and
Santilal Parbhoo as well as Gloria Freilich from Cancerkin Centre, Royal Free Hospital,
for supporting my PhD. Special thanks to Alex for his constant moral support and
guidance and to Mr. Parbhoo for allowing me to attend his clinics during my first year
and helping me understand the clinical problems related to mammography.
I am indebted to Chris Behrenbruch and Ralph Highnam. Chris has been a great friend
and a great colleague. I really enjoyed working and socialising with him. Ralph gave me
lots o f valuable and robust advice all these years.
Many people from the Medical Vision Laboratory in Oxford have been great colleagues
and friends all these years. To Gerardo, Miguel-Angel, Marius, Miguel, Seb, Patrick,
Maud, Albert, Rob, Paul, Michael, Margaret, Guo-fang and Carolyn thank you for your
support and friendship. In particular, thanks to Paul and Carolyn for reviewing my thesis.
Outside work, lots of people stood by me and helped me in difficult times. To Jim,
Susan a, Enrique, Anne, Doros, Christina, Anastasia, Eleana, Adriani and Georgiana
thank you for caring for me.
Finally, I would like to thank my beloved family. My mother Ioanna, my father Teri, my
brother Vasili, my sister Maria, and my grandfather Vasili, to whom I promised a long
Table o f Contents
Table o f Contents
TITLE...1
ABSTRACT... 2
ACKNOWLEDGEMENTS... 3
TABLE OF CONTENTS... 4
LIST OF FIGURES...8
LIST OF TABLES...11
CHAPTER 1: INTRODUCTION... 12
1.1 In t r o d u c t io nto Me d ic a l Im a g e An a l y s is... 13
1.2 Br e a stc a n c e ra n dt h esc r ee n in gp r o g r a m m e...14
1.2.1 Introdu ction...14
1 .2 .2 A sh o rt a n a lysis o f the S creening P ro g ra m m e...16
1.3 Mo t iv a t io na n daim so fo u rw o r k... 18
1.4 Tem po r a lm a m m o g r a p h y...19
1.5 Qu a n t it a t iv ec o m pa r iso no f H R T m a m m o g r a m s... 23
1.6 Ov e r v ie wo fth et h e s is... 26
CHAPTER 2: MEDICAL IMAGE ANALYSIS IN MAMMOGRAPHY... 28
2.1 In t r o d u c t io n...29
2 .2 Im a g em o d a l it iesforb r e a stc a n c e r...30
2 .2 .1 X -ra y m am m ograph y...30
Introduction... 30
Strengths and w eak n esses... 31
2 .2 .2 M R l im aging o f the b re a s t...33
Introduction... 33
Strengths and w eak n esses... 35
2 .2 .3 U ltr a so u n d...36
Introduction... 36
Strengths and w eak n esses... 38
2 .2 .4 N u clea r M edicin e f o r the brea st: P E T a n d S cin tim a m m o g ra p h y...39
Introduction... 39
Strengths and w eak n esses...41
2 .2 .5 C onclusion a n d com parison to X -ra y m am m o g ra p h y...42
2.3 Digit alm a m m o g r a ph ya n d Co m p u t e ra id e dd ia g n o sis (C A D ) s y s t e m s... 45
2 .4 Co n c l u s io n s... 47
CHAPTER 3: REVIEW OF MEDICAL IMAGE REGISTRATION... 50
3.1 In t r o d u c t io n...51
3 .2 Def in itiono fco n c ept sr e la t e dtor e g ist r a t io n... 52
3.3 Cl in ic a l Mo t iv a t io nfor Re g is t r a t io n... 55
3 .4 Sp e c ih c Mo tiv a t io nfor Reg ist r a t io ninthis Th e s i s...57
3.5 Ba sisfo r Re g ist r a t io n... 58
3 .6 Ty p e sofr e g ist r a t io n...59
3.7 An a l y s iso fth e Reg ist r a t io n Pr o c e s s... 60
3.7 .1 O v e r v ie w...6 0 3 .7 .2 E stablish in g co rre sp o n d e n c e s...61
3 .7 .3 T ransform ation...62
Table o f Contents
3 .7 .6 In te r a c tiv ity...6 6
3.8 Al g o r it h m s... 68
3.8 .1 In tro d u ctio n...6 8 3 .8 .2 M utual in fo rm a tio n...6 9 3 .8 .3 O p tica l f l o w...71
3 .8 .4 F lu id R e g is tr a tio n...72
3 .8 .5 C o m b in ed reg istra tio n -in ten sity c o r r e c tio n...73
3 .8 .6 I C P -b a se d a lg o r ith m s...73
3 .9 Re g ist r a t io n As s e s s m e n ta n d Va l i d a t i o n...75
3 .1 0 Ma m m o g r a mre g ist r a t io na n dm a t c h in g: A c h a l l e n g in gp r o b l e m... 77
3 .10.1 In tro d u ctio n...77
3 .1 0 .2 D ifferen ces in b re a s t p o sitio n in g a n d c o m p r e s s io n...79
3 .1 0 .3 D ifferen ces in im agin g con dition s: The n e e d f o r in ten sity n o rm a lisa tio n a s w e ll a s g e o m etric a lign m en t....81
3 .1 0 .4 N ew g ro w th s...82
3 .1 0 .5 H o rm o n a l-R ela ted ch a n g es...83
3.11 Pr e v io u sw o r ko nm a m m o g r a mm a t c h in ga n dr e g is t r a t io n... 84
3 .11.1 In trodu ction...84
3.1 1 .2 M a m m ogram m a tc h in g...84
3.11.2.1 Siew-li Kok-Wiles work... 84
3.11.2.2 Vujovic and Brzakovic’s w ork... 86
3 .1 1 .3 L an dm ark b a s e d R eg istra tio n techniques in m am m o g ra p h y...86
3.11.3.1 Introduction... 86
3.11.3.2 Previous work... 88
3 .1 1 .4 C onclusion on p re v io u s w o rk...89
3 .1 2 Co n c l u s io n- Su m m a r y...90
CHAPTER 4; PROPOSED REGISTRATION FRAMEWORK FOR MAMMOGRAPHY...91
4.1 In t r o d u c t io n... 92
4 .2 Pa r t ia l Re g ist r a t io nu s in gth eb o u n d a r y...99
4 .2 .1 In trodu ction... 99
4 .2 .2 B rea st ou tlin e d e te c tio n...99
4 .2 .3 C u rvatu re a n a ly sis on the b re a s t o u tlin e-co n sisten t lan dm arks...101
4.2.3.1 Defining consistent boundary landmarks using curvature... 101
4.2.3.2 Anatomical significance o f boundary landmarks... I l l 4 .2 .4 P a rtia l re g istra tio n fr o m the b re a st b o u n d a r y...113
4.2.4.1 Overview ...113
4.2.4.2 Interpolative Radial Basis Functions... 114
4.3 Mul t i-sc a l el a n d m a r kselec tio nforim p r o v e dr e g is t r a t io n... 117
4.3.1 In tro d u ctio n...1 1 7 4 .3 .2 S egm en tation o f in tern al structures using w a v e le t-a n a ly s is...1 1 7 4 .4 La n d m a r km a t c h in ga n dr e g ist r a tio nr e f in e m e n t... 119
4 .4 .1 M atch in g in tern a l stru c tu re s...119
4 .4 .2 F inal reg istra tio n using an approxim ation sch em e...122
4.4.2.1 Overview...122
4.4.2.2 Approximating Radial Basis Functions... 122
4.5 RESULTS-VALIDATION... 126
4.5.1 O v e r v ie w...12 6 4 .5 .2 A ssessin g th e im p ro vem en t in reg istra tio n...1 2 9 4 .5 .3 A ssessin g the a c c u ra c y o f re g istr a tio n...133
4 .6 Reg ist r a t io nis s u e sa n da p p l ic a t io n s...136
4.6.1 B ila te ra l m a m m o g ra m s...1 3 6 4 .6 .2 The role o f th e p e c to r a l m u s c le...139
Table o f Contents CHAPTER 5: TEMPORAL ANALYSIS AND BREAST TISSUE QUANTIFICATION OF HRT
SEQUENCES... 146
5.1 In t r o d u c t io n...147
5 .2 Me d ic a l Ba c k g r o u n d... 148
5 .2 .1 T yp ica l h orm on al ch a n g es at m e n o p a u s e...151
5 .2 .2 S ym ptom s o f the m enopause, d isea se a n d rem ed ies...152
5 .2 .3 R ecom m en dation o f HRT, benefits a n d risk s...154
5.3 Effectso f H R T ... 156
5.3.1 In crea sed risk f o r b re a s t ca n cer....156
5 .3 .2 In crease in den sity, ch an ges in p a tte r n...1 5 7 5 .3 .3 D e c re a se in m a m m ograph ie sen sitivity...159
5 .4 Re c o m m e n d e dc l in ic a lm a n a g e m e n ta n dth epo ssibl er o l eo fim a g ea n a l y s i s... 159
5.5 Wh yt h esit eo fd e n s it yc h a n g e siso fp a r t ic u l a rin t e r e s t... 160
5.6 A PROPOSED STRATEGY, THROUGH A COMPUTER AIDED ASSESSMENT OF BREAST CANCER RISK, FOR WOMEN ON H R T ...163
5.7 A NOVEL METHOD FOR ROBUSTLY QUANTIFYING MAMMOGRAPHIC CHANGES IN TEMPORAL HRT SEQUENCES...166
5.7 .1 P re v io u s w o r k...166
5 .7 .2 In troduction to o u r p r o p o s e d tissue qu an tification m e th o d...16 7 5 .7 .3 E xtractin g ro b u st tissu e d en sity q u a n tita tive m easures fr o m m a m m o g r a m s...168
5.8 Desig no fag l o b a lt is s u e-q u a n t ih c a t io nv a l id a t io ne x p e r im e n t...169
5.8.1 In tro d u ctio n...169
5 .8 .2 M ea su res u se d...171
1~) Projected area... 171
2) Sum and V olum e o f interesting tissu e...172
5 .8 .3 E xperim en ts a n d r e s u lts...173
First experiment: Involution and tissue regeneration... 173
Second experiment: W hat happens when “no-change” is reported?... 178
5.9 Ca nw eq u a n t if yl o c a lc h a n g e su s in gr e g ist r a t io n? ... 180
5 .1 0 Vo l u m ep r e se r v in ge l a st ict r a n sfo r m a t io nforl o c a lb r e a s t-t is s u eq u a n t ih c a t io n ... 182
5 .10.1 In trodu ction...182
5 .1 0 .2 The “v o lu m e -p re s e rv in g ” tran sform ation m eth o d...184
5 .1 0 .3 R esu lts a n d c o n c lu sio n...185
5 .1 0 .3 A v a lid a tio n e x p e r im e n t...190
5.11 Su m m a r y... 193
CHAPTER 6: DISCUSSION AND FUTURE WORK... 197
6.1 Co n c l u s io n s... 198
6.2 Lim it a t io n s... 200
6.3 Id e a sforfu t u r ew o r k...201
6.4 In it ia lr e su l t so nt e x t u r ese g m e n t a t io n... 202
6.4.1 In trodu ction...202
6 .4 .2 M e th o d...203
6 .4 .3 R e s u lts...2 0 4 6 .4 .4 D is c u s s io n...2 0 5 6.5 Ex t e n s io no fr e g ist r a t io ntootherm o d a l it ie s...207
6.5 .1 X -ray, 3d-M R I d a ta f u s io n...2 0 7 6 .5 .2 X -ra y -N u c le a r m ed icin e d a ta fu sio n...211
6 .6 F u t u r e w o r k o n H R T s e q u e n c e s ... 212
6.7 FINAL STATEMENT... 213
APPENDIX A: BREAST ANATOMY, PHYSIOLOGY AND PATHOLOGY... 214
1 An a t o m ya n d Ph y s io l o g yo fth e Fem a l e Br e a s t... 215
2 Pa t h o l o g y... 216
Table o f Contents APPENDIX B: WAVELET SEGMENTATION OF INTERNAL REGIONS IN MAMMOGRAMS
220
1. In t r o d u c t io n... 221
2 Ov e r v iewo f Wa v e l e t Co n c e p t s... 221
3 Wa v e l e t Pa c k e t s...2 2 4 4 Be s t Ba s is Se l e c t io n... 2 27 5 Choiceo f Wa v e l e t Pa c k e t... 2 3 0 6 Ex t e n s io no f Wa v e l e t Pa c k e t st o Im a g e s (2 D )... 231
7 Fe a t u r e Ex t r a c t io n...233
APPENDIX C: THE Hint REPRESENTATION...237
1 In t r o d u c t io n...238
2 Co m p u t a t io no ft h eh in ts u r f a c e...239
APPENDIX D: BASIC CONCEPTS RELATED TO DIAGNOSTIC TESTS...241
APPENDIX E: GALLERY OF RESULTS... 245
LIST OF PUBLICATIONS... 279
List o f Figures
L i s t o f F ig u r e s
F ig u re 1: Temporal mammograms of the same patient, over a period of 8 years...21
F ig u re 2: The same series of temporal mammograms (as in Figure 1) registered to the same co-ordinate frame of the m ost recent...22
F ig u re 3: A registration example in a HRT mammogram p air...25
F ig u re 4: The different modalities involved in breast-cancer image analysis...29
F ig u re 5: Enhancement in breast M RI by using contrast d y e ...34
F ig u re 6: The pharmacokinetic model separates high enhancement tissue structures (e.g. tumours) from low enhancement voxels (e.g. corresponding to fat) in M R I...34
F ig u re 7: Ultrasound images of the breast...37
F ig u re 8: Correct patient positioning in scintimammography im aging...40
F ig u re 9: Scintimammogram showing multi-centric and multi-focal cancers... 40
F ig u re 10: Using scintimammography for evaluating chem otherapy... 41
F ig u re 11: A bilateral mammogram p air...78
F ig u re 12: Temporal mammograms illustrating the most common changes...79
F ig u re 13: A differential compression mammogram pair illustrating the changes due to different com pression... 81
F ig u re 14: An example o f an interval cancer illustrating the relevant problems in registration... 83
F ig u re 15: The basic steps of our breast registration algorithm ... 95
F ig u re 16: The method for extracting the breast outline...97
F ig u re 17: Consistent landmarks in the CC and ML “idealised” outlines... 99
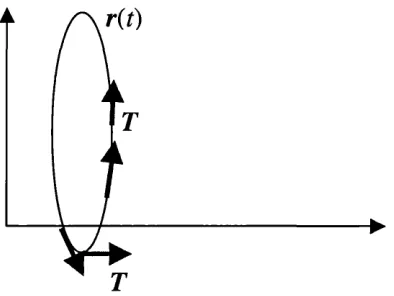
F ig u re 18: An example of a parametric curve r(r). The rate of change of the unit tangent vector T is the curvature... 100
F ig u re 19: Positive and negative curvature segments in a temporal pair (in 2D and 3D )... 102
F ig u re 20: The maximum curvature detection algorithm ... 103
F ig u re 21: Multi-scale extension of the maximum-curvature detection algorithm ...105
F ig u re 22: The “unfolded” curvature profile for various sam plings... 106
F ig u re 23: Defining the optimum sampling Sopt at the point where the detection of curvature maxima converges to a steady solution... 107
List o f Figures
F ig u re 25: The scale space “stack” for robust detection of mammogram structures and a schematic representation of the detection o f features through the scale-space... 115
F ig u re 26: Segmented “significant” regions (using the m ulti-scale segmentation) of a temporal pair superimposed and the use of the boundary as a rejection criterion for possible internal m atches...117
F ig u re 27: Transformed grids illustrating the difference if instead of interpolation an approximation scheme is adopted... 121
F ig u re 28: The two-stage registration algorithm on a m ammogram pair... 124
F ig u re 29: Difference image after registration for the exam ple in Figure 2 8 ... 124
F ig u re 30: The orthogonal grid, the deformed grid for the partial transformation and the deformed grid after the final registration... 125
F ig u re 31: A validation experiment for the accuracy of the proposed registration
fram ew ork... 127
F ig u re 32: An exam pleof a bilateral pair o f mammograms w ith the segmented
“significant” regions superim posed...128
F ig u re 33: An exam ple of bilateral mammogram registration... 130
F ig u re 34: An example showing the risk of increased error if the pectoral muscle is included in the reg istra tio n ... 132
F ig u re 35: An exam ple of registration in a mammogram pair of a patient that developed an interval cancer... 134
F ig u re 36: A simple model to explain breast tissue changes due to H R T ... 148
F ig u re 37: Geographical distribution o f cancers in the b reast... 150
F ig u re 38: A proposed strategy for assessing the risk of cancer in H RT users 152
F ig u re 39: A representation of the calculation of the /imt representation... 156
F ig u re 40: Interactive thresholding is performed in order to include all the dense tissue in each m am m ogram ...159
F ig u re 41: Results on the agreement between quantitative measures and clinical ground truth for the “tissue regeneration” p a i r s ...163
F ig u re 42: Results on the agreement between quantitative measures and clinical ground truth for the “involution” pairs... 164
F ig u re 43: Results on the agreement between quantitative measures and clinical ground truth for the “no-change” p airs... 166
F ig u re 44: Registration and intensity comparison of an H RT mammogram p air...169
F ig u re 45: A synthetic example highlighting the reduction in image volume after applying a non-rigid transform ation... 170
List o f Figures
F ig u re 47: The intensity correction algorithm for the deformed square in Figure 45.... 173
F ig u re 48: Calculation of the intensity correction field in a temporal HRT p a i r 175 F ig u re 49: The application of the intensity correction algorithm for the example shown in Figure 4 8 ...176
F ig u re 50: Validation of the intensity correction method using a differential compression mammogram pair, represented using the him representation... 178
F ig u re 51: Results for the mammogram pair of Figure 5 1 ... 179
F ig u re 52: Texture segmentation of the pectoral m uscle...190
F ig u re 53: A temporal mammogram p air... 191
F ig u re 54: Texture clustering for the temporal pair in figure 5 3 ... 191
F ig u re 55: The pharmakokinetic projection o f the 3D MRI volum e... 194
F ig u re 56: Data fusion between 3d MRI and m ammography...194
F ig u re 57: Visual comparison of the “pseudo mammogram” (on the left) and the mammogram show a good correspondence o f features... 195
F ig u re 58: Registration of the ML projection of the MRI volum e...195
F ig u re 59: A mammogram and a nuclear m edicine scan of a dense b r e a s t...196
F ig u re A l: Basic Anatomical Features of the M ature Female B reast...215
F ig u re B l: A simple wavelet function...222
F ig u re B2: The process of dyadic wavelet decom position...223
F ig u re B3: An exam ple discrete wavelet analysis... 224
F ig u re B4: A tree representation showing the additional decom position components of wavelet packets, compared with the basic DW T case...225
F ig u re B5: A com parison between DWT and DW PA representation... 226
F ig u re B6: An exam ple scale-space analysis... 230
F ig u re B7: Exam ple Coiflet wavelet packets... 231
F ig u re B8: The im plementation o f wavelet packet analysis for d = 2...233
F ig u re B9: A small section of a digitised mammogram containing two calcifications is decomposed into the wavelet scale-space... 234
F ig u re BIO: Segmentation results for the small region of a m am m ogram ...235
F ig u re B l l : An exam ple of wavelet-based feature detection and segmentation of a m am m ogram ...236
List o f Tables
List o f Tables
Table 1: The main benefits of mammography vs. the rationale for using alternative
modalities in clinical practice... 44
Table 2: Assessment of the anatomical significance of the three detected points using the maximum curvature detection algorithm ... 109
Table 5: Cycle phases of the menstrual cycle and hormones in v o lv e d ... 139
Table 6: “Safe” against “not recom mended” H R T ... 142
Table 7: Data used for quantification experim ents... 157
Table 8: The rule to assess mammographie changes due to HRT, from m easuring the % normalised difference in “interesting” tissue between the HRT sequences... 161
Table 9: Results on the agreement between the quantitative measures used and the clinician, concerning tissue changes...162
Table 10: Quantitative comparison of the whole mammogram volume and the segmented cancer before and after intensity correction... 179
Table 9: Aims, motivation and conclusions for the registration w ork presented in this thesis... ^...183
1.1 Introduction to Medical Image Analysis
1.1 Introduction to Medical Image Analysis
Over the past two decades, medical image analysis has employed several image
processing and computer vision concepts to enhance, describe and process digital images
in order to improve their clinical utility. This is a part of a larger scale application of
technology to medicine that has been inspired by the development of increasingly
powerful computers and has made a huge impact on modem clinical medicine.
Medical images of human organs can assist a clinician in diagnosis, surgical planning and
intervention and evaluation of therapy. Furthermore, functional imaging as well as
histological imaging, can assist the exploration of complex physiological (or
pathological) processes in the human body. Some specific areas of research include:
Surgical planning and guidance: Preoperative data are used for planning the surgery
more efficiently; the surgeon performs the operation guided by image data acquired at
the time of the operation.
Evaluation of therapy: This involves the accurate comparison of temporal data for
evaluating the effectiveness of a specific therapy against a disease.
Tele-medicine applications:
• Remote diagnosis: The expert can establish diagnosis (or give a second opinion)
by exam ining medical data from remote locations.
• Tele-surgery: surgery that is supervised or aided by a surgeon located remote
from the scene o f the operation.
A ssisted diagnosis through:
• Enhancement and characterisation, to remove noise or to m anipulate the contrast
characteristics of a region o f interest and to describe the texture (e.g. homogenous
1.1 Introduction to Medical Image Analysis
• Comparison of temporal data of the patient, or data from different modalities.
• Anatomical or physiological “models” of normal variation, in order to
automatically detect regions that potentially exhibit an abnormality.
• Clinical databases for differential diagnosis.
The specific motivation for this thesis is breast cancer. The main objectives o f breast
cancer imaging are:
• Early diagnosis of the disease and reduction of the number of missed cancers (false
negatives) so that mortality rates reduce.
• Reduction of the number of false positives that often lead to unnecessary biopsies and
consequently to psychological traum a for the patient.
• Analysis of the image changes that correspond to the effects of therapy for assessing
the success of a specific drug in treating the cancer.
A detailed account o f breast anatomy, physiology and pathology can be found in
Appendix A of the thesis.
Medical image analysis has provided sophisticated imaging techniques which may assist
the interpretation o f radiological images. It has a crucial role to play in providing the
clinician with objective anatomical and quantitative inform ation directly from
mammograms. In this chapter, the role of the breast-screening programme is discussed
with special emphasis in the need for image analysis tools to improve its effectiveness,
and the key components of the thesis are summarised.
1.2 Breast cancer and the screening programme
1.2.1 Introduction
In the western world, breast cancer is the most common cancer among women. In the
1.2 Breast cancer and the screening programme
cancer cases. It is the primary diagnosis in a total of 157,000 cases annually and kills
almost 70,000 annually [1]. As already m entioned in the introduction of this chapter,
technological advances in breast cancer imaging are aimed at early diagnosis. Although
mammography remains the predominant modality for breast cancer screening and
diagnosis, an increasing number o f modalities (e.g. contrast-enhanced Magnetic
Resonance Imaging (MRI), Scintimammography) have been used in clinical practice (as
is discussed in the next chapter). However, technological advances in breast imaging
alone cannot tackle the problem; government-defined, global health strategies for the
early diagnosis of the disease are required as well. Over the last 40 years, the ideas of
using the technology for the early detection of breast cancer in a whole population rather
than on an individual-basis (and very often post-symptomatic) assessment, have evolved,
particularly in so-called screening programmes.
The first large-scale trial undertaken in New York (between 1961 and 1967) was
successful as women who had a cancer detected had a much higher probability of the
lesion being pre-invasive [2] and hence good prognosis. However, it was not until 1976,
when the first screening program with randomised, controlled, population-based trials
was introduced in Sweden [3]. It demonstrated a nearly 30% reduction in mortality
against women that did not participate and many European countries followed this
example.
In The United Kingdom, the design of the first screening programme was undertaken by
a working group under Sir Patrick Forrest, whose report was accepted by the government
in 1986. X-ray mammography was proven to be a cost effective imaging modality for
national screening. However, mammography is not diagnostically useful for younger
women as their breasts consist mostly of glandular tissue which often masks masses (both
benign and diseased tissue have very “bright” mammographie appearance). As a
consequence, the U K screening programme was established for women between 50 and
64. The im plementation o f the screening programme has involved the establishment of
1.2 Breast cancer and the screening programme
This led to several implications for hospital radiology departments. Before the
implementation of the screening programme, the detection o f masses was as a result of
women reporting to their general practitioner with a breast lump, breast pain or other
pathological indicators. In most cases these women were referred directly to the
symptomatic unit where the mammograms were examined by radiologists who were not
always very experienced in reading mammograms. Today, in the UK, many specialist
screening centres are staffed by radiologists specialised, often exclusively, in screening
mammography. However, there is a critical shortage of radiologists trained to read
mammograms while the amount of patient data is steadily increasing.
Because of the screening programme, small and usually non-palpable masses are
increasingly detected. As a result, the radiologist’s task has become more complex since
the interpretation of the mammogram has becomes more challenging. A cancer that
appears in the screening interval is known as an interval cancer. The large number of
interval cancers leads to the conclusion that the Forrest report was over-optimistic [4].
1.2.2 A short analysis of the Screening Programme.
Breast screening programmes were introduced in order to reduce the overall mortality
rate. Screening is defined as the process of inviting a specific population to undergo
particular examinations which may detect whether or not a given disease is present [2,3].
In general, a breast-screening programme is based upon combinations of mammography
and clinical examinations. The main parameters that can define the effectiveness of the
screening programme are:
• Design o f the screening programme. This includes defining the age group to be
invited, design of the clinical process (e.g. first mammogram acquisition then reading
1.2 Breast cancer and the screening programme
X-ray image-acquisition and quality. This is usually a trade-off with patient
radiation dose.
Proper-positioning and breast compression. The entire breast should be imaged
(including the axilla) and compression should be optimal in terms o f glandular-tissue
separation.
Level of medical expertise. The early detection o f a lesion is strongly dependent on the experience of the radiologist that reads the mammogram.
Consistency. For a screening programme to be successful, it is necessary to ensure
that the clinical protocol is consistent in order to facilitate individual and population
comparison. This is very challenging to ensure in practice.
In the typical scenario, mammograms are acquired in regional screening units and
subsequently examined in reading centres where the decision to recall a woman for
further assessment is made. In the UK, more than 200 radiologists are employed in the
national screening programme and the expected screening output is around 5000 cases a
year [5]. When reading a patient’s mammograms, the clinician compares them with
previous ones in order to detect changes. This fact is an im portant motivation for this
research as is discussed in the next chapter. Temporal comparison is an important aspect
of future CAD (Computer-aided detection or diagnosis) systems that are expected to
improve the cancer detection rate.
In summary, breast screening is a cost effective technique that has contributed to the
early detection of breast cancer as small, non-palpable masses can be detected sooner.
However, greater clinical efficiency and skill is required to deal with the large amount of
data particularly as a significant number of cancers are missed. The rapid development of
digital mammography has further encouraged the development of computer algorithms
1.2 Breast cancer and the screening programme
thesis) still use digitised m am m o^am images (films are usually digitised using a laser
scanner).
It is hoped that future use of software will improve the effectiveness of the screening
programme, mainly by assisting less experienced radiologists in the early detection of
breast cancer and by reducing the variability in standards o f the in-service performance.
The work presented in this thesis is concerned with the development of software
tools that allow a more efficient comparison of temporal or bilateral mammographie
data. More specifically, the aim is to develop a technique to align mammogram
sequences. The motivation for this work is detailed in the next sectioned while section
1.4 summarises the work on temporal manunogram registration. As will be discussed
later in section 1.5, this method can be adapted for local quantitative analysis of HRT
(Hormone Replacem ent Therapy) temporal mammogram pairs.
1 3 Motivation and aims o f our work
M ost of this work is motivated by the reported limitations o f the screening programme in
cancer detection. It has been reported that 27% of the m issed interval cancers (cancers
that “appear” within the screening interval) could have been detected in the previous
mammogram [6] and that many of such missed diagnoses are attributed to observer errors
[7]. Our w ork in mammogram registration aims to assist the clinician to detect
differences in the com parison of temporal data when reading the mammogram. The
results of the thesis are currently being exploited under licence from Oxford University
by a software company (http://mirada-solutions.com).
As m entioned previously, there is a need for reliable medical image analysis tools that
can assist radiologists (especially the less experienced) to read mammograms and detect
subtle changes. In each screening visit, the radiologist usually compares the current
mammogram of a patient with previous ones in order to detect changes that could make
1.3 Motivation and aims o f our work
second, and third, round o f breast screening is increasing rapidly the need to compare
mammograms becomes more pressing.
The work on temporal mammography aims to provide a com puter-based framework for a
more effective and intuitive comparison of temporal (or bilateral) data. Section 1.4,
further explains the nature of the work on temporal mammography.
The second clinical problem that motivated the work presented in this thesis, is the
controversy over the increased risk of breast cancer for H ormone Replacem ent Therapy
(HRT) users. It has been suggested that hormone-stimulated tissue regeneration can in
some cases lead to the development o f an abnormality. Changes in breast-tissue density
are crucial for assessing the response of the woman to therapy, while knowledge o f the
distribution of such changes can assist the clinician to determine whether there is an
increased risk of cancer for the individual woman. To date, it is not possible to obtain
quantitative information from mammograms. The objective is to develop tools that can
facilitate the quantitative comparison of H RT mammogram sequences. HRT data are
considered as a special application of temporal mammography, where there is an
additional need to quantitatively compare each mammogram pair. In section 1.5 a short
account o f the work on H RT data is provided.
1.4 Temporal mammography
M ammogram images are highly variable. For this reason it is currently impossible to
define a consistent method for comparison. Worse, clinical signs are often subtle. For
these reasons, the radiologist’s most powerful weapon is change detection. As was
discussed in the previous section, screening programs have been implemented in many
European countries, (the UK, Sweden, Finland and the Netherlands being the major
examples) as an attempt to reduce mortality attributed to breast cancer through early
diagnosis. This has also affected clinical diagnosis since temporal sequences of
1.4 Temporal mammography
mammograms of the same patient. Since screening re-visits are increasing, more
temporal data is becoming available to the clinician, m aking temporal comparison of
mammograms an absolute necessity in clinical practice. Sim ilar to bilateral comparison,
the clinician compares the most recent mammogram with previous ones in order to detect
abnormalities on the basis of “significant” differences. In the rem ainder o f this thesis this
process will be called temporal mammography. As was m entioned before, the main
objective of this work is the development of tools for the alignment of temporal
mammogram.
In Figure 1, temporal sequences of the same patient spanning 8 years are shown. Such
sequences provide considerable information about the temporal changes in breast tissue
and can assist diagnosis, since any significant difference in the architecture of the breast
tissue over time can be considered as a candidate region for a malignancy. In Figures 1
(d) and (e), the region pointed with arrows could have been confused with a recurrent
cancer. In Figure 2, however, after registering all the previous images (with the method
that is described in chapter 4), it becomes obvious that these regions correspond to scar
1.4 Temporal mammography
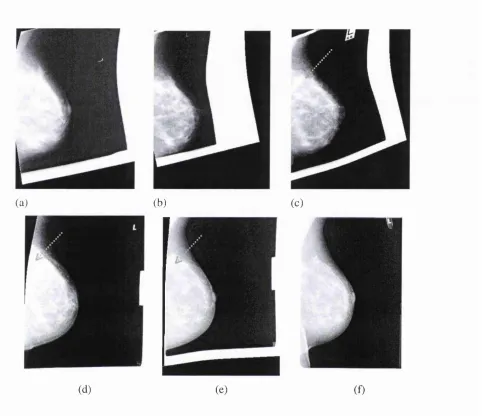
Figure 1: Series of temporal mammograms of the same patient, over a period of 8 years:
(a) the oldest and (f) is the most recent. Breast cancer was diagnosed in (c) in the Upper
Outer Quadrant (UOQ) of the breast, and was excised. Looking at the images from (a) to
(f), it can be noticed that the architecture of the breast-tissue is preserved although the
tissue is displaced non-rigidly between images. The reduction of brightness in several
areas due to involution is also noticeable. In (d) and (e) there is a bright region (see
1.4 Temporal mammography
(a) (b) (c)
(d) (e) (f)
F ig ure 2: The same series of temporal mammograms (as in Figure 1) registered to the
same co-ordinate frame of the most recent, (a) the oldest and (f) is the most recent one.
Breast cancer was diagnosed in (c) in the Upper Outer Quadrant (UOQ) of the breast, and
was excised. Looking at the images from (a) to (f), it can be seen that the architectural
similarity is more pronounced when looking at the registered mammograms. This way, it
becomes easier to follow the evolution of regions over time and it becomes easier to
understand that the bright region in (d) and (e) is scar tissue after the cancer in the upper
1.5 Quantitative comparison o f HRT mammograms
1.5 Quantitative comparison o f HRT mammograms
A topical and increasingly important clinical application of temporal mammography is
the analysis of mammogram sequences of Hormone Replacem ent Therapy users (HRT).
As is discussed in detail in chapter 5, HRT can stimulate glandular tissue regeneration,
which results in an increased tissue density. As a consequence, it is possible to develop
breast cancer while diagnosis becomes more difficult due to the overall increase in
brightness.
The first objective was to apply the temporal registration techniques developed to
monitor changes wrought by HRT. Working closely with experienced clinicians, several
issues that are of specific importance in temporal HRT data were identified:
• If the HRT user responds to therapy, the tissue density and/or the mammographie
pattern can change significantly. In this case, as discussed in chapter 5, the HRT-
induced pattern should be used as the new baseline for temporal comparison.
• Since cancers in HRT users are related to the hormone-stimulated increase in
fibroglandular tissue, it is crucial to be able to m onitor such changes in density.
This becomes even more necessary since mammographie sensitivity can decrease
due to the increased density.
Changes due to HRT can be characterised either on a global or on a local basis.
Global changes represent the overall response to exogenous hormones, while
local changes reflect the fact that breast-tissue receptivity to hormones is variable.
From a more clinical (rather than theoretical) point of view, certain locations in
the breast have a higher frequency of cancer appearance (e.g. the upper outer
quadrant) and it is believed that they exhibit a higher activity and are therefore
1.5 Quantitative comparison o f HRT mammograms
From these observations, it became apparent that image analysis tools could influence
clinical decision making for H RT users and could assist the clinician to assess the risk of
cancer for an individual woman using HRT, Since it is recom mended that the first HRT
mammogram be used as a baseline mammogram, new growths may be detected on the
basis o f significant differences with previous mammograms (via registration). Figure 3,
shows a temporal H RT mammogram pair. After registration (using the method that is
described in chapter 4), two new regions are pronounced in the difference image (Figure
3 (d)). The first corresponds to a density increase while the second corresponds to a
cancer.
HRT mammogram sequences may be considered as a special case of temporal
mammography where the increased risk of cancer requires a careful study of the changes
in breast tissue density. For this reason, further to the work on temporal registration, a
temporal quantification scheme was necessary to enable the clinician to assess density
changes in a woman that responds to HRT. The quantitative measures proposed were
based on the hmi representation of interesting tissue, developed by Highnam and Brady
[4] (summarised in Appendix C of the thesis). This way, images are normalised for
differences in imaging conditions and each pixel value of the Amt image can be correlated
to the underlying anatomy. To validate the proposed measures of density change, they are
com pared to the clinician’s assessment of tissue changes in 60 HRT temporal pairs.
In chapter 5, the potential to use registration for quantification of local changes is also
investigated. Combination o f temporal registration with the representation could
enable the quantitative assessment of local density changes. To overcome the change in
image “volum e” (i.e. the sum o f the hmi values in the image) due to registration, a method
that preserves the “volum e” by calculating an intensity-correction field directly from the
7.5 Quantitative comparison of HRT mammograms
(a) (b)
(c) (d)
Figure 3: (a), (b): An HRT mammogram pair. In (c), the recent mammogram (b), is
registered to the previous one (a). The difference image in (d) highlights 2 new regions.
The first one corresponds to a density increase (arrow “ 1” in (d)), while the second one to
1.6 Overview o f the thesis
1.6 Overview o f the thesis
Chapter 2 summarises the main applications of com puter vision in mammography,
highlighting the significant role that CAD (computer aided diagnosis) tools may play in
the future. After describing the limitations of X-ray mammography, the main
characteristics of the most im portant imaging modalities that are used today in clinical
practice are presented, stressing the need to combine inform ation not only from the same
modality over time (e.g. temporal mammogram registration) but also from different
modalities (data fusion).
Chapter 3 is an analytical review o f the registration problem in medical image analysis.
The different categories of registration applications are discussed, and some of the more
popular techniques that have been developed to implement registration in medical image
analysis are summarised. After describing the specific characteristics and requirements of
mammogram registration, the relevant previous work on m anunogram matching and
registration is presented.
Chapter 4 is a description of the proposed method for mammogram registration. The
robust estimation of boundary landmarks is explained and mammograms are first aligned
using only the boundary. Providing that the breast is not fully involuted*, a multi-scale
technique to segment regions of dense tissue inside the breast is used. M atching these
regions and including their centroids as internal landmarks can im prove registration.
Validation results are presented as well as results on registration showing the possible
applications of the technique.
Chapter 5 is a description o f the work on HRT sequences. First, a detailed review of
clinical studies is presented, in order to understand the importance o f the clinical problem
as well as the controversy concerning several issues related to the use of HRT. Then the
potential o f the proposed work in influencing clinical decision-making and assisting the
1.6 Overview o f the thesis
discussed. Validation results for the proposed measures of global tissue-density change
are presented. Finally, a novel method that can potentially enable the com bination of
image registration w ithout significantly changing the image volum e (sum of the /imt
values) is proposed and a validation experiment is presented.
Chapter 6 summarises the work presented in the thesis and makes explicit its limitations.
Then, several suggestions for improving the methods proposed are discussed. Finally,
some preliminary results on texture segmentation are presented and the thesis concludes
with a discussion on some recent advances in breast imaging data fusion between MRI
and x-ray mammography.
Appendix A is an overview on breast anatomy, physiology and pathology
Appendix B is a description of the multi-scale segmentation technique that was applied in
chapter 4 to segment internal regions in each mammogram.
Appendix C is an overview o f the /imt representation that is used in chapter 5 to normalise
a mammogram pair and to build reliable quantitative measures of tissue-change.
Appendix D is a summary of the m ost common definition of terms related to diagnostic
tests. The aim of this appendix is to help the reader better understand several references
to clinical studies included in the thesis.
Appendix E i s a gallery o f results of mammogram registration. These include temporal
mammograms, interval cancers, bilateral mammograms and H RT pairs. For each pair the
transformed image is shown, as well as the subtraction image after registration and in
certain cases the jo in t histograms and additional notes to describe the importance of the
2. / Introduction
2.1 Introduction
In this chapter, the various applications of medical imaging to breast cancer are
discussed, emphasising the specific areas where our work aims to contribute. The main
role of medical images is their use in patient management, starting from diagnosis (e.g.
breast screening using X-ray mammography) through to surgery (surgical planning and
image assisted surgery) and into therapy (e.g. assessment of therapy). Figure 4 shows a
tree diagram of medical image analysis applications, focusing on breast-cancer imaging
and showing the different modalities involved in clinical management. For each of these
modalities research aims to develop computer applications that can assist the clinician to
understand the underlying pathology. As shown in the diagram, our work is focussed in
two areas that seem certain to play a role in the computer-assisted interpretation of digital
mammograms.
X-ray
MRI
US
Q u an titativ e analysis N u c le a r M e d ic in e
Mammogram registration
M edical Image A nalysis
Assisted interpretation o f m anunogram s
M ass
detection/characterisation M icro calcificatio n
d etectio n /ch aracterisatio n
Breast Cancer Image A n alysis-C A D System s
F igure 4: The different modalities involved in breast-cancer image analysis. Our work is
2.1 Introduction
In the remainder of this chapter, the more important modalities for breast cancer imaging
are briefly presented and compared to X-ray mammography that is more important for
the w ork presented in this thesis. In addition, the areas of development of CAD
(Computer Assisted Diagnosis) systems for mammography are discussed. Finally, the
possible applications of the presented work are considered in the context of medical
image analysis.
2.2
Image modalities fo r breast cancer
2.2.1 X-ray mammography
Introduction
A mammogram is a specialised x-ray image of the breast. M ammography is the oldest
but still the most valuable technique for breast imaging. The historical evolution of
mammography can be summarised as follows:
• 1913: The first work on mammary roentgenography is reported [8].
• 1956: Large-scale mammographie screening was proposed, aiming in the early
detection of cancerous, non-palpable masses [2].
• Early 70s: The introduction of the screen-film system, replacing the direct
exposure film [4,8]. The intensifying screen placed under the film reduced the
radiation dose to the patient and the exposure time required.
• 2000: G B’s full field digital scanner, Senograph™* gains approval from the US
Food and Drug Administration (FDA), for the reading o f mammograms printed
on film [9].
To obtain a mammogram, the breast is compressed between two plates, situated between
the x-ray source and the detector, which is usually a film. Inside the breast, each x-ray
2.2 Image modalities fo r breast cancer
Where lo is the incident x-ray intensity, 1 is the resulting intensity o f the x-ray beam
exiting the tissue, dx is the thickness of the tissue and /a is the linear attenuation
coefficient of the tissue. The different types of tissue inside the breast have different
attenuation coefficients. This is why they attenuate and absorb different proportions of
the x-ray beams. These differences are finally translated into different intensities in the
exposed film. In film-screen mammography the single em ulsion film is in contact with an
intensifying screen which acts as a photon-amplifier.
In order to reduce the radiation dosage and to produce a roughly even thickness, the
breast is com pressed between two plates. This way, image quality is improved and is
(roughly) uniform across the mammogram. That happens because if the breast were
simply placed between the source and the detector, according to Beers Law, variation in
the attenuation thickness due to the shape o f the breast would subsequently cause a
variation in the quality o f the resulting image. The breast tissue distortion due to
compression is not considered to produce artefacts in the resulting image. Usually two
different views of each breast are obtained a cranio-caudal (CC) and a 45° medio-lateral
(ML), in order to improve the diagnostic value o f mammography.
One other interaction between x-rays and tissue is an exam ple o f Compton scattering,
where the path of the photons is altered after collision with breast tissue. Such photons do
not follow the path perpendicular to the detector, hence they cause image distortion. This
phenom enon is restricted in practice by placing a grid before the detector, in order to stop
photons that are not perpendicular to the detector, reaching the detector. However, this
results in a substantially increased radiation dose to the patient. The anti-scatter grid can
be modelled and removed using the /imt representation of interesting tissue (described in
the A ppendix C of the thesis) [4].
Strengths and weaknesses
2,2 Image modalities fo r breast cancer
Good signal-to-noise ratio and high spatial resolution (~0.1 mm) resulting in a
detailed representation of breast anatomy.
Affordable cost, so that it can be used as the main screening technique and to be
widely available in hospitals
Good sensitivity (in [10], is reported to be 90%), for postmenopausal women.
Its effective for microcalcification detection and pathology (in particular Ductal
carcinoma in situ)
Although mammography remains the most reliable technique for diagnosing breast
cancer, it has a number of significant limitations:
• The woman receives a radiation dose each time she has a mammogram.
Breast compression cannot be tolerated by all patients. It also results in a non-
rigid tissue motion, making the reading and temporal comparison of
mammograms harder.
The dense glandular tissue in the breasts of younger women results in bright, low
contrast mammograms, thus making detection o f masses a difficult task and
imposing an age constraint on the use of mammography, as has been shown to be
diagnostically useful only to post-menopausal women.
It is obvious that the intensity of the x-rays reaching the film depends on the path
taken through the breast and the resulting image is a 2-D representation of the 3D
compressed breast tissue. This is a significant drawback of x-ray breast imaging
since important tissue features may overlap or be occluded. In addition, surgeons
2.2 Image modalities fo r breast cancer
Since imaging anatomical information is taken at a single instance, mammography
cannot provide functional information (e.g. tum our angiogenesis, activity or increased
blood flow). In addition, mammography is not very effective in evaluating the
effectiveness of chemotherapy, since the adenosis and neovascularity around the
tumour cannot be distinguished clearly by examining the film.
Besides dense tissue, it can be non-diagnostic (or equivocal) in women with breast-
implants, scar tissue (can appear as a cancer), lum py breasts (with diffuse areas of
increased or decreased density) and for multi-focal or multi-centric lesions where the
extent of the cancer may be underestimated. In addition, the specificity in
differentiating benign to malignant masses has been reported to be 20-50% [11,12],
which reflects the high number of false positives.
Nevertheless, to date, film-screen mammography is the m ost im portant technique used in
clinical practice. Recently, it was reported that mammography currently offers the best
performance with respect to cost [13].
2.2.2 M R I im ag in g o f the b reast
Introduction
Nuclear Magnetic Resonance imaging is based on the magnetisation of human tissue.
This is done first by applying an external magnetic field and then an additional RF pulse
in order to displace and measure the tissue magnetisation M using an appropriate coil.
Translating signals that come from different tissues into intensities at the corresponding
points produces the MR image. The strength of each signal and subsequently the contrast
is proportional to the magnetisation of each tissue in the xy plane (transverse
magnetisation) [14,15]. In particular, the intensity of a pixel in a grey-level M R image is
directly proportional to the strength of the signal em itted from a tissue voxel [15].
Subcutaneous fat emits a particular strong signal, and appears very bright in the MR
2.2 Image modalities for breast cancer
Various Nuclear Magnetic Resonance (NMR) signals can be generated by manipulating
M with suitable RF pulses (e.g. spin-echo pulse sequence [15]). Despite the continuous
efforts, a pulse sequence that can distinguish between healthy tissue and tumour has not
been developed yet. For this reason, is more effective to use MRI in combination with a
contrast agent. In that way the dynamic behaviour of different structures within the breast
can be monitored (functional imaging). In particular malignant tumours exhibit an
increased vascularity, since they begin to grow their own blood supply network [14]. For
that reason when the contrast agent is distributed, malignant masses enhance faster. This
is illustrated in Figure 5.
I » Ay L ^
F igure 5: Enhancement in breast MRI by using contrast dye (images taken from [19])
90
“Interesting” tissue data / — — / ' M odel fitted for high
enhance m e n t /t r c W
M odel fitted for fat
Fatty tissue data
DO n 23 4 5
Enhancement time
(b)
F igure 6: The pharmacokinetic model separates high enhancement tissue structures (e.
2.2 Image modalities fo r breast cancer
Enhancement models have been introduced in order to detect regions o f high
enhancement such as tumours. Figure 6, shows the model fitted for high and low
enhancement data respectively [17,18]. During image acquisition, such a model of
relative enhancement can assist the clinician to quickly detect an abnormality, since the
enhancement curves are significantly different in the first m inutes of the acquisition.
Strengths and weaknesses
There are some significant trade-offs in MRI imaging. By increasing the voxel size, the
emitted signal is increased and subsequently the signal to noise ratio of the image. If the
cross-section of the voxel is increased, the trade-off will be a decrease in the spatial
resolution of the image. On the other hand, by increasing the voxel thickness (or
equivalently the slice of tissue being imaged) information concerning different tissue
borders is lost and problems encountered with partial volume averaging become worse
[15].
In clinical practice, the main advantages of the technique are:
U nlike mammography, there is no harmful radiation and, by using a contrast agent
(e.g. Gd- DTPA*), tumour vascularity can be imaged thus enabling the radiologist to
differentiate between benign and malignant lesions.
The intrinsicallySD nature of MRI can assist the clinician in surgical planning and
m ore general in minimal invasive surgery in the breast.
• It is suitable for younger women, where mammography is less effective for diagnosis.
By taking images pre and post chemotherapy, one can assess the tissue response to
2.2 Image modalities fo r breast cancer
Offers good sensitivity and spatial resolution. However, a digitised mammogram at
50 microns (50- IC^m) has 400 times better resolution than an MRI scan of Imm^
voxels.
• Suitable for im aging women with implants or scar tissue due to prior surgery.
On the other hand some weaknesses o f breast-M RI include:
• Low specificity (-40-60% ), since fibroadenomas, benign disease, areas of
inflammation, and active glandular tissue can all show enhancement [20,21].
• Requires high infrastructure and the cost of M R scanners is very high. As a result, it
is not so widely available as X-ray mammography is.
• The time of the acquisition remains long (15-20mins) resulting in patient motion that
makes functional studies of the breast tissue more difficult (registration of the
temporal sequences is required).
• Contrast agents are toxic. In fact 1 in 10'^ women has a side effect.
• Sensitivity to small lesions and DCIS (ductal carcinoma in situ) is poor to average but
improving. In addition, microcalcifications are almost im possible to detect since
clinical M RI is based on soft tissue.
2.2.3 Ultrasound
Introduction
U ltrasound is defined as an acoustic wave of a frequency above human hearing [15]
(usually around 7-20M Hz). In the early 1950s, it was dem onstrated that ultrasound could
2.2 Image modalities for breast cancer
frequency probes are available with superb axial and lateral resolution, and extended
dynamic range. Ultrasound of the breast structures is acquired by recording their
reflections of ultrasonic waves. For that reason, the technique is also known as pulse echo
imaging. The reflected waves coming from different tissues and from different depths
within the breast carry all the information necessary for the image to be formed.
Because of the way the ultrasound image is produced (wave propagation-detection) it can
be considered a tomographic image of echoes, based on the echogenic variation among
different structures (tissues). The skin and calcifications exhibit the strongest echoes,
while dense glandular tissue and Cooper’s ligaments are less echogenic. Finally fat tissue,
benign tumours and cancers are even less echogenic and fluid is almost unechoic [22J. It
is worth mentioning that the strength of the reflected wave (described by the reflection
coefficient R) is dependent on the acoustic impedance of both tissues (Z| and Z2) that
form a reflecting boundary. Figure 7 ([23]), illustrates the appearance of an ultrasound
scan with a cyst present.
Figure 7: Appearance of ultrasound imaging of the breast. A cyst (unechoic dark region)
2.2 Image modalities fo r breast cancer
Strengths and weaknesses
The main advantages o f ultrasound are:
• It’s inexpensive and real-tim e acquisition, widely available. It is also possible to
obtain 3D ultrasound images, usually by using a free-hand probe followed by 3D
reconstruction. Recently, contrast agents have becom e available for assessing tumour
vascularity.
• Ultrasound can reduce the number of unnecessary biopsies and allows image-guided
biopsy.
• It can detect cysts with high accuracy as well as macrocalcifications and it’s suitable
for women of all ages.
Some of the weaknesses include:
• Low sensitivity. Images are intrinsically very noisy and hard to interpret. However,
new high frequency scanners exhibit im proved spatial resolution (e.g. the GE
LOGIQ™ ultrasound systems uses 12 MHz imaging, and has demonstrated point
resolution under 300 microns, approaching that o f CT and M R systems [9].
• Poor specificity in cancer detection (depends on the experience of the user). In [24],
the sensitivity and specificity of sonography for cancer detection is reported to be
100% and 48% respectively.
• The breast is deformed during acquisition. Due to tissue deformation, it can become