Western University Western University
Scholarship@Western
Scholarship@Western
Electronic Thesis and Dissertation Repository
11-10-2014 12:00 AM
Runoff Generation In A Tropical Dry Forest Watershed: Processes,
Runoff Generation In A Tropical Dry Forest Watershed: Processes,
Patterns And Connectivity
Patterns And Connectivity
Kegan K. Farrick
The University of Western Ontario Supervisor
Dr. Brian Branfireun
The University of Western Ontario Graduate Program in Geology
A thesis submitted in partial fulfillment of the requirements for the degree in Doctor of Philosophy
© Kegan K. Farrick 2014
Follow this and additional works at: https://ir.lib.uwo.ca/etd
Part of the Geochemistry Commons, Hydrology Commons, Soil Science Commons, and the Water Resource Management Commons
Recommended Citation Recommended Citation
Farrick, Kegan K., "Runoff Generation In A Tropical Dry Forest Watershed: Processes, Patterns And Connectivity" (2014). Electronic Thesis and Dissertation Repository. 2523.
https://ir.lib.uwo.ca/etd/2523
This Dissertation/Thesis is brought to you for free and open access by Scholarship@Western. It has been accepted for inclusion in Electronic Thesis and Dissertation Repository by an authorized administrator of
i
RUNOFF GENERATION IN A TROPICAL DRY FOREST WATERSHED: PROCESSES, PATTERNS AND CONNECTIVITY
Thesis format: Integrated Article
by
Kegan Ka’leb Farrick
Graduate Program in Geology
A thesis submitted in partial fulfilment of the requirements for the degree of
Doctor of Philosophy
The School of Graduate and Postdoctoral Studies Western University
London, Ontario, Canada
ii
Abstract
The lack of understanding regarding the controls that govern runoff generation in tropical dry
forests represent a critical gap in the hillslope and catchment hydrology literature. Tropical dry
forests account for approximately 42% of the global tropical forests, but represent less than 1%
of the forest hydrology literature. Three complementary studies were undertaken in a small
tropical dry forest watershed, Mexico, to assess the controls that govern the retention and release
of a rainfall in the catchment as runoff. In the first study, the high soil surface hydraulic
conductivities, absence of a water repellent surface and low rainfall intensities during the wet
season allows most of the incoming rainfall to percolate through the near-surface soil layers,
suggesting that runoff is generated through a subsurface flow mechanism. In the second study, it
was found that two different thresholds were required for streamflow activation and stormflow
generation. The long dry period depletes the stores of soil water. Only after the soil storage
deficit in the upper metre is satisfied, is streamflow activated from the catchment. Once
streamflow became persistent, the stormflow response was almost entirely governed by the
rainfall event characteristics and not antecedent soil moisture conditions. The third study used a
combination of isotopic, geochemical and hydrometric measurements to describe the water flow
pathways, source areas and residence times of stream water in this catchment. It was shown that
runoff produced during storm events were composed primarily of old water that likely originated
from either deep subsurface soil layers or groundwater and the source areas expanded, likely
through sub-basin connectivity, as catchment wetness increased through the wet season. Given
the arid climate of the watershed and known hydrological literature regarding runoff generation
in tropical forests, it was hypothesised that runoff in this catchment should be delivered from
surface or near-surface sources. However, this dissertation has shown that the combination of
deep, permeable soil on steep slopes have a stronger influence on runoff generation in this
catchment than climate. These three studies have therefore demonstrated the importance of
characterising the physical controls that govern runoff generation in forests that are data poor.
Keywords
:
Hydrology, Tropical forests, Runoff, Infiltration, Soil water repellency,iii
Co-Authorship Statement
I hereby declare that I am the sole author of this thesis, except where noted below. I understand
that my thesis may be made electronically available to the public.
Exceptions to sole authorship
:For all chapters, Dr. Brian Branfireun acted as an advisor, editor and offered suggestions to the
presentation and treatment of data in this thesis, and will be listed as a co-author on any
subsequent publications originating from this dissertation. Each data chapter of this thesis has
been submitted to a peer-reviewed journal, with chapters 2 and 3 already published. Minor
typographical or editorial differences may exist between the version that appears in this thesis
and the published versions.
Chapter 1
Chapter 1 utilises information and figures from Farrick, K.K., and Branfireun, B.A., 2013. Left
high and dry: a call to action for increased hydrological research in tropical dry forests.
Hydrological Processes. 27, 3254-3262. I was the lead author on this paper and did the majority
of the writing and analysis. Dr. Branfireun contributed to the development of research questions
and editing.
Chapter 2
Chapter 2 is published as Farrick, K.K., and Branfireun, B.A., 2014. Infiltration and soil water
dynamics in a tropical dry forest: it may be dry but definitely not arid. Hydrological processes.
28, 4377-4387. I was the lead author on this paper and did the majority of the writing and
analysis. Dr. Branfireun contributed to the development of research questions and editing.
Chapter 3
Chapter 3 is in press as Farrick, K.K., and Branfireun, B.A., 2014. Soil water storage, rainfall
and runoff relationships in a tropical dry forest catchment. Water Resources Research. 50, doi:
iv
author on this paper and did the majority of the writing and analysis. Dr. Branfireun contributed
to the development of research questions and editing.
Chapter 4
Chapter 4 will be submitted to Journal of Hydrology. The co-author on this paper is Brian A.
Branfireun. I was the lead author on this paper and did the majority of the writing and analysis.
v
Acknowledgments
I am eternally grateful to my supervisor Dr. Brian Branfireun for all the great opportunities you
have provided me over this five year journey. Your enthusiasm for the environment, science and
attention to detail in our work has been a real inspiration over the years and I have truly learnt so
much from you. I look forward to continued friendship in the future.
Special thanks to my comprehensive and defense committee members, Dr. Genevieve Ali, Dr.
Irena Creed, Dr. Jason Gerhard, Dr. Rob Schincariol and Dr. Elizabeth Webb for their research
advice and their invaluable suggestions on the final version of my dissertation.
I would like to thank all the amazing people I met and shaped my thinking at University of
Toronto. Michael, Jason, Ben and Varun, those early conversations about our research and life
will always stick with me. Ashley, Tom and Michelle, after transferring to Western, you made
life in London that much easier. Calling you lab mates isn‟t enough, so to my friends and
colleagues Cynthia, Filippo, Kaylin, James, Meghan, Stephanie, Tara and Yulia, thank you for
your help while in the lab and all the great moments outside of it. To my roommate and adopted
lab brother Aaron, I enjoyed our intellectual conservations regarding hydrology, fun and
sometimes stressful moments as teaching assistants and always reflecting on our Trini pride.
I extend the most sincere gratitude to my colleagues and friends in Mexico. Michel and Gonzalo,
thank you for the logistical support and making my stay there much easier. To my field assistants
turned amigos, Luis, Alex, Jonny, Carlos and Jimmy, thank you for helping me with my Spanish,
jokes and fun times in the field and all your hard work and sacrifice. To the Nava-Garibaldi
family, you always made me feel welcome and part of your family, thank you for all the
non-academic experiences and understanding what it is to be Mexicanada. I truly want to thank
everyone in Mexico. Your heart and welcoming spirit are amazing, and always made the difficult
times so much better.
To my parents, Feizal, Joy and Herb, thank you for all your love and support. You truly nurtured
vi
To my siblings, Kyle, Kurt and Kamille for the years of stress relief and always asking me when
I plan on finishing.
To my partner in life, Julie. You have been by my side through this entire experience. Thank you
for your love, encouragement and unwavering support over the years and for putting up with my
long summers away in Mexico. It has been quite the journey and I could not have asked for a
vii
Dedication
This is dedicated to my “mama” Miriam, although you weren‟t able to see me finish, I know you
viii
Table of Contents
Abstract ... ii
Acknowledgments... v
List of Tables ... xi
List of Figures ... xii
List of Appendices ... xiv
Chapter 1 ... 1
1.0 Introduction ... 1
1.1 Tropical dry forest distribution, major threats and hydrology ... 1
1.2 Knowledge gaps ... 4
1.2.1 Surface controls on infiltration ... 4
1.2.2 Threshold controls on runoff generation ... 4
1.2.3 Water flow pathways, source area contributions and residence times ... 5
1.3 General objectives ... 6
1.4 Thesis organisation ... 6
1.5 References ... 7
Chapter 2 ... 11
2.0 Infiltration and soil water dynamics in a tropical dry forest: it may be dry but definitely not arid ... 11
2.1 Introduction ... 11
2.2 Study site ... 18
2.3 Methods ... 21
2.3.1 Rainfall measurements ... 21
2.3.2 Soil surface hydraulic conductivity ... 21
2.3.3 Soil water repellency ... 22
2.3.4 Soil water content measurements and soil water response ... 23
2.4 Results and discussion ... 24
2.4.1 Rainfall ... 24
2.4.2 Soil surface hydraulic conductivity ... 26
2.4.3 Soil water repellency ... 27
ix
2.5 Conclusion ... 32
2.6 References ... 32
Chapter 3 ... 38
3.0 Soil water storage, rainfall and runoff relationships in tropical dry forest catchment ... 38
3.1 Introduction ... 38
3.2 Study site ... 40
3.3 Methods ... 43
3.3.1 Hydrometric measurements ... 43
3.3.2 Graphical hydrograph separation ... 44
3.3.3 Antecedent wetness calculations ... 45
3.4 Results ... 46
3.4.1 Hydrometeorological conditions ... 46
3.4.2 Rainfall – runoff relationships ... 48
3.4.3 Antecedent wetness controls on stormflow ... 52
3.5 Discussion ... 56
3.5.1 Streamflow activation in tropical dry forest ... 56
3.5.2 Controls on stormflow runoff generation ... 59
3.5.3 Streamflow activation and stormflow generation under future climate change ... 62
3.6 Conclusion ... 63
3.8 References ... 64
Chapter 4 ... 70
4.0 Flow pathways, source water contributions and water residence times in a Mexican tropical dry forest catchment ... 70
4.1 Introduction ... 70
4.2 Study area ... 72
4.3 Methods ... 74
4.3.1 Hydrometeorological measurements ... 74
4.3.2 Isotope and geochemical water sampling ... 76
4.3.2.1 Rain and baseflow sampling for residence time analysis ... 76
4.3.2.2 Geochemical sampling from lysimeters, wells, seeps and baseflow ... 76
x
4.3.3 Isotopic and geochemical storage and analysis ... 77
4.3.4 Residence time modelling ... 77
4.3.5 Isotopic hydrograph separation ... 78
4.3.6 Topographic analysis ... 79
4.4 Results ... 80
4.4.1 Seasonal hydrometeorological conditions ... 80
4.4.2. Stream water residence time ... 82
4.4.3. Water geochemistry ... 85
4.4.4 Isotopic hydrograph separation and water geochemistry during stormflow ... 89
4.4.5. Soil moisture and near-stream groundwater response to rainfall inputs ... 92
4.5 Discussion ... 93
4.5.1. Stream water residence time across the catchment ... 93
4.5.2. Subsurface stormflow in a tropical dry forest ... 95
4.5.3. The influence of catchment wetness on source area contribution ... 98
4.6 Conclusion ... 99
4.7 References ... 100
Chapter 5 ... 106
5.0 Summary and conclusions ... 106
5.1 General summary ... 106
5.2 Concluding remarks ... 108
5.3 Recommendations for future research... 110
5.4 References ... 112
Appendices ... 113
xi
List of Tables
Table 2.1 The annual precipitation, maximum rainfall intensity, hydraulic conductivity and primary runoff mechanism of the examined semi-arid watersheds. ... 16
Table 2.2 General soil physical properties at different depths at the deciduous and pine forest. Values in parentheses indicate standard deviation... 20
Table 2.3 Ethanol drop test and Water drop penetration time after Doerr (1998) ... 23
Table 2.4 Water drop penetration time at each individual plot for the Late wet (august 2010), Early dry (December 2010), Late dry (May 2011) and Early wet (June 2011) seasons. s =
seconds, h = hours ... 29
Table 3.1 Storm event characteristics from July to September, 2012. P = event rainfall; R = total event runoff; QF = event quick flow; QF/P = runoff coefficient. Above threshold events
represent storms that generate more than 4 mm of QF ... 50
Table 3.2 Assessment of the Piecewise Regression Analysis (PRA) model efficiency used to produce the non-linear response between quickflow and the sum of antecedent soil water and event rainfall ... 55
Table 4.1 Catchment characteristics of the stream water sampling locations used in residence time analysis... 79
Table 4.2 Mean concentrations of the major cations and anions of rainfall, soil water, seepage from the forest road, near-stream groundwater and baseflow from the upper headwater basin and primary outflow. Values in parentheses are the standard deviation ... 88
xii
List of Figures
Figure 1.1 Comparison of the average annual water inputs and outputs and the dominant mechanisms of tropical dry and wet forests (from Farrick and Branfireun, 2013). Values in parentheses represent percentage of rainfall. Runoff arrow thickness represents the relative contribution to stormflow. ... 3
Figure 2.1 Map showing the location of the study watershed, instrumentation and sampling transects... 19
Figure 2.2 Daily rainfall from July 2010 to June 2011. The grey arrow indicates rain gauge error and period of data loss ... 24
Figure 2.3 Frequency distribution of a) depth (mm), b) duration (h) and c) intensity (mm/h) for 62 storm events ... 25
Figure 2.4 Spatial distribution of surface hydraulic conductivity (mm/h) along two transects at a) the deciduous forest and b) the pine forest. The black horizontal line indicates the maximum rainfall intensity. The grey horizontal line indicates the 75th percentile of rainfall intensity ... 27
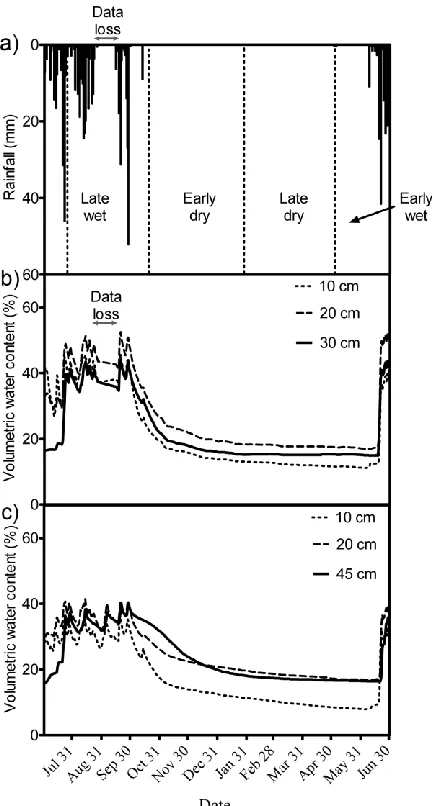
Figure 2.5 a) Daily rainfall and daily volumetric water content at b) the deciduous forest and c) the pine forest. The grey arrow indicates logger error and period of data loss ... 30
Figure 2.6 Cumulative gain in rainfall and event-level soil water at the deciduous and pine forest for 62 events ... 31
Figure 3.1 Location of study catchment and hydrological instrumentation ... 42
Figure 3.2 Daily variation in a) rainfall, b) convex hillslope volumetric water content, c) concave hillslope volumetric water content and d) discharge from May to September, 2012 ... 47
Figure 3.3 Cumulative rainfall, soil water and streamflow from May to September, 2012 ... 48
Figure 3.4 Relationship between a) event quick flow (QF) and event rainfall (P), b) runoff coefficient (QF/P) and P, c) QF and rainfall intensity (mm-1) and d) QF and rainfall duration (hours) ... 49
xiii
Figure 3.6 Threshold relationship between the quickflow (QF) measured at the primary outflow and a) antecedent water + event rainfall (P) at the convex hillslope, b) antecedent water + P at the concave hillslope and c) mean antecedent water + P from all slope locations. Black circles
represent the observed QF and the grey line represents the predicted response from the Piecewise Regression Analysis (PRA) ... 53
Figure 4.1 Location of the study site and isotopic and geochemical water sampling locations across the catchment ... 73
Figure 4.2 Daily change in a) rainfall, b) soil moisture, c) near-stream groundwater and d)
streamflow from July to September, 2012. The numbers on figure 4.2a represent the storm events sampled for water isotopes and geochemistry. ... 81
Figure 4.3 δ2H and δ18O signatures of rainfall and stream water. The insert shows the isotopic signatures of stream water from the upper basin, half basin mark and primary outflow. ... 82
Figure 4.4 Sine wave regression models for δ18
O in rainfall (the solid line represents the weighted rainfall and the dashed line represent the actual rainfall), and streamwater at b) upper headwater basin, c) half basin mark and d) primary outflow. The amplitude (AMP) and root mean square error (RMSE) of the modelled isotopic signature is included ... 84
Figure 4.5 Seasonal variation in calcium, magnesium, sodium and potassium concentrations baseflow at a) the primary outflow and b) upper headwater basin ... 86
Figure 4.6 Piper plot of the major ion chemistry from the baseflow and near-stream groundwater from the study catchment ... 87
Figure 4.7 The portioning of stormflow into its event and pre-event water sources using a one-tracer two component hydrograph separation analysis with δ18O as the tracer. Note that storm 2 is plotted with a different y-axis scale because of the significantly higher discharge. ... 90
Figure 4.8 Concentrations of calcium, magnesium, sodium and potassium in the storm water for the storm events on a) August 7, b) August 19, c) September 9 and d) September 11. Note that storm 2 is plotted on a different scale ... 92
xiv
List of Appendices
Appendix 1. Change in the soil surface hydraulic conductivity (mm/h) at variable pore pressures at four locations at a) the deciduous forest and b) pine forest. ... 113
Appendix 2. Example of the graphical hydrograph separation using the local minimum method. The hydrographs are separated by the dashed line, connecting the local minima. The line
separates the quickflow (black area) from the baseflow (grey area). ... 114
Appendix 3. Copyright release agreement for Chapter 1 “Left high and dry: a call to action for increased hydrological research in tropical dry forests”. ... 115
Appendix 4. Copyright release agreement for Chapter 2 “Infiltration and soil water dynamics in a tropical dry forest: it may be dry but definitely not arid” ... 116
1
Chapter 1
1.0 Introduction
1.1 Tropical dry forest distribution, major threats and hydrology
Tropical dry forests have lived in the shadow of their humid counterparts with respect to
scientific research. Despite accounting for more than 42% of all tropical forests (Murphy and
Lugo, 1995) and roughly 6% of the Earth‟s land surface, less than 15% of the literature on all
tropical forest research has focused on tropical dry forests with the remainder highlighting work
in tropical wet forests (Sánchez-Azofeifa et al., 2005; Santos et al., 2011). Many of these tropical
dry forest regions are currently water-stressed and additional pressures from population growth,
land use and future climate change will have significant implications for the future functioning of
their natural and socioeconomic systems.
Tropical dry forests lie within the tropical zone, which extends from the equator to 23o in both the Northern and Southern hemispheres. They are broadly characterized as having a vegetation
community typically dominated by deciduous to semi-deciduous trees, annual precipitation
ranges from 250 – 2000 mm, average annual temperature greater than or equal to 17oC, and an annual average ratio of potential evapotranspiration (PET) to precipitation (P) greater than 1
(Murphy and Lugo, 1995). The key defining feature of tropical dry forests is the occurrence of a
distinct dry period that lasts between 3 and 7 months (Bullock et al., 1995). This ecosystem
accounts for more than 42% of tropical forests and 19% of the world‟s total forest area (Murphy
and Lugo, 1995; Miles et al., 2006). The majority of tropical dry forests occur in Central and
South America (66.7%) with the remainder found in Asia (16.4%), Africa (13.1%) and small
fragments in Oceania (3.8%). These forests are amongst the most diverse and complex in the
world, displaying a high degree of endemism (Olson and Dinerstein, 1998; Suazo-Ortuño et al.,
2008). This is especially true in the Mexico, where approximately 60% of the species found in
2
Tropical dry forests are recognised as one of the world‟s most threatened terrestrial ecosystems
with more than 97% of the existing area at risk from threats such as land use change,
fragmentation, and climate change (Miles et al., 2006). The favourable climatic conditions of
these regions have encouraged the rapid expansion of human settlements, with more than 42% of
dry forests found alongside population densities greater than 250 people/km2 (Miles et al., 2006). As a result of the high population density, more than 48.5% of tropical dry forests (Hoekstra et
al., 2005) have been removed and converted to either agriculture or urban land uses. These
changes have occurred in all of the tropical dry forest regions but are particularly severe in Asia
and parts of Africa, resulting in the increased need to prioritise them for conservation (Miles et
al., 2006).
Published research on the hydrology of tropical dry forests is rare, accounting for less than 1% of
catchment hydrology literature. Despite this, limited information does exist regarding the water
balance and runoff mechanisms observation in tropical dry forests. In many tropical dry forests
the catchment scale water balance has typically been quantified. Evapotranspiration is the main
source of water loss from tropical dry forests, on average accounting for 73-86% of the annual
water loss (e.g. Sandström, 1996; Vose and Maass, 1999; Montenegro and Ragab, 2010).
Discharge is often very low, representing less than 17% of the annual losses from the catchment
(e.g. de Araújo and González Piedra, 2009; Montenegro and Ragab, 2010). Most of the studies in
tropical dry forests which have examined runoff processes have generally focused on identifying
the specific mechanism by which runoff is generated using either geochemical tracers
(Sandström, 1996) or hydrometric analyses (McCarntey et al., 1998; Masiyandima et al., 2003;
Mugabe et al., 2007) but not a combination of both.
Runoff is the process by which water flows over and within the soil substrate. There are three
major mechanisms of runoff generation: Hortonian or infiltration excess overland flow (HOF),
Saturated overland flow (SOF) and Subsurface stormflow (SSF). HOF typically occurs when
rainfall intensity exceeds the infiltration capacity of the soil, resulting in flow over the surface.
The generation of SOF is more complicated than HOF. The major requirement is that the soil
must be saturated, either from above through precipitation or from below through a rising water
3
surface cannot infiltrate and flows as surface runoff. SSF can be generated under both saturated
and unsaturated conditions. Under saturated conditions flow can occur from perched water tables
or local groundwater mounds that lay close to the ground surface. Under unsaturated conditions,
precipitation infiltrates the surface layer and moves laterally through the soil profile as bypass
flow in macropores and pipes or as flow through the soil matrix.
In tropical dry forests, HOF and SOF are the main runoff generating mechanisms (Figure 1.1).
These dominant mechanisms are quite different from humid tropical forests where runoff is often
dominated by SOF, SSF and vertical runoff pathways. Despite the identification of the specific
runoff generating mechanisms in tropical dry forests, much of these analyses remain preliminary
and limited to less than six studies (Farrick and Branfireun, 2013). Therefore, there is a need for
increased attention to processes that govern runoff generation particularly: 1. the surface controls
on infiltration, 2. the specific thresholds of antecedent storage and rainfall, 3. isotopic and
geochemical characterisation of water sources and connectivity across catchments.
4
1.2 Knowledge gaps
1.2.1 Surface controls on infiltration
It is widely accepted that soil infiltration rates play a significant role in dictating the dominant
hillslope runoff mechanism (Wilcox et al., 1997). Studies have shown that infiltration through
the surface soil is mainly controlled by the interaction between the rainfall characteristics during
a storm event and the physical properties at the soil surface, namely hydraulic conductivity (K)
(Bonell and Williams, 1996; Martínez-Mena et al., 1998; Puigdefabregas et al., 1998). Of
increasing importance is the recognition that the development of severe soil water repellency at
the soil surface can result in a two to three time decrease in surface infiltration rates (Imeson et
al., 1992; Martínez-Murillo and Ruiz-Sinoga, 2007). These relationships are particularly
important in arid and semi-arid systems, where HOF is the primary form of runoff generation.
While work in tropical dry forests catchments indicate that HOF does occur, these studies
generally fail to examine the relationship between rainfall intensity and hydraulic conductivity
and soil water repellency over a large spatial scale.
1.2.2 Threshold controls on runoff generation
The increased evidence supporting the non-linear, rainfall-runoff response has resulted in a shift
in the focus of hillslope and catchment hydrologists to a greater emphasis on quantifying the
hydrological thresholds and explaining their physical controls (Zehe and Sivapalan, 2009;
Spence, 2010; Ali et al., 2013). It is clear that, as has been demonstrated in humid temperate, wet
tropical and semi-arid catchments, that the exceedance of antecedent water storage or rainfall
thresholds is often required for runoff generation (Spence and Woo, 2003; Cammeraat, 2004;
Tromp-van Meerveld and McDonnell, 2006; Negishi et al, 2007; Oswald et al., 2011). While
specific depths of rainfall are needed to generate substantial volumes of runoff, many studies
suggest that the rainfall threshold is only exceeded after storage deficits are satisfied (Buttle et
al., 2004, Fu et al., 2013). These observations have sparked debate in the hydrological
community regarding the relative importance of storage versus precipitation thresholds. Recent
studies have focused on combining both a depth equivalent of soil water storage and event
5
(Detty and McGuire, 2010). To the best of my knowledge, no previous studies have examined
the importance of storage and rainfall thresholds on streamflow generation in tropical dry forests.
This information, will undoubtedly improve our ability to examine the impact of climatic and
land use changes on runoff as well as provide an important metric for inter-catchment
comparison (Ali et al., 2013).
1.2.3 Water flow pathways, source area contributions and
residence times
While it is widely recognised that understanding the specific water flow pathways, source areas
and residence times of stream water is essential for the management of surface and groundwater
resources, these studies have mainly gone undescribed in tropical dry forests (Buttle and
McDonnell 2004; Bonell and Bruijnzeel, 2005). Most of what is known regarding runoff
pathways in tropical catchments stems from research in the wet tropics. Using either
geochemical or isotopic tracers, runoff in wet tropical forests has been shown to be composed
primarily of event water generated as SOF, return flow (RF) or shallow subsurface flow
(Schellekens et al., 2004; Goller et al., 2005). While studies have focused on runoff processes in
tropical forests characterised by low surface K or shallow impeding soil layers, research in
tropical catchments with more permeable soils is severely lacking. Hydrological connectivity is
regarded as one of the key controls in determining hillslope and catchment rainfall-runoff
response and has been defined as the ability to transfer water from one part of a landscape to
another (Bracken and Croke, 2007). The Hewlett and Hibbert (1967) Variable Source Area
Concept (VSA) has shaped the hydrology community‟s concept of hillslope and catchment scale
runoff response for over 40 years. The VSA considers that runoff from a catchment is a function
of the upslope expansion of saturated subsurface areas, connecting the riparian zone to the
hillslope. Recent work suggests that connectivity also occurs among distinct hydrological units
across a hillslope (e.g. Tromp-van Meerveld and McDonnell 2006) or zero-order basins (e.g.
Sidle et al., 2000) rather than evolving from near stream zones. Stream water residence time
provides an excellent indication of the linkages among flow paths, water sources and storage in a
6
water residence times have been well studied in humid temperate forests, to my knowledge these
hydrological processes have not been examined in tropical dry forests.
1.3 General objectives
The research presented in this dissertation was carried out to improve our understanding of the
controls that govern the translation of rainfall to runoff in tropical dry forests by addressing the
research gaps presented in the previous section. Not only will the results help inform future
predictions of runoff generation under changing climate and land use change but also add to our
conceptual understanding of catchment hydrology. The general research objectives were as
follow:
1. To test the hypothesis that the current knowledge regarding the relationship between soil
surface hydraulic conductivity, soil water repellency and rainfall intensity in semi-arid
systems is transferrable to tropical dry forests and to examine the relationship between
rainfall intensity, soil surface hydraulic conductivity and soil water repellency.
2. To examine the soil water storage and hydrometeorological controls on streamflow
activation and stormflow generation in a tropical dry forest catchment.
3. To identify the dominant flow pathways, water sources and residence times of
streamflow. To investigate the dominant runoff flow pathways, source water
contributions and residence times of streamflow in a tropical dry forest catchment.
1.4 Thesis organisation
This thesis has been prepared in the integrated article format and consists of three manuscripts
related to the three main research objectives. The introduction (Chapter 1) provides an overall
introduction to the thesis as whole. It provides background information regarding the distribution
and threats to tropical dry forests, identifies the knowledge gaps that the research addresses and
outlines the general objectives of the dissertation. The first manuscript (Chapter 2) investigates
the controls on surface water infiltration over space and time. The second manuscript (Chapter 3)
7
activation and event scale stormflow generation. The third manuscript (Chapter 4) applies a
combined isotopic, geochemical and hydrometric analysis to identify the primary water flow
pathways, source area contributions to runoff and estimate the mean residence time of baseflow.
The last chapter (Chapter 5) provides an overall summary and general conclusion of the work,
and identifies future research directions.
1.5 References
Ali, G, Oswald, CJ, Spence, C, Cammeraat, ELH, McGuire, KJ, Meixner, T, Reaney, SM. 2013. Towards a unified threshold-based hydrological theory: necessary components and recurring challenges. Hydrological Processes 27: 313-318, doi: 10.1002/hyp.9560.
Bonell, M, Bruijnzeel, LA. 2005. Forests, water and people in the humid tropics: past, present and future hydrological research for integrated land and water management. Cambridge University Press.
Bonell, M, Williams, J. 1986. The generation and redistribution of overland flow on a massive oxic soil in eucalypt woodland within the semi-arid tropics of North Australia. Hydrological Processes 1: 31-46.
Bracken L, Croke J. 2007. The concept of hydrological connectivity and its contribution to understanding runoff-dominated geomorphic systems. Hydrological Processes 21: 1749-1763
Bullock, SH, Mooney, HA, and Medina, E. 1995. Seasonally Dry Tropical Forests. Cambridge University Press.
Buttle, J, Dillon, PJ, Eerkes, GR, 2004. Hydrologic coupling of slopes, riparian zones and streams: an example from the Canadian Shield. Journal of Hydrology 287: 161-177. doi: 10.1016/j.jhydrol.2003.022.
Buttle, JM, McDonnell, JJ. 2005. Isotope tracers in catchment hydrology in the humid tropics. In: Forests, Water and People in the Humid Tropics, Bonell, M, and Bruijnzeel, LA, (eds.), Cambridge Univ. Press, Cambridge, U.K; 770-789.
Cammeraat, LH. 2004. Scale dependent thresholds in hydrological and erosion response of a semi-arid catchment in southeast Spain. Agriculture Ecosystems and Environment 104: 317-332. doi: 10.1016/j. agee.2004.01.032.
8
Detty, JM, McGuire, KJ. 2010. Threshold changes in storm runoff generation at a till‐mantled
headwater catchment. Water Resources Research 46: W07525,
doi:10.1029/2009WR008102.
Fu, C, Chen, J, Jiang, H, Dong, L, 2013. Threshold behaviour in a fissured granitic catchment in southern China: 1. Analysis of field monitoring results. Water Resources Research 49: 2519-2535, doi: 10.1002/wrcr/20191.
Goller, R, Wilcke, W, Leng, MJ, Tobschall, HJ, Wagner, K, Valarezo, C, Zech, W. 2005. Tracing water paths through small catchments under a tropical montane rain forest in south Ecuador by an oxygen isotope approach. Journal of Hydrology 308: 67-80. doi: 10.1016/j.jhydrol.2004.10.022.
Hewlett JD and Hibbert AR. 1967. Factors affecting the response of small watersheds to precipitation in humid areas. In: Sopper WE and Lull HW. International Symposium on Forest Hydrology. The Pennsylvania State University. 29 August – 10 September 1965. Pergamon Oxford pp. 275-290
Hoekstra, JM, Boucher, TM, Ricketts, TH, Roberts, C. 2005. Confronting a biome crisis: global disparities of habitat loss and protection. Ecology Letters 8: 23-29.
Imeson, AC, Verstraten, JM, van Mulligen, EJ, Sevink, J. 1992. The effects of Fire and Water Repellency on Infiltration and Runoff under Mediterranean Type Forest. Catena 19: 345-361.
Martínez-Mena, M, Albaladejo, J, Castillo, VM. 1998. Factors influencing surface runoff generation in a Mediterranean semi-arid environment: Chicamo watershed, SE Spain. Hydrological Processes 12: 741-754.
Martínez-Murillo, JF, Ruiz-Sinoga, JD. 2007. Seasonal changes in the hydrological and erosional response of a hillslope under dry-Mediterranean climatic conditions (Montes de Málaga, South of Spain). Geomorphology 88: 69-83. DOI: 10.1016/j.geomorph.2006.10.015.
Masiyandima, MC, van de Giesen, N, Diatta, S, Windmeijer, PN, Steenhuis, TS. 2003. The hydrology of inland valleys in the sub-humid zone of West Africa: rainfall-runoff processes in the M‟bé experimental watershed. Hydrological Processes. 17: 1213-1225.
McCartney, M, Butterworth, J, Moriarty, P, Owen, R. 1998. Comparison of the hydrology of two contrasting headwater catchments in Zimbabwe. IAHS Publications. 248: 515-522.
9
Miles, L, Newton, AC, DePries, RS, Ravilious, C, May, I, Blyth, S, Kapos, V, Gordon, JE. 2006. A global overview of the conservation status of tropical dry forests. Journal of Biogeography. 33: 491-505.
Montenegro, A, Ragab, R. 2010. Hydrological response of a Brazilian semi-arid catchment to different land use and climate change scenarios: a modelling study. Hydrological Processes. 24: 2705-2723.
Mugabe, FT, Hodnett, M, Senzanje, A. 2007. Comparative hydrological behaviour of two small catchments in semi-arid Zimbabwe. Journal of Arid Environments. 69: 599-616.
Murphy,PG, Lugo, AE. 1995. Dry forests of Central America and the Caribbean, In: Seasonally Dry Tropical Forests. Bullock, SH, Mooney, HA, and Medina, E, (eds.), Cambridge University Press: 35-58.
Negishi, JN, Noguchi, S, Sidle, RC, Ziegler, AD, Nik, AR. 2007. Stormflow generation involving pipe flow in a zero-order basin of Peninsular Malaysia, Hydrological Processes 21: 789-806, doi: 10.1002/hyp.6271.
Olson, DM, Dinerstein, E. 1998. The global 200: a representation approach to conserving the Earth‟s most biologically valuable ecoregions. Conservation Biology. 12: 502-515.
Oswald, CJ, Richardson, MC, Branfireun, BA. 2011. Water storage dynamics and runoff response of a boreal Shield headwater catchment, Hydrological Processes 25: 3042-3060, doi: 10.1002/hyp.8036.
Puigdefabregas, J, del Barrio, G, Boer, MM, Gutiérrez, L, Solé, A. 1998. Differential response of hillslope and channel elements to rainfall events in a semi-arid area. Geomorphology 23: 337-351.
Sánchez-Azofeifa, GA, Quesada, M, Rodríguez, JP, Nassar, JM, Stoner, KE, Castillo, A, Garvin, T, Zent, EL, Calvo-Alvardo, JC, Kalaeska, MER, Farjardo, L, Gamon, JA, Cuevas-Reyes, P. 2005. Research Priorities for Neotropical Dry Forests. Biotropica. 37: 477-485.
Sandström, K. 1996. Hydrolochemical deciphering of streamflow generation in semi-arid east Africa. Hydrological Processes. 10: 703-720.
Santos JC, Leal IR, Almeida-Cortez JS, Fernandes GW, Tabarelli M. 2011. Caatinga: the scientific negligence experienced by a dry tropical forest. Tropical Conservation Science 4: 276-286.
10
Sidle, RC, Tsuboyama,Y, Noguchi, S, Hosoda, I, Fujieda, H, Shimizu, T. 2000. Stormflow generation in steep forested headwaters: a linked hydrogeomorphic paradigm. Hydrological Processes 14 (3): 369-385.
Spence, C. 2010. A paradigm Shift in Hydrology: Storage Thresholds across Scales Influence Catchment Runoff Generation. Geography Compass 47: 819-833.
Spence, C, Woo, MK. 2003. Hydrology of subartic Canadian shield: soil-filled valleys, Journal of Hydrology 279: 151-166. doi: 10.1016/S0022-1694(03)00175-6.
Suazo-Ortuño, I, Alvardo-Díaz, J, Martínez-Ramos, M. 2008. Effects of Conversion of Dry Tropical Forest to Agricultural Mosaic on Herpetofaunal Assemblages. Conservation Biology 22: 362-374.
Trejo, I, Dirzo, R. 2000. Deforestation of seasonally dry tropical forest: a national and local analysis in Mexico. Biological Conservation 94: 133-142.
Tromp-van Meerveld, HJ, McDonnell, JJ. 2006. Threshold relations in subsurface stormflow: 1. A 147-storm analysis of the Panola hillslope. Water Resources Research 42: W02410, doi:10.1029/2004WR003778.
Vose, JM, Maass, JM. 1999. A Comparative Analysis of Hydrologic Responses of Tropical Deciduous and Temperate Deciduous Watershed Ecosystems to Climate Change. USDA Forest Service Proceedings. 12: 293-298.
Wilcox, BP, Newman, BD, Brandes, D, Davenport, DW, Reid, K. 1997. Runoff from a semiarid ponderosa pine hillslope in New Mexico. Water Resources Research 33: 2301-2314.
11
Chapter 2
2.0 Infiltration and soil water dynamics in a tropical dry forest: it
may be dry but definitely not arid
2.1 Introduction
Tropical dry forests account for approximately 42% of the world‟s tropical forests (Murphy and
Lugo, 1986; Miles et al., 2006). In Central America, the majority of these forests occur along the
Pacific coast of Mexico and are considered to be the most biologically diverse tropical dry
forests in the world (Olson and Dinerstein, 1998). Over the last 30 years, these forests have
experienced a 12–16% decrease in area because of deforestation from urban encroachment,
conversion to agriculture and fire (Miles et al., 2006). In Mexican tropical dry forest watersheds,
the Intergovernmental Panel on Climate Change has forecasted increases in temperature and
significant decreases in precipitation, which is expected to reduce the already limited runoff
volumes generated (Bates et al., 2008), placing additional stress on groundwater resources in a
country where water scarcity is its most important environmental challenge (Muñoz-Piña et al.,
2008). Despite the importance of hydrology and water availability in this region, the literature on
the hydrological processes in tropical dry forests is limited to a small number of short term
investigations, in sharp contrast with the large body of literature on the hydrology of temperate
and tropical humid forest watersheds (Farrick and Branfireun, 2013).
Tropical dry forests are characterized as having waxyleaved, drought-resistant vegetation, annual
rainfall from 250–2000mm and an average annual temperature ≥17 °C (Murphy and Lugo, 1995;
García-Oliva et al., 2003; Miles et al., 2006). The key defining feature of tropical dry forests is
the occurrence of a distinct dry period that lasts between 3 and 7 months (Bullock et al., 1995).
These climate and vegetation features are most similar to those of semi-arid regions; a 5–10
month dry period, annual rainfall from 235 to 805mm (Table 2.1), mean temperatures ≥16 °C
and waxy, lipid-rich vegetation (Martínez-Mena et al., 1998; Descroix et al., 2001; Verheijen
12
and climate conditions may result in a variety of surface hydrological processes (Cerdà, 1998a).
Despite the climatic range, the similarities between these two ecosystems suggest that the factors
that govern hydrological processes in semi-arid areas such as vegetation type and annual
precipitation regime may be transferrable to tropical dry forest catchments.
The rainfall–runoff relationship in semi-arid regions has been well studied, and it is widely
accepted that runoff in semi-arid areas occurs primarily as infiltration excess (Hortonian)
overland flow (HOF), where the rainfall rate exceeds the infiltration rate at the soil surface
(Table 2.1). The generation of HOF is mainly controlled by the interaction between the rainfall
characteristics during the storm event (Bonell and Williams 1986; Wilcox et al., 1997), slope,
antecedent soil moisture (Ziadat and Taimeh, 2013) and the physical properties at the soil
surface, of which hydraulic conductivity (Martínez-Mena et al., 1998; Puigdefabregas et al.,
1998) and soil water repellency (Imeson et al., 1992; Cerdà and Doerr, 2007) are recognized as
two of the most important controls.
The majority of precipitation events in semi-arid regions during the wet season are low-intensity
and short-duration rainfalls (Martínez-Mena et al., 1998; Chamizo et al., 2012). Although
low-intensity events dominate by frequency, high-low-intensity storm events are considered more
important in runoff generation processes in semi-arid regions as more than 70% of the total
annual rainfall can be delivered by infrequent, high-intensity, short-duration events (Wilcox et
al., 1997; Martínez-Mena et al., 1998). Rainfall intensities as high as 120 mm/h have been
recorded in semi-arid areas (e.g. Bonell and Williams, 1986; Wilcox et al., 1997), and in many
instances, these rainfall intensities are one to two orders of magnitude greater than the infiltration
rate at the soil surface (Table 2.1). Because they exceed infiltration, high rainfall intensities
promote HOF and are therefore an important control in runoff generation in semi-arid regions.
In semi-arid systems, it is also well documented that low surface hydraulic conductivity (K)
limits infiltration (Table 2.1). Many studies agree that the presence of soil surface crusts, stony
ground cover, rocky outcrops and the lack of continuous vegetation produce low permeability
surfaces that reduce infiltration (Wilcox et al., 1988; Puigdefabregas et al., 1998; Yair and
13
raindrop impact or lateral surface flow. The aggregates then disperse across the surface and clog
pore spaces, creating low K surfaces (Neave and Rayburg, 2007). Hydraulic conductivities have
been shown to be two to five times lower for crusted versus non-crusted surfaces
(Puigdefabregas et al., 1998; Eldridge et al., 2000; Descroix et al., 2001). The effect of stones
and rock fragments on infiltration often depends on the size, orientation and position of the
stones/rocks within the soil matrix (Poesen et al., 1994). In many cases, the presence of a
discontinuous cover of loose, small stones at the soil surface increases surface roughness, which
slows surface runoff and enhances infiltration along the contact between the stone and soil
matrix (Poesen and Lavee, 1994; Poesen et al., 1994; Cerdà, 2001). Other work has shown that a
10–20% increase in the portion of embedded stones can reduce infiltration rates by an order of
magnitude (Wilcox et al., 1988; Mayor et al., 2009). The low density of vegetation cover in
many semi-arid regions generally promotes low levels of infiltration (Cerdà, 1996). Small areas
of high infiltration two to three times higher than bare and crusted surfaces have been recorded
under dense patches of vegetation (Nicolau et al., 1996; Cerdà, 1997b; Mayor et al., 2009).
Higher plant density often reduces surface crust formation through greater soil stabilization
(Lavee et al., 1998) and enhances infiltration through the formation of macropores and
preferential flow pathways along the roots (Cerdà, 1997b; Calvo-Cases et al., 2003). Stone, crust
and vegetation cover typically exhibit high spatial variability in semi-arid areas because of slope
position and aspect (Cerdà, 1998b; Cerdà, 1999). These surface heterogeneities are responsible
for the high spatial variability in infiltration and HOF observed in semi-arid regions (Cerdà,
1996, 1997b). It is important to note that during wetter months, higher soil moisture reduces
infiltration rates over vegetated areas, producing more homogenous infiltration rates across the
landscape (Cerdà, 1996, 1997a). Despite having high spatial variations in infiltration rates, there
is still the general consensus that HOF dominates semi-arid landscapes as low K coupled with
the high rainfall intensities promote HOF generation (Wilcox et al., 1997; Martínez-Mena et al.,
1998).
Soil water repellency or soil hydrophobicity is the resistance of soils to surface wetting and is
due to organic hydrophobic compounds being present in the soil matrix (Doerr et al., 2000).
These organic, hydrophobic compounds are introduced into the soil by plant roots, fungal
14
Although these hydrophobic compounds are always present in the soil, repellent conditions are
activated under low soil moisture conditions, making soil moisture a particularly important
control on the establishment of repellency. Low soil moisture conditions lead to the
concentration of hydrophobic compounds and establishment of repellent surfaces that persist as
long as such moisture conditions are maintained (Leighton-Boyce et al., 2005; Verheijen and
Cammeraat, 2007). Semi-arid regions are therefore particularly prone to high levels of soil water
repellency due to generally low soil moisture and the presence of waxy-leaved, drought-resistant
vegetation (Cerdà and Doerr, 2007; Verheijen and Cammeraat, 2007). Furthermore, frequent
fires in these regions further enhance repellency as hydrophobic compounds may become more
concentrated in the surface soils after burning (Doerr et al., 2000).
In semi-arid regions, soil water repellency has been shown to affect infiltration and, as a
consequence, runoff generation. Under high levels of repellency, Imeson et al. (1992) recorded a
reduction in infiltration from 58.2 to 28.7 mm/h, whereas Martínez-Murillo and Ruiz-Sinoga
(2007) recorded a reduction from 36 to 28 mm/h. The reduced infiltration can increase HOF
production by an order of magnitude on repellent versus non-repellent soils (Martínez-Murillo
and Ruiz-Sinoga, 2007). Similar to semi-arid areas, the hydrology of tropical dry forest
catchments may be controlled by soil water repellency due to the presence of a waxy and
lipid-rich litter layer (García-Oliva et al., 2003) and prolonged dry periods, which reduces soil water
content to the point of activating soil water repellency.
Rainfall intensity, surface soil hydraulic conductivity and soil water repellency are important
controls that govern infiltration rates and magnitudes and ultimately runoff generation in
semi-arid environments. We have no such insights into the hydrology of tropical dry forest
catchments. However, similarities in climate and abundance of waxy-leaved, drought-resistant
vegetation suggest that the factors that govern infiltration and the runoff generation mechanisms
in semi-arid areas are transferrable to Mexican tropical dry forest catchments. To test this
hypothesis, we will:
1. characterize soil surface hydraulic conductivity and soil water repellency over space and time
15
2. characterize the frequency and nature of the shallow soil water response to rainfall input in
two dominant tropical dry forest types (mixed deciduous and pine-oak); and
3. consider rainfall event characteristics and timing in light of the measured hydraulic
conductivity, soilwater repellency and soil water response to evaluate if HOF is a dominant
16
Table 2.1 The annual precipitation, maximum rainfall intensity, hydraulic conductivity and primary runoff mechanism of the examined semi-arid watersheds.
Source Site Annual
precipitation (mm) Maximum rainfall intensity (mm/h) Hydraulic conductivity (mm/h) Primary runoff mechanism Osborn and Renard (1970) Walnut Gulch, USA
292 >12.7 30.8 HOF
Bonell and Williams (1986)
Torrens creek, Australia
552 120 25.8 HOF
Hussein (1996) Mosul City, Iraq 333 60 46 – 37 HOF
Nicolau et al. (1996)
Rambla Honda, Spain
300 18 116 – 15 HOF
SOF
Sandström (1996) Harra, Tanzania 807 - - HOF
Solé-Benet et al. (1997)
Tabernas, Spain 235 85.2 44.5 HOF
Wilcox et al. (1997)
New Mexico, USA 500 120 2.7 HOF
Bergkamp (1998) Castilla la Mancha, Spain
400 55 - HOF
SOF
Lavee et al. (1998) Mishor Adumin, Israel
17 Martínez-Mena et
al. (1998)
Chicamo, Spain 298 110 8.2 – 4.9 HOF
SOF
Puigdefabregas et al. (1998)
Rambla Honda, Spain
300 38 72 – 42 HOF
SOF
Descroix et al. (2001)
Western Sierra Madre, Mexico
450 - 14.8 HOF
Calvo-Cases et al. (2003)
Alicante, Spain 387 – 474 55 – 27 32.7 – 32.9 HOF
SOF
Bartley et al. (2006)
Weany Creek, Australia
450 – 650 132 – 60 – HOF
Wilcox et al. (2008)
Sonora, USA 550 - 190 SSF
Mayor et al. (2009)
Ventos, Spain 275 64 50 – 33 HOF
SOF
Montenegro and Ragab (2010)
Mimoso, Brazil 650 - 11.3 HOF
Chamizo et al. (2012)
El Cautivo, Spain 235 57 13.3 – 8.8 HOF
SOF
Liu et al. (2012) Upper Wei River basin, China
512 - 112 – 20 SSF
18
2.2 Study site
The study was conducted in a 55-ha sub-watershed of the Lake Zapotlán watershed,
approximately 100 km south-southwest of Guadalajara, Jalisco, Mexico and 5 km northeast of
Ciudad Guzmán, Jalisco, Mexico (19.44°N 103.26°W) (Figure 2.1).
The climate is tropical savannah (Köppen-Geiger: Aw) with a distinct wet and dry season (Peel
et al., 2007). The average annual rainfall (1982–2003) is 813 mm, of which 95% falls between
June to September (Ortiz-Jiménez et al., 2005). Mean annual temperature (1982–2003) is 19.6 ºC
with maximum temperatures occurring in July (Ortiz-Jiménez et al., 2005). The catchment is
dominated by two distinct forest types. The highly heterogeneous mixed deciduous forest
(dominated by Carpinus caroliniana and Mimosa adenantheroides but with a complex mix of
understorey and herbaceous vegetation) occurs at elevations between 1600 and 1800m above sea
level (masl) (Figure 2.1). The pine-oak forest (almost exclusively Pinus montezumae and
Quercus laeta with a largely unvegetated understorey) occurs exclusively at elevations greater
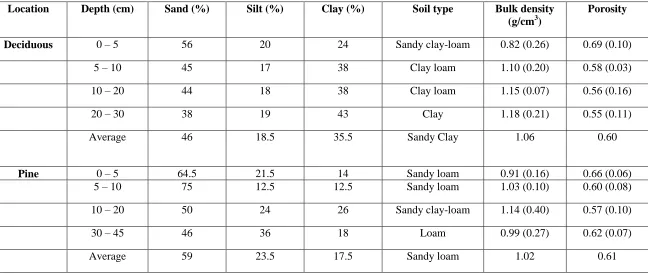
than 1800 masl. Prior to our investigation, soil cores were collected from the upper 50 cm of the
soil profile at both forests and were analysed for particle size distribution using the hydrometer
technique (Bouyoucos, 1962), bulk density (ρb) and total porosity (n). Total porosity was
calculated on the basis of the relationship between ρb and particle density (ρp) (Dingman, 2002).
The texture in the upper 50 cm of soil varies between forest types. Soil at the deciduous forest is
characterized as sandy clays, whereas sandy loams are present at the pine forest (Table 2.2). The
portion of stone fragments in the surface soil was low, representing less than 5% of the total soil
19
Figure 2.1 Map showing the location of the study watershed, instrumentation and sampling transects.
Two 100-m-long transects were established in each forest type and instrumented with a rain
gauge and soil moisture probes from July 2010 to June 2011 (Figure 2.1). Near-saturated
hydraulic conductivity and soil water repellency measurements were made at 10m intervals
along each transect during this period. These sites were selected as they represented the typical
20
Table 2.2 General soil physical properties at different depths at the deciduous and pine forest. Values in parentheses indicate standard deviation
Location Depth (cm) Sand (%) Silt (%) Clay (%) Soil type Bulk density (g/cm3)
Porosity
Deciduous 0 – 5 56 20 24 Sandy clay-loam 0.82 (0.26) 0.69 (0.10)
5 – 10 45 17 38 Clay loam 1.10 (0.20) 0.58 (0.03)
10 – 20 44 18 38 Clay loam 1.15 (0.07) 0.56 (0.16)
20 – 30 38 19 43 Clay 1.18 (0.21) 0.55 (0.11)
Average 46 18.5 35.5 Sandy Clay 1.06 0.60
Pine 0 – 5 64.5 21.5 14 Sandy loam 0.91 (0.16) 0.66 (0.06)
5 – 10 75 12.5 12.5 Sandy loam 1.03 (0.10) 0.60 (0.08)
10 – 20 50 24 26 Sandy clay-loam 1.14 (0.40) 0.57 (0.10)
30 – 45 46 36 18 Loam 0.99 (0.27) 0.62 (0.07)
21
2.3 Methods
2.3.1 Rainfall measurements
Open-field precipitation was measured using a Texas Electronics Inc. TE525M-L tipping bucket
rain gauge from July 2010 to June 2011 at the deciduous forest site (Figure 2.2). The depth
(mm), duration (h) and intensity (mm/h) were calculated for individual storm events over the
measurement period.
2.3.2 Soil surface hydraulic conductivity
Near-saturated hydraulic conductivity was measured in July and August 2010 using a Decagon
Devices Inc. Mini disk infiltrometer. The mini disk infiltrometer may not be the ideal tool for
near-saturated hydraulic conductivity measurements because of the small disk diameter (4.5 cm)
and small area of influence; however, conductivity results from this device are accepted in the
literature (González-Pelayo et al., 2010; Ronayne et al., 2012). This device was used because of
its portability and low water volumes required for each test, both necessitated by the remote and
mountainous sampling locations, which would render the use of more sophisticated devices such
as a Guelph Permeameter impractical. At each sampling location, duplicate measurements of
hydraulic conductivity were made within 50 cm of the other, under a pressure head of -2 cm.
Despite rugged terrain and private property access issues, a total of 80 measurements were made
in these forests. At each location, prior to measurement, the soil surface was cleared of large
fragments of loose coarse organic litter and the surface smoothed to allow complete contact
between the infiltrometer and soil surface. Where the surface was uneven, a thin layer of fine
silica sand was placed underneath the stainless steel disk to produce a smooth surface and
improve contact with the soil. The infiltrometer was held in place using a ring stand and clamp.
Tests were run until a steady state infiltration rate was achieved.
The hydraulic conductivity (K) of the soil was calculated according to Zhang (1997).
2 1 A C
22
where C1 is the slope of the curve of the cumulative infiltration vs. the square root of time (t),
and A2 is a dimensionless coefficient. The value of A2 depends on the suction disk diameter and the soil texture of the sample location. A2 is calculated from:
0.91
1 . 0 2 ) ( ] ) 9 . 1 ( 92 . 2 exp[ ) 1 ( 65 . 11 o o r h n n A
(2.2)
where n and α are the van Genuchten parameters for a specific soil texture (Carsel and Parrish,
1988), r0 is the disk radius, and h0 is the suction at the disk surface.
2.3.3 Soil water repellency
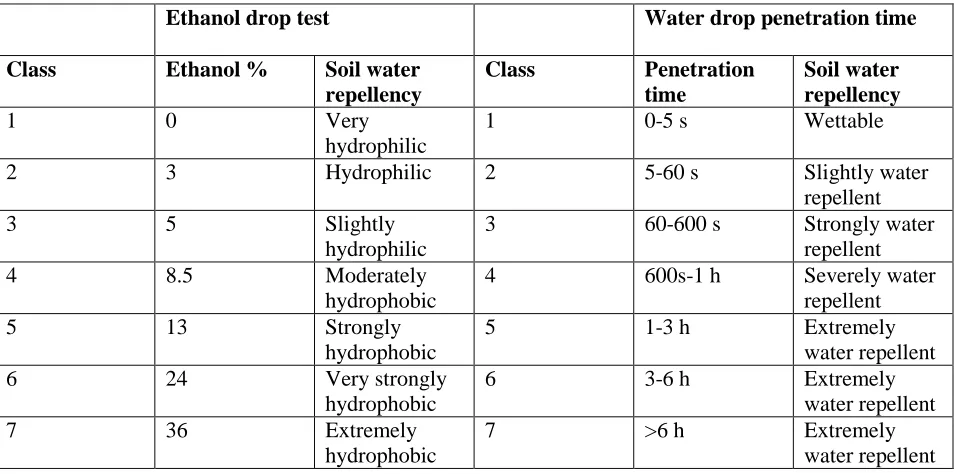
Soil water repellency was measured in August 2010, December 2010, May 2011 and June 2011
using the molarity of an ethanol drop test (Watson and Letey, 1970). This test utilizes the known
surface tensions of standardized solutions of ethanol in water. Droplets (~0.5 ml) with increasing
ethanol concentrations (0%, 3%, 5%, 8.5%, 13%, 24% and 36% ethanol in deionized water) were
applied to the bare soil surface until the droplet infiltrated in <5 s (Watson and Letey, 1970). The
results from the ethanol drop tests were categorized into simple hydrophobicity classes (Table
2.3). As there is no standard for the presentation of hydrophobicity data, we have elected to
present our results in terms of simple hydrophobicity classes. To allow for comparison with other
hydrophobicity studies, the ethanol concentrations were converted to its equivalent water drop
23
Table 2.3 Ethanol drop test and Water drop penetration time after Doerr (1998)
Ethanol drop test Water drop penetration time
Class Ethanol % Soil water repellency
Class Penetration time
Soil water repellency
1 0 Very
hydrophilic
1 0-5 s Wettable
2 3 Hydrophilic 2 5-60 s Slightly water
repellent
3 5 Slightly
hydrophilic
3 60-600 s Strongly water
repellent
4 8.5 Moderately
hydrophobic
4 600s-1 h Severely water
repellent
5 13 Strongly
hydrophobic
5 1-3 h Extremely
water repellent
6 24 Very strongly
hydrophobic
6 3-6 h Extremely
water repellent
7 36 Extremely
hydrophobic
7 >6 h Extremely
water repellent
Before infiltration and repellency measurements were made, soil samples adjacent to
measurement plots were taken to a 5 cm depth and were used to determine the volumetric water
content (VWC) and soil textural properties (Bouyoucos, 1962).
2.3.4 Soil water content measurements and soil water response
Volumetric water content was measured at two soil pits at each of the forest transects using
Campbell Scientific Inc. CS615 water content reflectometers from July 2010 to June 2011. These
probes were inserted horizontally in the pits at depths of 10, 20 and 30 cm at the deciduous forest
and 10, 20 and 45 cm below the surface at the pine forests. The reflectometers were calibrated in
the lab using soil extracted from the same area as per Stenger et al. (2005). Total depth
equivalent of soil water (mm) was calculated as the VWC (%) from each layer multiplied by the
thickness of the measurement layers centred about each measurement (mm).
Soil water infiltration and percolation through the soil pits were characterized for 62 storm
events, from 1 July 2010 to 30 June 2011. Events ≥2mm were selected for characterization as
they produced a measurable change in shallow soil moisture. Infiltration and percolation rates
24
soil water at each water content reflectometer probe, for both forest sites. The total event
increase in soil water was calculated as the difference between the soil water prior to the start of
the event and the peak increase in soil water during the storm event.
2.4 Results and discussion
2.4.1 Rainfall
A total of 765mmof rainfall was measured between 1 July 2010 and 30 June 2011, 7.9% below
the long-term annual average of 831mm (Figure 2.2). A total of 49% of the rainfall fell from
June to July during the early wet season, whereas 50% was delivered from August to September
during the late wet season (Figure 2.2). Only one rainfall event was recorded during the dry
period. This 9mm event occurred during the early dry season (~1% of the annual precipitation)
(Figure 2.2).
Figure 2.2 Daily rainfall from July 2010 to June 2011. The grey arrow indicates rain gauge error and period of data loss.
Over this 1 year period, there were 62 discrete rainfall events. By using frequency distribution
analysis, the events were categorised into 25th, 75th and 95th percentiles. Rainfall events
≤18mm occurred 47 times (75% of all events) but only accounted for 39% of the total rainfall,
whereas storm events >18mm occurred 16 times (25% of all events) and accounted for 61% of
the total annual rainfall during the study period. Storms were generally of short duration, with
25
for 5% of all storms (Figure 2.3). Rainfall intensity ranged between 0.2 and 26.1 mm/h, but only
5% of the events exceeded 17 mm/h (Figure 2.3). These relatively higher intensity events only
contributed to 12% of the total annual rainfall. Storms with intensities ≤4.2 mm/h represent 75%
of the events and constituted 64% of the annual rainfall. The high frequency of low intensity
events can be attributed to convective storms of local atmospheric origin in the region
(García-Oliva et al., 1995). Over an 8-year period, García-(García-Oliva et al. (1995) showed that only 3% of
storm events had intensities that were greater than 24 mm/h and attributed this to the low
frequency of cyclonic storm systems.
Figure 2.3 Frequency distribution of a) depth (mm), b) duration (h) and c) intensity (mm/h) for 62 storm events
The rainfall characteristics at this research site are similar to those of many semi-arid regions,
dominated by short-duration, low-intensity events during the wet season (Martínez-Mena et al.,
26
maximum recorded rainfall intensity is only 26.1 mm/h and was substantially lower than other
maximum intensities in the semi-arid literature (Table 2.1). Secondly, the contribution of
high-intensity events to the total annual rainfall is only 12% as compared with 70% for semi-arid
catchments (Wilcox et al., 1997; Martínez-Mena et al., 1998).
2.4.2 Soil surface hydraulic conductivity
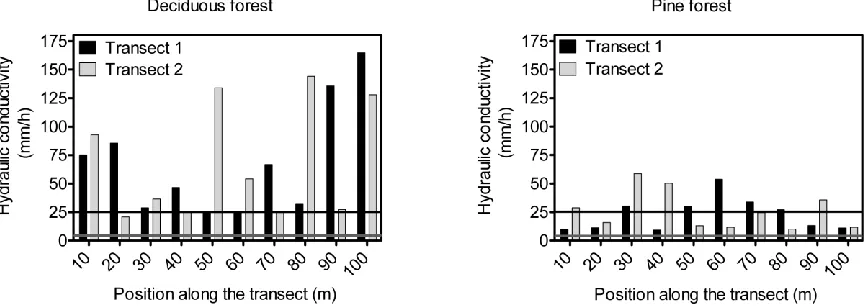
At the deciduous forest, K was spatially variable across both transects (Figure 2.4). Hydraulic
conductivity ranged from 24.4 to 164.0 mm/h at transect one and 21.0 to 144.1 mm/h at transect
two. The mean K was 68.7 ± a standard deviation of 49.4 mm/h, with a median value of 50.4
mm/h. Hydraulic conductivity at all measurement locations was greater than the 75th percentile
of rainfall intensity, whereas three of the 20 measurements had K that was less than the
maximum rainfall intensity (Figure 2.4). Given that K exceeds the rainfall intensity of 75% of the
storm events, infiltration would not be limited during most of the wet period, and HOF is not
generated during these events.
Hydraulic conductivity at the pine forest was also heterogeneous (Figure 2.4). The K values
ranged from 9.2 to 53.9 mm/h at transect one and 11.8 to 58.8 mm/h at transect two; with a mean
value of K was 25.0 ± a standard deviation of 17.0 mm/h, which was two times lower than the
deciduous forest. The relationship between K and rainfall intensity was similar to the deciduous
forest. Hydraulic conductivity values at all measurement points exceeded the 75th percentile of
rainfall intensity (Figure 2.4). Unlike the deciduous forest, there were a greater number of
measurement locations where K was lower than the maximum rainfall intensity (Figure 2.4).
These 11 points indicate that under the highest intensity, infiltration would be limited over much
of the surface, and HOF can be generated.
The mean K values of 68.0 mm/h at the deciduous forest and 25.0 mm/h at the pine forest were
greater than K measured in many semi-arid areas (Table 2.1). The higher K at our site is likely a
result of the higher density of vegetation and understorey growth than in semi-arid catchments.
Lavee et al. (1998) observed that infiltration increased from arid to semi-arid to sub-humid
27
infiltration through macropore formation and preferential flow along root channels (Bergkamp
1998; Calvo-Cases et al., 2003). Greater plant density also improves soil stability and reduces
surface crust formation as a result of greater organic matter input (Wilcox et al., 1988; Lavee et
al., 1998).
Figure 2.4 Spatial distribution of surface hydraulic conductivity (mm/h) along two transects at a) the deciduous forest and b) the pine forest. The black horizontal line indicates the maximum rainfall intensity. The grey horizontal line indicates the 75th percentile of rainfall intensity
Our results show that unlike many semi-arid regions, K does not limit infiltration across most of
the ground surface. In many semi-arid regions, rainfall intensity exceeds K producing HOF
(Table 2.1). At our research site, 90% of the storm events did not exceed K at the deciduous
forest and 85% did not exceed K at the pine forest, indicating that HOF would not occur through
most of the wet season. At locations where the rainfall intensity exceeds K, HOF will be
generated. However, this surface flow will be discontinuous across the hillslope as it would
re-infiltrate at high K surfaces downslope. This response is more like that of humid temperate
forests, where relatively higher K and low-intensity rainfall promote infiltration and the
production of more vertical and lateral subsurface flows (Bonell, 1993).
2.4.3 Soil water repellency
Soil water repellency at the deciduous forest showed high temporal variability (Table 2.4). Fifty
days after the start of rainfall (late wet), the soil surface was non-repellent with a mean water
drop penetration time of 0 s. When measured 54 (early dry) and 177 (late dry) days after the last