Rare Earth Elements And Rare Elementsconcentration In
Two Pegmatite Fields Within North-Central Nigerian
Precambrian Basement Complex: Implication For
Mineralization
1
Y.S. Agunleti and 2S.L. Salau 1
Department of Geology and Mining, Nasarawa State University, Keffi, Nigeria
2
Department of Geology, Ahmadu Bello University, Zaria, Nigeria
E-mail: [email protected]
Abstract
The Precambrian pegmatites of Akwanga (field 1)and Keffi (field 2) area were studied for their rare earth elements and rare elements (rare metals) concentration. A total of 12 whole rock samples were analysed for major, trace and rare earth elements using inductively Coupled Plasma-Atomic Emission Spectrometry (ICP-AES) analytical technique. Rare earth element (REE) is an emerging alternative energy technology, such as electric vehicles, energy-efficient lighting, and wind power. Ce, Pr, Nd, Sm, Eu, Gd and Y in field 1 is less than field 2 as (4.06 <5.48), (0.83 < 2.52), (2.95 < 10.65), (0.72 < 2.23), (0.22 < 0.34), (0.69 < 2.30) and (4.90 < 14.18) respectively while La, Tb, Dy, Ho, Er, Th, Yb and Lu in field 1 greater than field 2 as (4.25 > 2.40), (0.15 > 0.14), (0.75 > 0.53), (0.21 > 0.13), (0.40 > 0.32), (1.71 > 1.18), (0.51 > 0.35) and (0.09 > 0.05) respectively. The anomalous concentration of Neodymium (10.65 ppm) and Yttrium (14.18 ppm) in the study area is close and can be compared with international published works on REE. Rare elements data show that the rare metal Ta, Nb, Cs and Sn increases from field 1 to 2 with tantalum ranges from 1.49 to 78.32 ppm, niobium (12–25.15 ppm), cesium (8.56 – 16.05) and Tin ranges from 10.25 – 52.50.Meanwhile Binary plots revealed that most of the samples plot in the barren field than in the mineralized field.
Keywords:ICP-AES, Anomalous, Rare Earth Elements, Rare Elements and Pegmatite
1. Introduction
The purpose of this paper is to describe and compare rare earth elements and rare elements in two pegmatite fields. The research area is located within the basement complex rocks of north central Nigeria (Fig. 1). Pegmatite fields 1 is found in Akwanga area while pegmatite field 2 in Keffi area both in Nasarawa State and are separated with distance approximately 68.007km in a ENE-SSW trend (Fig. 2). This trend is in accordance with pegmatite zone of(Kinnaird, 1984).Rare Earth Elements was first
essential for a diverse and expanding array of high-technology applications but industrial demand is relatively small in tonnage terms. Meanwhile, Rare Elements are unique elements that contrary to REE are not grouped based on similar chemical behaviour. The rare elements are strategic elements, generally metals that are of important to a country’s economy or defense. The list varies with country but includes Ta, Nb, Be, Sb and W. An important class of rareelement pegmatites
is the complex-type pegmatites of the LCT (Li–Cs–Ta) family (ˇCerný and Ercit, 1989). This type of pegmatite contains extremely high concentrations of Rb, Cs, Be, Ta, Nb, and Sn as well as (Li, P, F, and B). The LCT pegmatites are typically associated with latetectonic peraluminous granites, and their emplacement is controlled at least in part by shear zones (Cerný, 1989a & 1989b; London, 2008).
Fig. 1: Basement geology of Nigeria (In Obaje, 2009)
2. The Nigerian basement complex
The Nigerian basement complex forms a part of the Pan-African mobile belt and lies between the West African and Congo Cratons and south of the Tuareg Shield (Black, 1980). The basement complex is one of the three major litho-petrological
components that make up the geology of Nigeria (Fig. 3). Rahaman (1988) in the recent advances to the study of the Nigeria Basement Complex subdivides the basement complex rocks into six major groups. They are;
1. Migmatite – gneiss – quartzite complex
2. Slightly migmatised to non-migmatised metasediment and meta-igneous rocks.
3. Chanockitic, gabbroic and dioritic rocks 4. Members of the older granite suites
5. Metamorphosed to unmetamorphosed calc-alkaline volcanics and hypabyssal rocks.
6. Unmetamorphosed dolerite dykes, basic dyke and syenite dyke.
BF
CF
Tertiary - Recent sediments Tertiary volcanics Cretaceous
Jurassic Younger Grantes Precambrian Basement
Benin Flank Calabar Flank
Major (reference) town Kano Kaduna Bauchi Jos Minna Abuja Lafia o Ilorin Ibadan Lagos Akure Benin Warri PortharcourtCalabar Enugu Abakaliki Maiduguri Lokoja o Sokoto ATLANTIC OCEAN Lake Chad A na m b ra Ba sin MID -NIG ER/ BIDA BA SIN
CHAD (BORNU) BASIN
R.Be nue
NIGE R DELT
A COM
PLE X
CA ME RO ON BE NI N
N I G E R CH
A D BF CF 200 km SOKO TO BAS IN LOWER BENUE MIDD LEB E
NUE UPPE
RBE N UE
Makurdi Go ng ola su bb as in
Yola s ubbasin
5°N 10°
5°E 10°
R. Nige r
3. Methodology
The study areas were traversed and fresh whole rock pegmatite samples were collected from chipping off the host rock using a hammer. The locations include exposed pegmatite outcrops which are mostly flat lying and others in form a ridgewith no visible contact with host rock in field 1. The thick overburden of laterite in this area must have been responsible for lack of exposed contact between pegmatite with the host rock. However, pegmatite
veins were clearly studied with sharp contact with the host rock, migmatite and biotite gneisses around Gwangi and Gunje in fied 2. Representative samples were clearly labeled and transported for processing and analysis.Eight whole rock pegmatite samples in field 1 and four in field 2 for elemental analysis were pulverized, sieved on the 80 microns mesh and then about 10 grams put into clean sealed envelopes for geochemical analysis at Acme analytical Laboratory, Vancouver, Canada.
4. Data Presentation
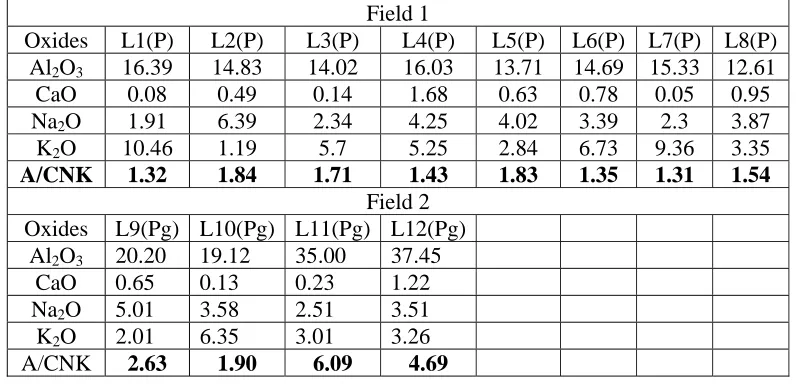
Table 1: Major Element Data of Field 1and Field 2 pegmatite in percent (%) ICP-AES (P, Pg. = Whole rock Pegmatite)
Field 1
Oxides L1(P) L2(P) L3(P) L4(P) L5(P) L6(P) L7(P) L8(P) Al2O3 16.39 14.83 14.02 16.03 13.71 14.69 15.33 12.61
CaO 0.08 0.49 0.14 1.68 0.63 0.78 0.05 0.95 Na2O 1.91 6.39 2.34 4.25 4.02 3.39 2.3 3.87 K2O 10.46 1.19 5.7 5.25 2.84 6.73 9.36 3.35
A/CNK 1.32 1.84 1.71 1.43 1.83 1.35 1.31 1.54
Field 2
Oxides L9(Pg) L10(Pg) L11(Pg) L12(Pg) Al2O3 20.20 19.12 35.00 37.45
CaO 0.65 0.13 0.23 1.22
Na2O 5.01 3.58 2.51 3.51
K2O 2.01 6.35 3.01 3.26
A/CNK 2.63 1.90 6.09 4.69
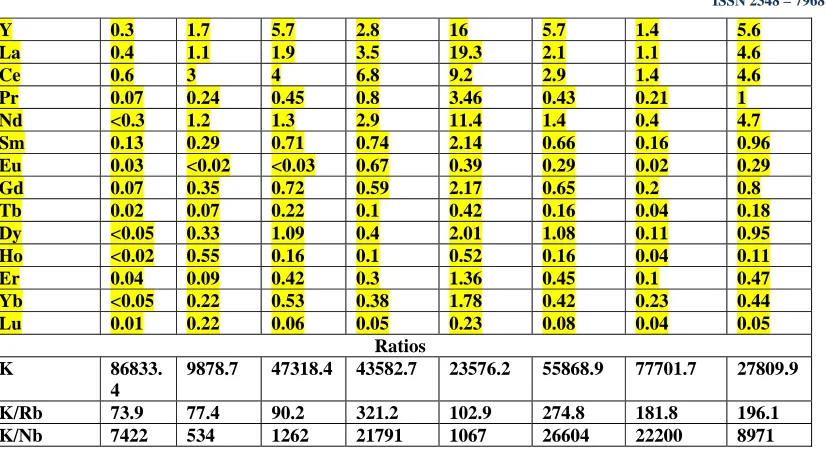
Table 2: REEs (yellow) and REs (green) in Field 1: P = Whole rock Pegmatite (Unit in ppm) Elements L1(P) L2(P) L3(P) L4(P) L5(P) L6(P) L7(P) L8(P)
Be 24 1 3 1 2 7 <1 4
Cs 26.3 2 4.1 5.6 3.2 6.6 17.2 3.5
Ga 27.6 31 39.8 19 34.2 20.9 13.8 16.8
Hf 0.7 <0.1 0.2 0.5 0.5 0.7 0.3 0.4
Nb 11.7 18.5 37.5 2 22.1 2.1 3.5 3.1
Rb 1175.3 127.6 524.7 135.7 230.9 203.8 427.3 141.8
Sn 20 7 20 <1 14 2 13 5
Y 0.3 1.7 5.7 2.8 16 5.7 1.4 5.6
La 0.4 1.1 1.9 3.5 19.3 2.1 1.1 4.6
Ce 0.6 3 4 6.8 9.2 2.9 1.4 4.6
Pr 0.07 0.24 0.45 0.8 3.46 0.43 0.21 1
Nd <0.3 1.2 1.3 2.9 11.4 1.4 0.4 4.7
Sm 0.13 0.29 0.71 0.74 2.14 0.66 0.16 0.96
Eu 0.03 <0.02 <0.03 0.67 0.39 0.29 0.02 0.29
Gd 0.07 0.35 0.72 0.59 2.17 0.65 0.2 0.8
Tb 0.02 0.07 0.22 0.1 0.42 0.16 0.04 0.18
Dy <0.05 0.33 1.09 0.4 2.01 1.08 0.11 0.95 Ho <0.02 0.55 0.16 0.1 0.52 0.16 0.04 0.11
Er 0.04 0.09 0.42 0.3 1.36 0.45 0.1 0.47
Yb <0.05 0.22 0.53 0.38 1.78 0.42 0.23 0.44
Lu 0.01 0.22 0.06 0.05 0.23 0.08 0.04 0.05
Ratios K 86833.
4
9878.7 47318.4 43582.7 23576.2 55868.9 77701.7 27809.9
K/Rb 73.9 77.4 90.2 321.2 102.9 274.8 181.8 196.1
K/Nb 7422 534 1262 21791 1067 26604 22200 8971
Table 3: REEs (yellow) and REs (green) in Field 2: Pg = Whole rock Pegmatite (Unit in ppm)
Elements L9(Pg) L10(Pg) L11(Pg) L12(Pg)
Be 10 2 6 9
Cs 8.4 5.3 45.3 5.2
Ga 33.8 20.2 40.8 34.4
Hf 0.8 1 1.5 3.4
Nb 29.5 6.6 37.3 27.2
Rb 163.6 364.2 434.9 176.4
Sn 19 12 137 42
Ta 13.7 61 185 53.6
Th 1.1 0.4 0.7 2.5
Ce 6.3 2.3 2.8 10.5
La 3.3 1.2 1.3 3.8
Zr 15.7 14.6 10.7 179.7
Y 7.3 1.6 1 46.8
Pr 0.63 0.25 0.26 8.95
Nd 1.6 1 1.2 38.8
Sm 0.61 0.17 0.23 7.91
Eu 0.06 0.03 0.02 1.26
Gd 0.85 0.18 0.26 7.91
Tb 0.22 0.05 0.04 0.23
Dy 1.28 0.31 0.29 0.23
Ho 0.21 0.03 0.03 0.23
Er 0.59 0.09 0.06 0.57
Yb 0.53 0.16 0.13 0.58
Lu 0.07 <0.01 0.02 0.08
Ratios
K 16686 52715 24988 29138
K/Rb 102 145 58 165
Table 4: Averages of Rare Earth Elements (REEs) and Rare Elements (REs) of Whole rock Pegmatite in Field 1&2
Elements Symbols Average Rare Earth Elements
(ppm)
Elements Symbols Average Rare Elements (Rare Metal)
(ppm) Field 1 Field 2 Field 1 Field 2 Lanthanum La 4.25 2.40 Beryllium Be 5.38 6.75
Cerium Ce 4.06 5.48 Cesium Cs 8.56 16.05
Praseodymium Pr 0.83 2.52 Gallium Ga 25.39 32.30
Neodymium Nd 2.95 10.65 Germanium Ge - -
Samarium Sm 0.72 2.23 Hafnium Hf 0.43 1.68
Europium Eu 0.22 0.34 Indium In - -
Gadolinium Gd 0.69 2.30 Lithium Li - -
Terbium Tb 0.15 0.14 Niobium Nb 12.56 25.15 Dysprosium Dy 0.75 0.53 Rubidium Rb 370.89 284.78
Holmium Ho 0.21 0.13 Tin Sn 10.25 52.50
Erbium Er 0.40 0.32 Tantalum Ta 1.49 78.32
Thulium Th 1.71 1.18 Zirconium Zr 8.78 55.18
Ytterbium Yb 0.51 0.35
Lutetium Lu 0.09 0.05
Yttrium Y 4.90 14.18
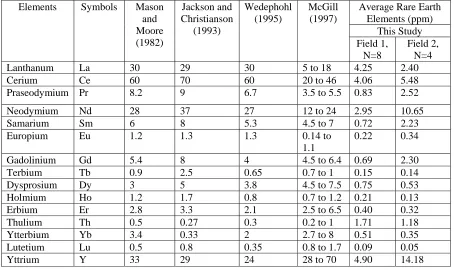
Table 5: Estimates of the Crustal abundances of rare earth elements (unit of measure in ppm)
Elements Symbols Mason
and Moore (1982)
Jackson and Christianson
(1993)
Wedephohl (1995)
McGill (1997)
Average Rare Earth Elements (ppm)
This Study Field 1,
N=8
Field 2, N=4
Lanthanum La 30 29 30 5 to 18 4.25 2.40
Cerium Ce 60 70 60 20 to 46 4.06 5.48
Praseodymium Pr 8.2 9 6.7 3.5 to 5.5 0.83 2.52
Neodymium Nd 28 37 27 12 to 24 2.95 10.65
Samarium Sm 6 8 5.3 4.5 to 7 0.72 2.23
Europium Eu 1.2 1.3 1.3 0.14 to
1.1
0.22 0.34
Gadolinium Gd 5.4 8 4 4.5 to 6.4 0.69 2.30
Terbium Tb 0.9 2.5 0.65 0.7 to 1 0.15 0.14
Dysprosium Dy 3 5 3.8 4.5 to 7.5 0.75 0.53
Holmium Ho 1.2 1.7 0.8 0.7 to 1.2 0.21 0.13
Erbium Er 2.8 3.3 2.1 2.5 to 6.5 0.40 0.32
Thulium Th 0.5 0.27 0.3 0.2 to 1 1.71 1.18
Ytterbium Yb 3.4 0.33 2 2.7 to 8 0.51 0.35
Lutetium Lu 0.5 0.8 0.35 0.8 to 1.7 0.09 0.05
Fig.4: K/Kb Vs Rb plot, discrimination line separates the field of rare metal pegmatite from the barren class (After Staurov et al., 1969). Data of field 1 in square blue and field 2 in red, also for fig. 5-7
Fig. 5: Plot of relationship among K/Rb and Cs, the discrimination line RMP seperates mineralized from non-mineralized pegmatites. Most of the data plot in the non-mineralized zone (After Moller and Morteani, 1987)
-5 0 5 10 15 20 25 30 35 40 45 50 55
0 50 100 150 200 250 300 350 400
Cs K/Rb
RMP
-200 0 200 400 600 800 1000 1200 1400
0 50 100 150 200 250 300 350 400
Rb K/Rb
Barren
Fig. 6: Be vs K/Nb distribution pattern falls below the mineralization zone (Beus, 1966)
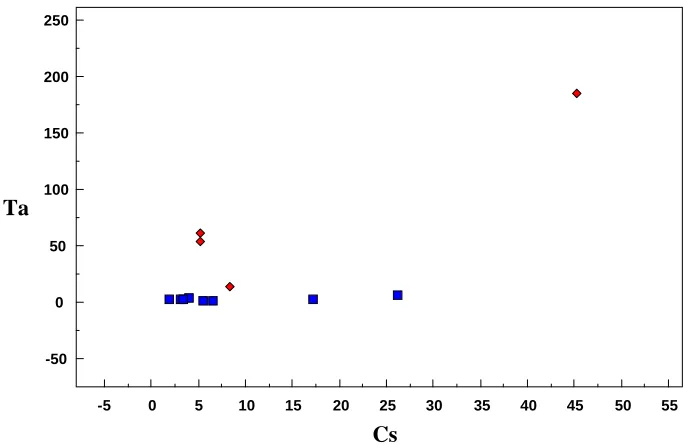
Fig. 7: Ta vs Cs of the study area plots far below mineralized pegmatite, TKS Tanco, Canada (After Moller and Morteani, 1987)
-5 0 5 10 15 20 25 30 35 40 45 50 55
-50 0 50 100 150 200 250
Cs Ta
-5000 0 5000 10000 15000 20000 25000 30000 35000 -5
0 5 10 15 20 25 30
K/Nb Be
Mineralized
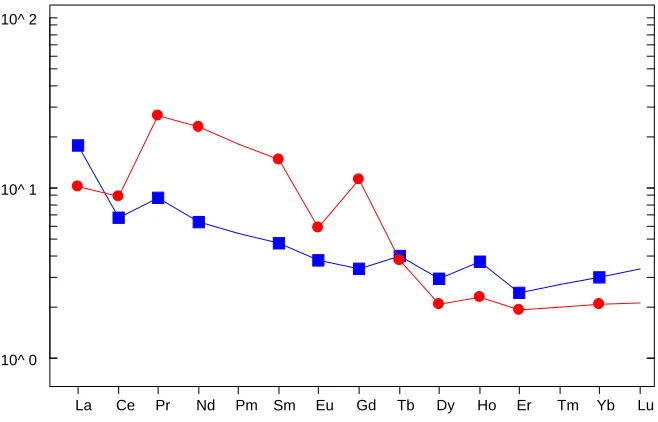
Fig. 8: Chondrites normalized plots of average rare earth elements (REE) in field 1 (square blue) field 2 (round red) after (Sun and McDonald, 1989)
5. Discussion and Conclusion
Whole rock pegmatite samples from the study areas were studies for their major oxides. Computation from table 1 for field 1&2 reveal that the whole rock pegmatite sample can be classified as peraluminous i.e. (Al2O3> CaO+Na2O+K2O). Table 2 & 3 shows the result of rare earth elements and rare earth (rare metals) for field 1& 2 respectively. Attempt was made in table 4 to juxtapose results of rare earth elements in field 1 & 2 and also for rare elements in field 1 &2. According to Taylor and McLennan (1985) Cerium is the most abundant REE, and it is actually more common in the Earth’s crust than is copper or lead and all of the REE except promethium are more abundant than silver or mercury. Rare earth elements (REE) in magnets (needs Pr and Nd), in metal alloys and for batteries (needs La, Ce, Pr and Nd) while in petroleum refining (needs La and Ce) and for many current and emerging alternative energy technologies, such as electric vehicles, energy-efficient lighting, and wind power. Ce, Pr, Nd, Sm, Eu, Gd
and Y in field 1 is less than field 2 as (4.06 <5.48), (0.83 < 2.52), (2.95 < 10.65), (0.72 < 2.23), (0.22 < 0.34), (0.69 < 2.30) and (4.90 < 14.18) respectively while La, Tb, Dy, Ho, Er, Th, Yb and Lu in field 1 greater than field 2 as (4.25 > 2.40), (0.15 > 0.14), (0.75 > 0.53), (0.21 > 0.13), (0.40 > 0.32), (1.71 > 1.18), (0.51 > 0.35) and (0.09 > 0.05) respectively. The anomalous concentration of Neodymium (10.65 ppm) and Yttrium (14.18 ppm) in the study area is close and can be compared with works of (Mason and Moore, 1982; Jackson and Christianson, 1993; Wedephohl, 1995; McGill, 1997) as shown in table 5. The rare elements data (table 4) show that the rare metal Ta, Nb, Cs and Sn increases from field 1 to 2. Tantalum ranges from 1.49 to 78.32 ppm, niobium (12–25.15 ppm), cesium (8.56 – 16.05) and Tin ranges from 10.25 – 52.50. The K/Rb Vs Rb plot (Staurov et al., 1969) (Fig. 4) which seperates barren fractionation sequence and mineralized pegmatite show potential for rare metals in the study area as almost 50% of the samples plots within the mineralized zone, but plot of K/Rb Vs
10^ 1 10^ 2
10^ 0
Cs (Fig. 5) show a lot of the pegmatite samples plotting in the barren field than in the mineralized field. Further evaluation of level of mineralization of the pegmatites using the Be vs K/Nb (fig. 6) and Ta vs Cs (fig. 7) according to (Beus, 1966; Moller and Moteani, 1987) respectively shows that the samples plot far below the boundary of mineralization. Chondrite normalized plot of the rare earth element (REE) of the study area shows negative Ce (Fig. 8) and the presence of this trend confirmed a late stage or metasomatic fluids in the genesis of the rocks. Also,
negative Europium (Eu) signature which according to Taylor et al. (1986) suggests fractionation and indicates late metasomatic effect.
In conclusion, geochemical studies of whole rock pegmatite samples in the study area show that the pegmatites are peraluminous in composition. Rare earth elements analysis shows mineable potential and can be further explored for higher concentration, while rare metal mineralization shift from filed 1 to field 2 for further exploration as well.
Reference
Beus, A. A., 1966: Geochemical exploration for endogenic deposits of rare elements on the example of tantalum. Nedra, Moscow, Engl. Transl. GSE Libr, Ottawa.
Black, R., 1980: Precambrian of West Africa. Episodes 4:3–8.
Cerny, P., 1989a: Characteristics of pegmatite deposits of Tantalum. In:
Lanthanides, tantalum and niobium. P. Moller, P. Cerny and F. Saupe (eds.), Springer- Verlag, Berlin, 145-154.
Cerny, P., 1989b: Exploration strategy and methods for pegmatite deposits of tantalum. In: Moller, P., Cerny, P. and Saupe, F. (eds). Lanthanides, Tantalum and Niobium: Society for Geology Applied to Mineral Deposits, Special Publication 7, Springer-Verlag, 271-299 pp.
Cerny, P. & Ercit, T.S., 1989: Mineralogy of niobium and tantalum: crystal chemical relationships, paragenetic aspects and their economic implications. In Lanthanides, Tantalum, and Niobium (P. Mdller, P. Cernf & F. Saup, eds.). Springer-Verlag, Berlin (27-79).
Kinnaird, J.A., 1984: Contrasting styles of Sn-Nb-Ta-Zn mineralization in
London, D., 2008:Pegmatites, Canadian Mineralogist Special Publication 10. Quebec: Mineralogical Association of Canada.
Moller, P. and Morteani, G., 1987: Geochemical guide for tantalum pegmatite Economic Geology, 12, 1885- 1897
Obaje, N.G., 2009: Geology and mineral sources of Nigeria. Springer Dordrecht Heidelberg London New York,
221pp.http://dx.doi.org/10.1007/978-3-540-92685-6.
Rahaman, M. A., 1988: Recent advances in the study of the basement complex ofNigeria. In: Geological Survey of Nigeria (ed) Precambrian Geol Nigeria, pp 11–43
Staurov, O.D., Stolyarov, L.S. and Isochewa, E.I., 1969: Geochemistry and origin of Verkh Iset Granitoid massif in central Ural. Geochem Intern. 6 1138-1146
Taylor, S.R., McLennan, S., 1985.The Continental Crust: Its Composition and Evolution: Blackwell, Oxford, 312 p.