Using the IRI, the MAGIC model, and the co-located ground-based
GPS receivers to study ionospheric solar eclipse
and storm signatures on July 22, 2009
Chi-Yen Lin1,2, Jann-Yenq Liu1,3,4, Chien-Hung Lin5, Yang-Yi Sun1,2, Eduardo A. Araujo-Pradere2, and Yoshihiro Kakinami1
1Institute of Space Science, National Central University, No. 300, Jhongda Rd., Jhongli City, Taoyuan County 32001, Taiwan 2Cooperative Institute for Research in Environmental Sciences, University of Colorado, and Space Environment Center,
NOAA, Boulder, Colorado 80305, U.S.A.
3Center for Space and Remote Sensing Research, National Central University, No. 300, Jhongda Rd., Jhongli City, Taoyuan County 32001, Taiwan
4National Space Program Origination, 8 F, No. 9, Prosperity 1st Rd., Hsinchu Science Park, HsinChu, Taiwan 5Department of Earth Science, National Cheng Kung University, No. 1, University Road, Tainan City 701, Taiwan
(Received June 17, 2010; Revised August 2, 2011; Accepted August 11, 2011; Online published July 27, 2012)
The longest total solar eclipse in the 21st century occurred in Southeast Asia on 22 July 2009 from 00:55 to 04:15 UT, and was accompanied by a moderate magnetic storm starting at 03:00 UT with a Dst reduction of−78 nT at 07:00 UT. In this study, we use the ionospheric reference model IRI, the data assimilation model MAGIC, and ground-based GPS receivers to simulate and examine the ionospheric solar eclipse and geomagnetic storm signatures in Taiwan and Japan. Cross-comparisons between the two model results and observations show that IRI fails to simulate the two signatures while MAGIC partially reproduces the storm features. It is essential to include ground-based GPS measurements to improve the IRI performance.
Key words:Solar eclipse, geomagnetic storm, IRI, GPS TEC, MAGIC.
1.
Introduction
The ionosphere can be affected by a variety of dis-turbances, including solar flares, coronal mass ejections (CMEs), geomagnetic storms, solar eclipses, etc. Iono-spheric eclipse observations make a worthwhile contribu-tion to study transient properties due to decreasing in the ionizing radiation from the Sun. Scientists have been using the total electron content (TEC) derived from ground-based receivers of the global positioning system (GPS) to monitor the source-response relation between the ambient rates of production, chemical loss, and motion of ionization (see pa-pers listed in Afraimovichet al., 1998; Tsai and Liu, 1999; Jakowskiet al., 2002; Leet al., 2009).
On the other hand, geomagnetic storms are powerful sources that disturb the ionosphere. During geomagnetic storms, the ionosphere has often been observed to devi-ate from its quiet time patterns (Pr¨olss, 1987, 1995; Fesen
et al., 1989; Fejer and Scherliess, 1995; Fuller-Rowellet al., 1998, 2002; Buonsanto, 1999; Liuet al., 1999; Kilet al., 2003; Linet al., 2005, 2007). These storm-generated disturbances in electric field, thermospheric neutral wind, and neutral composition affect the mid- and low-latitude ionosphere significantly during the different phases of the magnetic storm. The ionospheric electron density shows ei-ther increase or decrease due to changes of the ionospheric
Copyright cThe Society of Geomagnetism and Earth, Planetary and Space Sci-ences (SGEPSS); The Seismological Society of Japan; The Volcanological Society of Japan; The Geodetic Society of Japan; The Japanese Society for Planetary Sci-ences; TERRAPUB.
doi:10.5047/eps.2011.08.016
drivers depending on storms, conditions and phases. To simultaneously observe a larger area of the ionosphere responding to solar eclipses and geomagnetic storms, the TEC derived from a network of ground-based GPS re-ceivers is ideal to be employed (Tsai and Liu, 1999). On the other hand, the International Reference Ionosphere (IRI) project was initiated by the Committee on Space Research (COSPAR) and by the International Union of Radio Sci-ence (URSI) in the late sixties with the goal of establish-ing an international standard for the specification of iono-spheric parameters based on all worldwide available data from ground-based as well as satellite observations (Bilitza and Reinisch, 2008). The prime function of IRI is to give a general description of the ionosphere as part of the terres-trial environment. To have a better representation of the ionosphere during the storm periods, an empirical iono-spheric correction model STORM was designed and in-cluded in IRI-2000 and IRI-2007 to capture the changes in F region electron density during geomagnetic storms (Araujo-Pradere and Fuller-Rowell, 2002; Araujo-Pradere
et al., 2002). The model is driven by the previous 33 hours ofap, and the output is used to scale the quiet time F re-gion critical frequency (foF2) to account for increases or decreases in electron density resulting from a storm.
Based on the vertical density profiles from the IRI-95 model, the MAGIC system is developed, which uses ground-based GPS observations to reproduce a four-dimensional model of the electron density in the ionosphere (Araujo-Pradere et al., 2007; Minter et al., 2007). The MAGIC model uses a set of empirical orthogonal functions
514 C.-Y. LINet al.: IRI, MAGIC, AND GPS OF ECLIPSE AND STORM 2009
(EOF) with a Kalman filter to characterize the vertical vari-ation in electron density through the ionosphere.
The solar eclipse of 22 July 2009 (Espennak and Anderson, 2008) is the longest one during the 21st century, not to be surpassed until June 2132. It lasts a maximum of 6 minutes and 39 seconds off the coast of Southeast Asia, through northern Maldives, central China, and the Pacific Ocean. Coincidently, a moderate storm occurs at 03:00 UT during the solar eclipse period. In this study, we use IRI-2007, MAGIC, and the TEC of ground-based GPS receivers to observe ionospheric solar eclipse and magnetic storm ef-fects in the West Pacific region during 22–26 July 2009. IRI simulates the average ionospheric plasma density, while ground-based GPS measurements monitor ionospheric TEC variations. These two provide references to examine the MAGIC performance. Note that this is for the first time MAGIC being used to simulate the ionosphere response to a solar eclipse.
2.
Observation and Simulation
The GPS consists of more than 24 satellites, distributed in 6 orbits around the globe at an altitude of 20,200 km. Each satellite transmits two frequencies of signals, f1=1575.42 and f2 = 1227.60 MHz. Since the ionosphere is a dis-persive medium, scientists are able to evaluate the iono-spheric effects on the radiowave propagation or the corre-sponding ray path TEC with measurements of the modula-tions on carrier phases and code pseudoranges recorded by dual-frequency receivers (Sard´onet al., 1994; Leick, 1995; Liuet al., 1996). Here, the slant TEC (STEC) between a GPS satellite and a ground-based receiver can be written as
STEC= 1
whereL1 andL2denote the carrier phases of the two fre-quencies f1and f2, anddranddsare the differential biases for receiver and satellite, respectively. From the broadcast ephemeris (i.e. the satellite time, elevation, location, etc.) and a given ionospheric (shell) height, the slant TEC along the ray path can be converted, usually using a simple co-sine function of the satellite zenith, into the vertical TEC (VTEC, for simplicity hereafter, TEC) at its associated lon-gitude and latitude (Tsai and Liu, 1999). Here, the vertical TEC is given as (Sover and Fanselow, 1987),
TEC=STEC∗S(χ), (2)
whereh1 and h2 are the lower and upper heights of the ionosphere,Ris the mean radius of the Earth, andχis the zenith angle of a GPS satellite to the receiving station. The TEC is in TEC unit (1 TECu=1016electron/m2).
Fig. 1. The assimilation region and locations of GPS stations. Dotted symbols denote the GPS stations used by the data assimilation model MAGIC. Circle symbols stand for the TEC at 8 locations computed from associated GPS receiving station and extracted from the IRI and MAGIC models. The arc trace represents the totality (100% obscu-ration) of the solar eclipse. STK2 (43.5◦N 141.9◦E), BJFS (39.6◦N 115.9◦E), AIRA (31.8◦N 130.6◦E), SHAO (31.1◦N 121.2◦E), WUHN (30.5◦N 114.4◦E), 0729 (29.5◦N 129.7◦E), TNML (24.8◦N 121◦E), and PIMO (14.6◦N 121.1◦E).
We apply IRI-2007 and the MAGIC model to simu-late the ionospheric TEC and the F2-peak electron den-sity NmF2 and heighthmF2, as well as employ networks of ground-based GPS receivers in Taiwan and Japan to de-rive the TEC during 7 days before to 4 days after the so-lar eclipse of 22 July 2009 (July 15–26, 2009). The aver-age value of 1–7 days before the solar eclipse is computed and considered as the reference which is used to extract the eclipse and storm signatures. Figure 1 displays sim-ulated regions of IRI-2007/MAGIC, locations of ground-based GPS receivers, and the solar eclipse totality path.
The IRI-2007 simulation covers 15–45◦N, 115–145◦E with a spatial resolution of 1◦ in both latitude and longi-tude and a time resolution of 1 hour. To simulate features of the moderate storm occuring at 03:00 UT on the solar eclipse day, the STORM model of the IRI-2007 is turn on and given with the latestap index. For cross comparisons, MAGIC assimilates the data recorded by 213 GPS receiver stations in Taiwan and Japan within the same IRI simula-tion region. The MAGIC model computes the TEC and the electron density with 1◦latitude by 1◦longitude, and 15 km altitude grid every 2 minutes. Meanwhile, based on Liu
et al.(1996), the TECs over 8 GPS stations are derived to monitor the ionospheric solar eclipse and storm signatures.
3.
Result and Interpretation
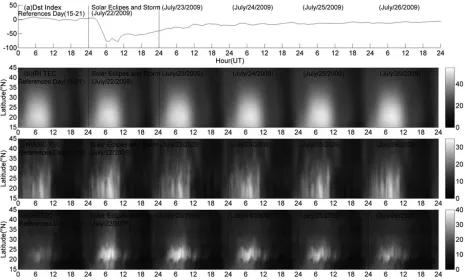
Fig. 2. The magnetic indexDstand Latitude-Time-TEC plots of IRI, MAGIC, ground-based GPS observation during the average of 15–21 and 22–26 July 2009. (a)Dst, (b) IRI, (c) MAGIC, and (d) GPS observation.
the MAGIC TEC somewhat inhabits variations of the two. The IRI TECs are generally similar during the 6 study (i.e. 1-reference+5-event) days, while the MAGIC TEC and observed TEC both yield the minimum on the aver-age/reference day and maximum on the eclipse/storm day. Note that the IRI systemically obtains the greatest value among the three TECs.
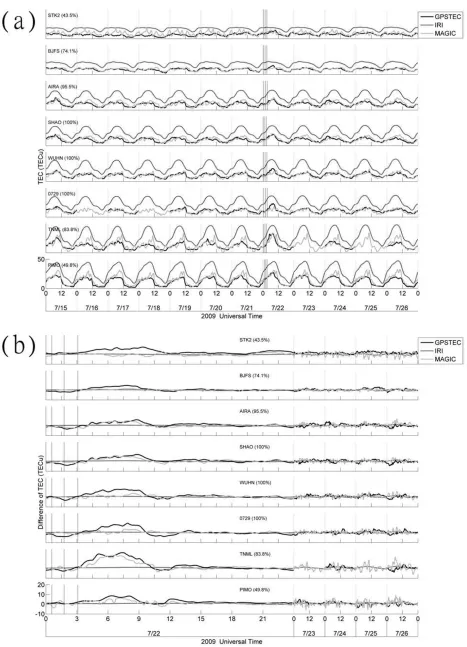
Figure 3 illustrates the TECs of the observation, MAGIC, and IRI during 15–26 July and their differences from the associated references of the 22–26 July 2009 solar eclipse and geomagnetic storm event. The MAGIC TEC agrees well with the observed TEC, while the IRI TEC system-ically yield greatest value amount the three (Fig. 3(a)), which agrees with that shown in Fig. 2. A detailed study of the TEC differences reveals that the observation and the MAGIC detect generally eclipse TEC reduction sig-natures (2–4 TECu) during 00:00–03:00 UT and positive storm (TEC enhancement, about 5 to 15 TECu) features from 03:00 to 10:00–12:00 UT, while IRI fails to detect the two signatures (Fig. 3(b)). Note that the TEC of high mid-latitude stations at STK2 (STK2 and BJFS) of MAGIC fail to capture the eclipse (storm) signature.
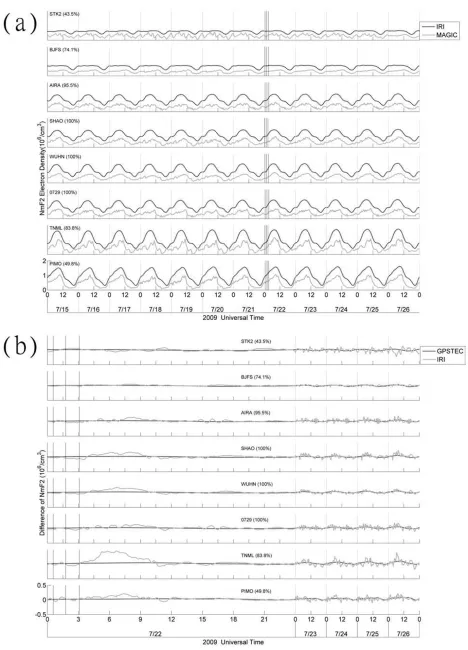
Figure 4(a) shows that the NmF2 of IRI is systemati-cally greater than that of MAGIC. A detailed study by using theNmF2 difference shows that no obvious features are simulated by IRI, while MAGIC successfully repro-duces the positive storm signature except at STK2 and BJFS (Fig. 4(b)). The NmF2 reductions in MAGIC are rather small unclear during the eclipse (Fig. 4(b)). Figure 5(a) il-lustrates that the hmF2 simulated by IRI and MAGIC are similar, expect IRI yielding a greater value near the mag-netic equator at PIMO. Figure 5(b) further shows that both
IRI and MAGIC fail to simulate thehmF2eclipse and storm signatures.
4.
Discussion and Conclusion
To identify the eclipse and storm signatures, the standard deviation at each station during the observation period, 15– 26 July 2009 is computed. It is found that the standard de-viation is about 2–3 TECu. Figure 3 shows that the eclipse signature can be detected, except those three low obscura-tion staobscura-tions, STK2 (43.5%), BJFS (74.1%), PIMO (49.8%) where the deviations are less than 2 standard deviations of 4–6 TECu. This might partially explain why MAGIC fails to reproduce the eclipse signature at STK2 (obscura-tion 43.5%). On the other hand, the storm signatures can be detected by all the 8 stations, because the deviations are greater than 2 standard deviations of 4–6 TECu. However, MAGIC still fails to reproduce the positive storm signature ofNmF2at STK2 and BJFS.
516 C.-Y. LINet al.: IRI, MAGIC, AND GPS OF ECLIPSE AND STORM 2009
518 C.-Y. LINet al.: IRI, MAGIC, AND GPS OF ECLIPSE AND STORM 2009
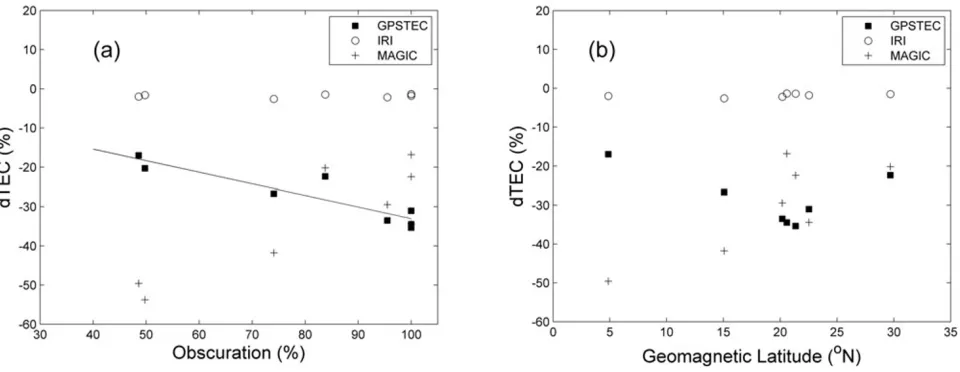
Fig. 6. The obscuration and latitudinal effects of the normalized TEC reduction during the solar eclipse period. The reduction has been normalized by its associated background value. (a) The obscuration and (b) geomagnetic latitude effects. The solid line denotes linear regression between the GPS TEC reduction and obscuration.
Fig. 7. The latitudinal distribution of the normalized TEC maximum and minimum during the storm period. (a) The normalized TEC maximum vs. the magnetic latitude during the positive storm phase, (b) the normalized TEC minimum vs. the magnetic latitude during the negative storm phase.
We further study the obscuration and latitudinal effects in the IRI TEC and MAGIC TEC as well as the observed TEC during the solar eclipse and the storm periods. Figures 6 and 7 display the normalized TEC reductions vs. the ob-scuration/magnetic latitude during the solar eclipse period, and the TEC maximum (minimum) vs. the magnetic lat-itude during the positive (negative) storm phase, respec-tively. It can be seen that no clear effects can be found in the IRI TEC, and the two effects in the MAGIC TECs are rather complex during the solar eclipse period (Fig. 6). By contrast, the correlation coefficient rate 0.85 shows that the extreme reduction of the observed TEC is proportional to the obscuration percentage (Fig. 6(a)), which suggests that the photochemical process is essential during the solar eclipse. On the other hand, the greatest value of the extreme reduction appears at 20◦N magnetic, where is 5–10 degrees north of the crest of the equatorial ionization anomaly (EIA) (Fig. 6(b)). This suggests theE×Bplasma fountain being disturbed during the eclipse period.
Figure 7 reveals that no clear latitudinal effect can be
found in the IRI TEC during the two storm phases, which agrees with the results in Figs. 2 and 3. It is found that the MAGIC model and the observation yield the greatest value of the TEC maximum (TEC minimum) at about 15◦N mag-netic, where is near the EIA crest, during the positive (neg-ative) storm phase. These suggest that the most prominent storm signatures occur in the EIA region.
The results show that MAGIC incorporating with IRI and ground-based GPS TEC observations could correctly re-produce the TEC (the TEC and NmF2) during the eclipse (storm) period. Therefore, ground-based TEC measure-ments might be worthwhile to be included in the IRI model to have better simulations on ionospheric solar eclipse and storm signatures.
520 C.-Y. LINet al.: IRI, MAGIC, AND GPS OF ECLIPSE AND STORM 2009
References
Afraimovich, E. L., K. S. Palamartchouk, N. P. Perevalova, and V. V. Chernukhov, Ionospheric effects of the solar eclipse of March 9, 1997, as deduced from GPS data,Geophys. Res. Lett.,25, 465–468, 1998. Araujo-Pradere, E. A. and T. J. Fuller-Rowell, STORM: An empirical
storm-time ionospheric correction model, 2, Validation,Radio Sci.,37, doi:10.1029/2002RS002620, 2002.
Araujo-Pradere, E. A., T. J. Fuller-Rowell, and M. V. Codrescu, STORM: An empirical storm-time ionospheric correction model, 1, Model de-scription,Radio Sci.,37, doi:10.1029/2001RS002467, 2002.
Araujo-Pradere, E. A., T. J. Fuller-Rowell, P. S. J. Spencer, and C. F. Minter, Differential validation of the US-TEC model,Radio Sci.,42, RS3016, doi:10.1029/2006RS003459, 2007.
Bilitza, D. and B. Reinisch, International Reference Ionosphere 2007: Improvements and new parameters,J. Adv. Space Res.,42, 599–609, doi:10.1016/j.asr.2007.07.048, 2008.
Buonsanto, M. J., Ionospheric storms—review,Space Sci. Rev.,88, 563– 601, 1999.
Espennak, F. and J. Anderson, Total Solar Eclipse of 2009 July 22, NASA/TP-2008-214169, 2008 (available on the website http://eclipse.gsfc.nasa.gov/SEpubs/20090722/rp.html).
Fejer, B. G. and L. Scherliess, Time dependent response of equatorial ionospheric electric fields to magnetosapheric disturbances,Geophys. Res. Lett.,22, 851, 1995.
Fesen, C. G., G. Growley, and R. G. Roble, Ionospheric effects at low latitudes during the March 22, 1979, geomagnetic storm,J. Geophys. Res.,94, 5405–5417, 1989.
Fuller-Rowell, T. J., M. V. Codrescu, R. G. Roble, and A. D. Richmond, How does the thermosphere and ionosphere react to a geomagnetic storm?, inMagnetic Storms, edited by B. T. Tsurutaniet al., pp. 203– 225, AGU Monograph 98, Washington, D.C., 1998.
Fuller-Rowell, T. J., G. H. Millward, A. D. Richmond, and M. V. Codrescu, Storm-time changes in the upper atmosphere at low latitudes,J. Atmos. Sol. Terr. Phys.,64, 1383, 2002.
Jakowski, N., S. Heise, A. Wehrenpfennig, S. Schl¨uter, and R. Reimer, GPS/GLONASS-based TEC measurements as a contributor for space weather forecast,J. Atmos. Sol. Terr. Phys.,64, 729–735, 2002. Kil, H., L. J. Paxton, X. Pi, M. R. Hairston, and Y. Zhang, Case study of
the 15 July 2000 magnetic storm effects on the ionosphere-driver of the positive ionospheric storm in the winter hemisphere,J. Geophys. Res., 108(A11), 1391, doi:10.1029/2002JA009782, 2003.
Le, H., L. Liu, X. Yue, and W. Wan, The ionospheric behavior in conjugate hemispheres during the 3 October 2005 solar eclipse,Ann. Geophys.,27, 179–184, 2009.
Leick, A.,GPS Satellite Surveying, 560 pp., John Wiley, New York, 1995. Lin, C. H., A. D. Richmond, R. A. Heelis, G. J. Bailey, G. Lu, J. Y. Liu, H. C. Yeh, and S.-Y. Su, Theoretical study of the low- and midlatitude ionospheric electron density enhancement during the October 2003 su-perstorm: Relative importance of the neutral wind and the electric field,
J. Geophys. Res.,110, A12312, doi:10.1029/2005JA011304, 2005. Lin, C. H., J. Y. Liu, H. F. Tsai, and C. Z. Cheng, Variations of the
equatorial ionization anomaly peaks in the west pacific region during the April 6 and July 15, 2000 geomagnetic storms,Earth Planets Space, 59(5), 401–405, 2007.
Liu, J. Y., H. F. Tsai, and T. K. Jung, Total electron content obtained by using the global positioning system,Terr. Atmos. Ocean. Sci.,7, 107– 117, 1996.
Liu, J. Y., H. F. Tsai, C. C. Wu, C. L. Tseng, L. C. Tsai, W. H. Tsai, K. Liou, and J. K. Chao, The effect of geomagnetic storm on ionospheric total electron content at equatorial anomaly region,Adv. Space Res.,24, 1491–1494, 1999.
Minter, C. F., D. S. Robertson, P. S. J. Spencer, A. R. Jacobsen, T. J. Fuller-Rowell, E. A. Araujo-Pradere, and R. W. Moses, A compari-son of MAGIC and FORTE ionospheric measurements,Radio Sci.,42, RS3026, doi:10.1029/2006RS003460, 2007.
Pr¨olss, G. W., Storm-induced changes in the thermospheric composition at middle latitudes,Planet. Space Sci.,35, 807–811, 1987.
Pr¨olss, G. W., Ionospheric F-region storms, inHandbook of Atmospheric Electrodynamics, edited by H. Volland, CRC Press, Boca Raton, Fla., 1995.
Sard´on, E., A. Rius, and N. Zarraoa, Estimation of the receiver differential biases and the ionospheric total electron content from Global Position-ing System observations,Radio Sci.,29, 577–586, 1994.
Sover, O. J. and J. L. Fanselow, Observation model and parameter partials for the JPL VLBI parameter estimation software MASTERFIT-1987,
Jet Propulsion Lab. Publ., 83–39, Rev.3, 1–60, 1987.
Tsai, H. F. and J. Y. Liu, Ionospheric total electron content response to solar eclipses,J. Geophys. Res.,104, 12657–12668, 1999.