U tility-Based Buffer M anagement and
Scheduling for Networks
Cedric A n gelo M ojica Festin
Thesis submitted to the University of London
for the degree of Doctor of Philosophy
Department of Computer Science
University College London
ProQuest Number: U643191
All rights reserved
INFORMATION TO ALL USERS
The quality of this reproduction is dependent upon the quality of the copy submitted.
In the unlikely event that the author did not send a complete manuscript and there are missing pages, these will be noted. Also, if material had to be removed,
a note will indicate the deletion.
uest.
ProQuest U643191
Published by ProQuest LLC(2016). Copyright of the Dissertation is held by the Author.
All rights reserved.
This work is protected against unauthorized copying under Title 17, United States Code. Microform Edition © ProQuest LLC.
ProQuest LLC
789 East Eisenhower Parkway P.O. Box 1346
A b stract
User satisfaction from a given network service or resource allocation can be viewed as having two aspects, a state and a degree. The state defines whether the user is happy or unhappy. A user is happy when its expectations are met. The degree defines the level of happiness or unhappiness.
In this dissertation, we study the use of perceived knowledge of the state and degree of user satisfaction in managing router resources and functions. We make this information available to the router and examine whether the additional knowledge improves local resource allocation decisions. We recognise th at users can have varying requirements, but our main objective is to satisfy all of their expectations fairly. We describe our formulation, Value-Based Utility (VBU), th a t incorporates both aspects of user satisfaction. PVom this we derive four further measures, which we then use to evaluate different resource management schemes.
We establish a framework of VBU use for trafiïc management schemes. In partic ular, we demonstrate the use of VBU for several buffer management and scheduling mechanisms where we show how they could be adapted to make use of this informa tion. We compare the performance of several existing buffer management schemes against th at of our proposed FIFO scheme th a t uses VBU to determine which packets to drop under a range of conditions. We also present a weighted round-robin server that uses VBU to make scheduling decisions and evaluate its success in making users happy.
A cknow ledgem ents
I am totally indebted to my supervisor Spren-Aksel Sprensen who with his guid
ance, patience and personal support encouraged me to persevere and complete this
work.
I am grateful to the Computer Science Department at UCL for the environment
th a t allowed me to participate in discussions and seminars th at benefited me through
out my stay. I would like to especially acknowledge Stephen Hailes and Jon Crowcroft
for their comments on earlier versions of this work.
This work was supported by the Department of Science and Technology of the
Philippines and the University of the Philippines. I would like to thank in particular
Dr. Estrella Alabastro, Mark Encamaciôn, Jimmy Caro, Teody Dayoan and June
Perena for all their help.
I would like to thank my friends from UCL, Cambridge and the Pinoy-UK for a
life outside studying.
I would hke to thank Marissa and Felipe for sharing their home during my studies
and for giving their support and understanding. To my first housemates Fe and Zaldy,
I thank them for making my move to London less daunting.
I am most especially grateful to Susan who has always been a source of inspiration.
I thank her for her motivation, support, patience and love.
Contents
1 M otivation 13
1.1 C o n te x t ... 13
1.1.1 Evolving Nature of Applications and Their Quality of Service R equirem ents... 15
1.1.2 Traffic Management and U tility ... 18
1.2 Thesis S ta te m e n t... 19
1.3 Research C o n trib u tio n ... 20
1.4 Organisation of the T h e s is ... 20
1.5 S u m m a r y ... 22
2 Value-Based U tility 24 2.1 Introduction... 24
2.2 Abstract Framework for Levels of S atisfaction... 26
2.3 General Form of the Utility F u n ctio n ... 27
2.3.1 Form ulation... 28
2.3.2 A n alysis... 30
2.3.3 Key Terms and D e fin itio n s ... 31
2.4 Maximum Number of Satisfied Users - An E xam ple... 34
2.4.1 Experimental M o d e l... 35
2.4.2 Discussion... 35
CO NTENTS 5
3 U tility in Traffic Management 39
3.1 O v e rv ie w ... 39
3.2 Introduction... 39
3.2.1 Telephone N etw ork... 40
3.2.2 I n t e r n e t... 41
3.2.3 Asynchronous Transfer M o d e ... 42
3.3 Using U tihty for T>affic M anagem ent... 43
3.3.1 Admission C o n tro l... 43
3.3.2 Packet C lassification... 44
3.3.3 Traffic Shaping and C onditioning... 44
3.3.4 Packet M arking... 46
3.3.5 Scheduling ... 47
3.3.6 Discard P o l i c y ... 49
3.4 S u m m a r y ... 51
4 Experimental Environment 52 4.1 O v e rv ie w ... 52
4.2 Measuring QoS and the Resulting V B U ... 52
4.2.1 P re lim in a rie s... 52
4.2.2 T h ro u g h p u t... 53
4.2.3 D e l a y ... 54
4.2.4 Jitter ... 55
4.2.5 L o s s ... 56
4.3 Simulation E n v iro n m en t... 57
4.3.1 Source M o d e l s ... 57
4.3.2 Expectation M ix e s ... 58
4.3.3 Single Node T o p o lo g y ... 58
4.3.4 Measurement P r o c e s s ... 60
4.3.5 Simulation N o te s ... 61
C O NTEN TS 6
4.4.1 Total Number of Satisfied Users and QoS U nhappiness... 62
4.4.2 Loss Unhappiness and Average Utility Per C l a s s ... 63
4.4.3 Utility F a irn e ss... 65
4.5 S u m m a r y ... 68
5 Loss M anagement Schemes 71 5.1 O v e r v ie w ... 71
5.2 A FIFO Scheme Using Buffer T h r e s h o ld s ... 71
5.2.1 B ackground... 71
5.2.2 Buffer Thresholds ... 72
5.2.3 Performance of G+98 Under Different Tuples . . . . 74
5.2.4 {(Th = (tm) a {(Jm >(^l) ... 75
5.2.5 (cth > ctm) a ((Jm = A (<jl = 0 ) ... 78
5.2.6 {(Jh > (Jm) a (cfm > (Jl) A (ctm > 0 ) ... 78
5.2.7 Best Performing G+98 Configuration ... 79
5.3 A FIFO Scheme Using Value-Based U t i l i t y ... 80
5.3.1 Proposed Schem e... 81
5.3.2 Performance of VBU Under Different Utility Thresholds . . . . 81
5.4 S u m m a r y ... 84
6 Loss Sensitivity 87 6.1 O v e r v ie w ... 87
6.2 Expectation M ix e s ... 87
6.3 G+98 W ith Different Expectation M ix es... 88
6.3.1 Loss Unhappiness ... 88
6.3.2 Average Utilities and Intra-Class F a irn e s s ... 89
6.4 VBU with Different Expectation M ixes... 90
6.4.1 Loss Unhappiness ... 91
6.4.2 Average Utility and Intra-Class F a irn e ss... 91
CO NTENTS 7
6.5.1 The Performance of G+98 and V B U ... 93
6.5.2 G+98 Scheme with VBU A d ju stm en ts... 95
6.5.3 G+98 Sharing Scheme and G+98-VBU Sharing Scheme . . . . 98
6.6 S u m m a r y ... 102
7 Delay Management Schemes 103 7.1 O v e rv ie w ... 103
7.2 Delay Scenarios... 103
7.3 Burst Conditions and Other P a ra m e te rs ... 104
7.3.1 Burst C o n d itio n s... 104
7.3.2 Expectation M ix e s ... 105
7.4 Performance of the FIFO S chem e... 105
7.4.1 Burst C o n d itio n s... 105
7.4.2 Delay Scenarios... 107
7.5 Deficit Round Robin and Three Class Priority Q u eu e... 108
7.5.1 Deficit Round R o b in ... 108
7.5.2 Three Class Priority Q u e u e ... 112
7.6 Variants of Three Class Priority Queue and Deficit Round Robin . . . 115
7.6.1 Three Class Priority Scheme with Per-Flow D R R ... 116
7.6.2 Active Use of Value-Based Utility to Schedule P a c k e ts ...119
7.7 S u m m a r y ... 126
8 Conclusions 129 8.1 O v e rv ie w ... 129
8.2 C onclusions... 129
8.3 Future Work ... 131
A CLOWN M odelling 133 A .l O v e rv ie w ... 133
A.2 CLOWN System A rchitecture... 133
CO NTEN TS 8
A.4 CLOWN Object M o d e llin g ... 136
A.4.I Source Transition D ia g r a m ... 136
A.4.2 CLOWN Class D eclarations... 139
A.4.3 Creating and Registering Class M o d u les... 140
A.4.4 Initialising Object State V a ria b le s ... 142
A.4.5 Creating a Class Startup F u n c tio n ... 142
A.4.6 Creating an Instance of a C la s s ... 143
A.4.7 Creating Class Interfaces ... 143
A.4.8 APPLICATION and GENERATOR In terface... 145
A.4.9 Event H andling... 145
A.4.10 Message P a s s i n g ... 147
A.4.11 Queue M a n a g e m e n t... 147
List o f Figures
1.1 Organisational View of this D isse rta tio n ... 21
2.1 Utility L e v e ls ... 27
2.2 Utility P o i n t s ... 31
2.3 Utility of Service B u n d le s ... 32
2.4 Sensitivity of Utility to p ... 34
2.5 Channel Utilisation and Vg vs Number of Voice C a lls ... 36
2.6 Vd vs Number of Voice C alls... 37
2.7 Vd and Vj with Différent Target B o u n d s ... 38
3.1 Leaky-Bucket Parameter A d ju s tm e n ts ... 45
3.2 Priority Queue R eclassification... 48
3.3 Round-Robin Weight Reassignm ent... 49
4.1 Important Timings in a Black-Box M o d e l... 53
4.2 Measurement W in d o w ... 61
4.3 Loss Unhappiness ( W G ) ... 63
4.4 FIFO Loss U n h a p p in ess... 64
4.5 FIFO Average Loss U tility ... 66
4.6 FIFO Class F a ir n e s s ... 69
5.1 G4-98 Packet Dropping A lg o rith m ... 73
5.2 Experimental Design Tree for G + 9 8 ... 75
5.3 G+98 Loss Unhappiness : {(Th = (%M > c r i )... 76
L IS T OF FIGURES 10
5.4 G+98 HEFS Performance : (an = (^m) A (cm '> <^l) ... 77
5.5 G+98 Loss Unhappiness : (an > c t m) A ( c t m — c t l) A ( c t l = 0 ) ... 79
5.6 G+98 HEFS Average Loss Utility and Intra-Class Fairness: (an > c t m) a ( c t m = c t l) a ( c t l = 0 ) ... 80
5.7 G+98 Overall Loss Unhappiness : (an > c t m) A ( c t m > c t l) A ( g m > 0) 80 5.8 VBU Packet Dropping A lg o rith m ... 82
5.9 VBU HEFS Loss Unhappiness and Average Loss U t i l i t y ... 83
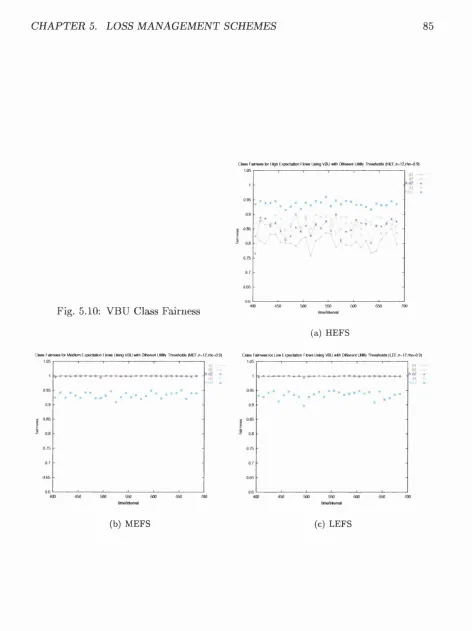
5.10 VBU Class Fairness ... 85
6.1 G+98 HEFS Loss Unhappiness for Two Different Expectation M ixes.. 88
6.2 G+98 HEFS Average Utilities and Intra-Class Fairness for Two Differ ent Expectation Mixes... 89
6.3 VBU HEFS Loss Unhappiness for Two Different Expectation Mixes. . 90
6.4 VBU HEFS Average Utilities and Intra-Class Fairness for Two Different Expectation Mixes... 92
6.5 Loss Unhappiness of the G+98 and VBU Schemes... 94
6.6 Loss Unhappiness of G+98-VBU Scheme... 96
6.7 G+98-VBU Scheme ... 97
6.8 G+98-Sharing Packet Dropping Algorithm... 99
6.9 Loss Unhappiness of G+98-Sharing and G+98-VBU Sharing Schemes 100 6.10 Loss Unhappiness of G+98-Sharing and G+98-VBU Sharing Schemes 101 7.1 FIFO Delay Unhappiness Under Baseline Burst C o n d itio n s ... 106
7.2 FIFO Delay Unhappiness Under Different Delay S cenarios...108
7.3 DRR Delay Unhappiness Under Baseline Burst C onditions...110
7.4 DRR Delay Unhappiness Under Different Delay S c e n a rio s...I l l 7.5 3CPQ Delay Unhappiness Under Baseline Burst C o n d itio n s...113
7.6 3CPQ Delay Unhappiness Under Different Delay Scenarios ... 114
7.7 3CPQ-DRR Delay Unhappiness Under Baseline Burst Conditions . . . 117
L IS T OF FIGURES 11
7.9 3QV-DRR Delay Unhappiness Under Different Delay Scenarios . . . . 120
7.10 3QV-DRR Throughput ... 122
7.11 3QV-DRR Class Quanta Under Different Delay S c e n a rio s ...122
7.12 3QV-DRR with Retrieval Under Different Delay Scenarios...124
7.13 Delay Unhappiness of AU S c h e m e s ... 125
A .l CLOWN System A rchitecture... 134
A.2 CLOWN M o d el... 135
A.3 Exchanged Message Between C la sse s... 136
A.4 State Transition Diagram : S o u r c e ... 137
A.5 Detailed State Transition Diagram : S o u r c e ... 138
A.6 Application Class D eclaration... 139
A.7 Registering C la sses... 140
A.8 Registering APPLICATION M o d u le ... 141
A.9 Initialising Object State Variables ... 142
A. 10 Creating a Startup F unction... 143
A. 11 Creating Class Interfaces... 144
A. 12 Events Between APPLICATION and GENERATOR C l a s s e s 144 A. 13 Event H a n d lin g ...146
List o f Tables
2.1 64 Kbps Source Models with Different Frame Sizes and R a t e s 36
4.1 Traffic T y p e s ... 57
4.2 Traffic Characteristic and Expectation M i x e s ... 59
Chapter 1
M otivation
1.1
C on text
The last decade has seen the unprecedented growth of the Internet in terms of the
number of hosts connected and the number of people using it. This has been brought
about by the Internet’s ability to scale well while stiU remaining flexible. Millions of
people currently use the Internet for education, business, entertainment, and commu
nication. More users are projected in the next few years. It is not difficult to see
th at user demands on the network will eventually out-pace the improvements in the
capacity and size of transmission facflities. This growth, coupled with the emergence
of multimedia applications carrying video and audio streams, has placed a tremendous
strain on the existing Internet service model.
In the late 1960’s [53, 82], the ARPANET, the precursor of the Internet, was
conceived to provide a robust means of communication in the event of war. It was
also used as a research and academic network where computing resources were shared
through remote sessions. In addition, it allowed the exchange of research d ata using
file transfer programs and communication through electronic mail. These applications
required data to be transm itted reliably across sites th at used diflerent network tech
nologies. The problem was solved through the introduction of the Internet Protocol
(IP) suite which allowed heterogenous networks to be interconnected. However, this
C H APTER 1. M OTIVATIO N 14
service is on a best-effort basis. Packets carrying d ata are treated equally and trans
ported when network resources are available without guarantees against delay and
loss. The two main transport protocols in the Internet are the connection-oriented
Transmission Control Protocol (TCP) and the User Datagram Protocol (UDP) which
provides a connectionless service. TC P was developed to provide rehable, inorder and
end-to-end transport of data across the unreliable link level service provided by IP. In
contrast, UDP does not have an error recovery mechanism and is commonly used for
applications th at can tolerate loss or have recovery facilities in the upper layers. This
separation of functionality through layering embodies the basic design principle of the
Internet - th a t is the network should just route while the responsibility of control is
left to the end systems.
The philosophy of decentralised control has made the Internet flexible allowing
networks and hosts to interconnect easily. This scaling property, the deployment of
LANs [53] and the development of the World Wide Web (WWW) in 1990’s [7, 6, 82]
provided the impetus for the dramatic growth of the Internet. The WWW gave its
user an easy-to-use interface to access the information on the Internet. W ith the
commercialisation of the Internet, information content flourished, new and better ap
plications were developed and the Internet continued to expand. In spite of these
innovations, the current Internet is essentially a network for communication and in
formation exchange. The main diSerence from the Internet of the 1970’s and even up
to the late 1980’s, is th at it is now increasingly used to transport data with diflerent
tra&c characteristics.
Today the Internet is challenged to support a wide spectrum of apphcations ranging
from traditional data applications like electronic mail to real-time applications such as
audio and video conferencing. Real-time applications are described by their Quality of
Service (QoS) requirements often expressed in terms of high bandwidth and low delay.
The Internet, because of its decentralised control and best-eflort service, is unable to
guarantee such QoS requirements. Although live audio and video conferences have
C H APTER 1. M O TIVATIO N 15
common. This is due to the difficulty of sustaining the desired level of service especially
in periods of high demand [18].
1.1.1 E volvin g N a tu re o f A p p lica tio n s and T h eir Q u ality o f S ervice
R eq u irem en ts
Improved transmission facilities and the development of more sophisticated protocols
have greatly reduced the eflFects of the traditional problems associated with early
data networks. D ata apphcations now have rehable facihties to manage data loss,
ordering, duplication and other data anomahes [74]. As a result of these technical
innovations, new apphcations with multimedia streams and real-time requirements
are fast emerging.
These ‘new’ apphcations can be categorised in many ways. One early classffication
was given in [41, 80] where apphcations were categorised as providing either interac
tive or distribution services. The interactive services were further classified into three
categories namely: conversational, messaging and retrieval. Conversational services
are characterised by the interaction of two or more users in real-time. Current ap
phcations falling in this service category include audio and video conferencing [24],
IP telephony [64], interactive network games [22] and other cohaborative [65] and
computer-supported co-operative work [36] apphcations. The messaging and retrieval
services are complementary services where the interaction is not time-constrained un
like conversational services. Messaging services update information in a data store
while the retrieval services extract information from the data store. The reason these
two services were diflFerentiated in [41, 80] is th a t messaging only involves movement
of information in one direction (firom source to data store) while retrieval services also
involve an initial query before actual transfer firom data store to the receiver com
mences (to and from data store). Apphcations hke sending and receiving multimedia
e-mail and the update and retrieval of media databases are representative of these
services. Distribution services as defined in [41, 80] involve the transmission of infor
C H APTER 1. M O TIVATIO N 16
as broadcast-like where the receiver may or may not have presentation controls like
pause, fast forward, rewind or even slow motion features. A video-on-demand service
[62, 50] is a typical example of a distribution service.
Applications can also be categorised according to how they are used [63]. The
grouping can be based on: 1) their use as a communication tool; 2) the need to get
information and entertainment; or 3) the need to access computing resources and
facilities. StiU another distinction can be based on whether applications are point-
to-point or multi-point. Many of these classification schemes are overlapping. For
example, video-conferencing is both conversational and point-to-point. If there are
more than two users, video-conferencing is multi-point and depending on its use,
could be either be for communication, information or even both.
Regardless of how these wide ranging applications are categorised, it is clear th a t
their development and deployment impose different Quality of Service (QoS) con
straints on the underlying service infrastructure, devices, protocols and resources.
Although in this thesis we shall concentrate on network QoS, it is by no means the
only issue. The provisioning for QoS is an end-to-end issue [40, 57, 58, 77, 5] th at
involves among others the user, application, operating system, end-system hardware,
as weU as the network and transport protocols. Architectural frameworks relating
different elements of the end-to-end communication such as QoS definitions, trans
lations and specifications are explored in some detail in [40, 57, 58, 77, 46, 59, 5].
The main point we derive from these works on QoS architectural frameworks is th a t
the establishment of network performance targets is coordinated with other entities
in the end-to-end path. This aUows for some level of functional abstraction and the
establishment of specific network performance objectives. W hatever scheme is used
to achieve the targets wUl be in conjunction with the overall framework. This means
th at the success of QoS provisioning can be viewed a t two levels, end-to-end and the
network level. We wUl mainly deal with the latter.
Keshav [48] defines QoS as “network quahty to satisfy user needs, however the
CH APTER L M O TIVATIO N 17
requirements on the collective behaviour of one or more objects.” These definitions
are just a sample of how QoS is defined but whatever definition is used, two aspects
or views are common to all. The first one is the network view while the other relates
to user perception.
Generally, the network views QoS as measurable performance targets [26, 27, 75,
52] th at characterise real-time and multimedia applications. These performance tar
gets are often expressed as bandwidth, delay, loss and jitte r requirements. Bandwidth
requirements of multimedia apphcations are determined by several factors, e.g., the
apphcation type, the subject of the apphcation, the encoding and compression scheme
used, and the firame rate and size. This results in a wide range of bandwidth demands.
For example, typical ranges for low bit audio communication are from as low as 2.4
kbps and up to 64 kbps [19]. The requirement for compressed digital video is around
5-10 Mbps while the data rate transm itting digital video uncompressed is higher at
170 Mbps [47].
The delay requirement is important, especially when apphcations are interactive
and in real-time. Packets of real-time fiows arriving late are useless and simply waste
bandwidth. In addition to having bounds on delay, it is equaUy important th at the jit
ter of packets is minimised to enhance the understanding of communication. Excessive
packet loss on the other hand seriously degrades interaction especiahy if multimedia
traffic is compressed or layered. Whatever values are set for these requirements, be
it 150 to 400 ms for one-way delay [47, 50] or 10% packet loss [49], these are often
influenced by user perception of quahty.
The user view of QoS is very subjective because it is dependent on how weU the user
can understand the information content from using the apphcation [33]. In addition,
perception differs from one user to another [73] which makes it more difficult to define
quahty. There are several techniques for assessing quahty [16, 9]. Current approaches
normaUy involve asking a group of users to rate and evaluate multimedia presentations
based on some aspect of perceptual quahty [2, 33, 16] while some media distortion is
C H APTER 1. M O TIVATIO N 18
additional users by degrading the quality of the streams received by the current users.
In [33], the effects of varying the frame rate of video streams on perceptual quahty
were investigated, while others [16, 73] have looked at inducing loss and jitte r in audio
and video streams. Although the mapping of distortion to user perception is still
evolving, we can use the fact th at in certain conditions, users can tolerate some level
of service deterioration. This knowledge of user tolerance can be used in the pohcies
and schemes implemented inside the network.
1.1.2 Traffic M an agem en t and U tility
The provisioning for network QoS to satisfy user requirements is not just one scheme
or pohcy. Rather it is an aggregation of mechanisms and pohcies. Cohectively, the
set of mechanisms and pohcies employed by the network to attain a level of service
given resource constraints is cahed Traffic Management Some of the key mechanisms
employed by networks are: admission control, traflB.c shaping, packet classification,
packet m ark in g , scheduling, queue management and congestion control. Different
levels of service differentiation can be achieved depending on the pohcies used by these
mechanisms. The pohcies determine how packets will be treated by the mechanisms,
e.g., which packet to drop or which packet is to be served first.
In this thesis we adopt a pohcy based on utihty. However, the way we define
and use utihty is slightly different from its normal usage. Utihty is mainly used
to express user preferences for choices. These preferences have often been linked to
pricing [17, 20, 55, 67, 66]. This means they have assumed th a t if you prefer A over
B, you are willing to pay more for A than for B. We do not assume this link between
preference and pricing. We use utihty to express a preference for A but this preference
is not necessarily linked to the willingness and capabihty to pay for A. The preference
we deal with is solely based on need.
The pohcy we employ inside the network is therefore determined by the way we
define and use utihty. In general, we use a pohcy where resources are shared between
C H APTER L M OTIVATIO N 19
with the network QoS they receive, it maybe possible to degrade the service they are
getting to help others.
1.2
T hesis S tatem en t
User satisfaction from a given network service or resource allocation can be viewed
as having two aspects, a state and a degree. The state describes whether the user is
happy or unhappy. A user is happy when its expectation or minimum requirements
are met, otherwise it is unhappy. The second aspect, the degree, describes how happy
or unhappy the user is.
This dissertation aims to study the use of perceived knowledge of the state and
degree of satisfaction of users in the management of router resources and functions.
The basic idea is th at if a router has this information locally, then this router can
possibly make better resource management and control decisions to meet its users’
expectations. There is httle work investigating the use of the state and degree of user
satisfaction in this manner. Most of the work done so far has been limited to using
one aspect of user satisfaction or the other.
Numerous control algorithms and policies have been designed offering a range of
service and resource allocation capabilities. Most of these schemes operate with the
goal of achieving the performance requirements of network users. Under this objective,
success is only measured in terms of whether users are happy or not. How well these
schemes accomplish their goal is secondary or even unimportant. There is a danger
th at in some situations such as high demand, services and resources are not effectively
distributed.
Previous work th at uses the degree of satisfaction in management primarily re
volves around economic indices such as utility. These works often use utility as pent
of an optimisation objective such as the maximisation of overall utility and/or the
minimisation of network cost. In this context, it is often assumed th a t with better
service or increased allocation, utility increases. The problem with this view is that
C H APTER 1. M O TIVATIO N 20
We believe th at the marriage of the state and degree of satisfaction could poten
tially provide useful information for traffic management. In particular, we aim to find
out if it is possible for a router using a local view of this information to efiectively
distribute router resources and services so th at user expectations can be achieved.
1.3
R esearch C ontribution
The main contributions of our work are as follows:
• We ofier a different perspective in specifying user expectation th a t redefines the
definition and analysis of acceptable performance. The use of our notion of
user satisfaction in management allows for the effective distribution of resources
especially in times of high demand and low resource availability.
• We model user satisfaction as a utility function which provides a measurable
index of performance.
• We apply our formulation in traffic management and examine schemes such as
admission control, packet classification and marking, traffic shaping, schedul
ing and packet discard in general terms and establish a framework where our
formulation can be used.
• In particular, we show how our formulation can naturally offer service differenti
ation and provide improved performance in terms of user happiness. We provide
specific examples of our formulation’s use for managing loss and delay and show
the improved performance achieved by the proposed schemes.
1.4
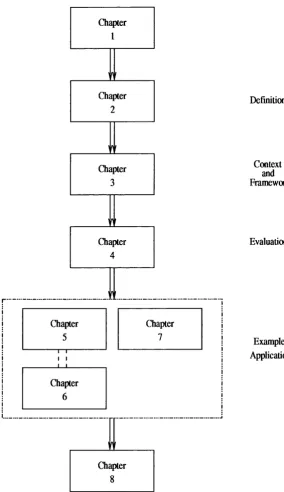
O rganisation o f th e T hesis
Our work is composed of four main areas. The areas and their relationship with each
other are shown in Figure 1.1.
The first area deals with our definition of satisfaction. Here we motivate the need
C H APTER 1. M O TIVATIO N 21
Chapter 1
i f i r
Chapter
2
ifif
Chapter
3
ifif
Chapter
4
inf
Definition
Context and Framework
Evaluation
C h ^ e r Chapter
5 7
I
ExampleApplications
C H APTER 1. M O TIVATIO N 22
properties. We define our formulation, Value-Based Utility (VBU), th at incorporates
both components of satisfaction. This work is covered in chapter two.
The second part establishes the context where VBU may be appfied for traffic
management. We outline features of router functions and mechanisms and develop a
framework on how VBU may be used for management in chapter three.
The third part concentrates on presenting the evaluation process. We describe
how we derive four additional measures firom the computed utihty. These additional
measures are later used to evaluate the performance of management schemes and
mechanisms. This work is carried out in chapter four.
The fourth area consists of the specific use of VBU either in tuning of operating
parameters or as part of algorithms and pohcies. We specificahy look at traffic man
agement schemes that affect loss and delay. These examples are encapsulated by the
work in chapters five and six for loss and seven for delay.
1.5
Sum m ary
The second chapter introduces Value-Based Utihty (VBU), our model of the state and
degree of satisfaction. We begin by developing a linear utihty function based on user
performance requirements. We also define key terms and properties. We consider a
simple example to highlight how VBU may be used to find near optimal operating
conditions th a t would result in the highest number of satisfied users of the Ethernet.
The third chapter examines in abstract terms how VBU can be used to manage
and control router resources and functions. We outline different mechanisms employed
by a router and describe in general terms how they may be used along with VBU to
offer service differentiation based on utihty.
The fourth chapter defines the measures based on utihty th at wih be used in the
succeeding chapters. We begin by deriving the^VBU given the Quahty of Service
(QoS). From this expression of satisfaction, we tj^ n adopt a management objective
based on maximising the number of happy u s ^ s but constrained by a variant of Jain et
CH APTER 1. M O TIVATIO N 23
Class Average Utilities and Utility Fairness to express this objective. As an example,
we analyse the performance of a FIFO queue using these measures.
The fifth and sixth chapters contain a series of experiments th a t show the effects of
using VBU in specific loss policies and algorithms. First, we evaluate the performance
of Guerin et al.’s threshold-based scheme (G+98) [37] in terms of meeting user ex
pectations and fairness. We show how, by adjusting the operating parameters of this
scheme, different levels of performance can be achieved which provides for interesting
tradeoffs and scenarios. We then develop VBU-aware schemes for FIFO and G+98
which improves on the performance of the base scheme.
Our seventh chapter looks at the issue of delay. We apply the same approach
here as we did in chapter six. We first analyse the behaviour of three schemes in
terms of our objectives and measures. We look at the delay utility characteristics of
FIFO, Three Class Priority Queue (3CPQ) and the Deficit Round-Robin (DRR) [70].
We then incorporate VBU into both the 3CPQ and DRR resulting in two variants
that have a wide range of performance capabilities. We conclude by highlighting the
important observations and results.
Chapter eight provides an overview of our main conclusions. We also discuss
Chapter 2
Value-Based U tility
2.1
Introduction
In terms of happiness with a given service, users^ of a multiservice network can be
in one of two states. They could either be happy or unhappy. When resources are
low and demand for them is great, it is difficult to make every user happy but it is
not impossible. Resources from satisfied users may be transferred to the dissatisfied
users to try to make them less unhappy or even happy. This is possible because ap
phcations impose variable demands. Some apphcations may have high expectations
of the service they need while others do not. This expectation is an indicator of
how an apphcation perceives a performance target or requirement. For an apphca
tion who has expectations to be satisfied, the network must provide a service equal
to its requirements. Any excess can only make it happier while failure to meet such
requirements results in dissatisfaction. This notion of the degree (how much more or
less) of satisfaction an apphcation derives from a service has often been overlooked.
This is because service concerns focus more on meeting quantitative demands than
on qualitative attributes hke satisfaction. This chapter develops a formulation cahed
Value-Based Utility (VBU) to quantify both the state and degree of satisfaction. The
formulation is simple and its construction is fairly straightforward. Value-Based Util-
^Note that we use application and user interchangeably unless otherwise specified.
C H APTER 2. VALUE-BASED U T IL IT Y 25
ity uses the QoS requirements to define a utility function th at associates a utility
value with the service received by (or promised to) an application. Given this value,
we can then characterise the application’s state and degree of satisfaction with any
given service.
We contrast our notion of utility with economic utility where utility functions are
used to order resource or service bundles. In economics, the significance of the utility’s
value lies only in its inherent ability to rank preferences and choices. For example,
consider a voice application with a utility function Î7, and two service bundles A and
B with the following performance characteristics:
• A :<1000 ms delay @ 97% of the time, 20% loss, 32Kbps>
• B :<1000 ms delay @ 90% of the time, 20% loss, 16Kbps>
Economic utility states th at the voice application prefers >1 to 5 if the application of
U to A yields a higher value than the apphcation of U to B; i.e., U{A) > U{B). The
problem with this proposition is th at it does not teU us anything about the degree of
satisfaction of the application. A may be a better service than B but the application
may not be happy a t all with a delay of 1000 ms. Similarly, A may be better than
B but B may already be suflftcient for the application. This would allow A to be
allocated to some other user who needs it more.
For emerging network applications with strict QoS requirements, the use of utility
functions to simply order and rank services is inadequate. It is incapable of capturing
and modelling expectations of user requirements. In situations like these, it is more ap
propriate to use utility to represent user well-being. Information such as Value-Based
Utility could be useful in managing resources, especially in resource-challenged envi
ronments or utilisation-conscious systems, because it identifies users who can possibly
C H APTER 2. VALUE-BASED U T H IT Y 26
2.2
A b stract Framework for Levels o f S atisfaction
Quality of Service (QoS) requirements are often expressed as either a deterministic or
a statistical bound [26, 27]. An example of a deterministic requirement is when the
voice application in Section 2.1 requires th a t all packets should not be delayed by more
than 1000 ms. Given the service choices A and S , neither would have been capable
of delivering the desired service. A statistical bound is generally less restrictive. It is
similar to a deterministic bound except th a t it has one additional parameter p, where
p is the percentage of packets required to meet the bound. In a deterministic bound,
this p is implied to be equal to one. For our voice example, instead of requiring all
packets to meet the target, suppose we require that p = 0.95. This condition would
result in service bundle A meeting the target while B still fails to meet expectations.
Note th a t in both deterministic and statistical QoS representations, the service either
succeeds in meeting the requirements or it does not. Unfortunately, questions like
“How bad was the service for the deteiministic case?” or “How good was the service
for the statistical case?” cannot be answered.
To answer this, we first define the user expectation range to be some value between
h a p p in e s s m in and h a p p in e ssm a x - These two points represent the level of user satis
faction given th at the received or promised service is a t least equal to the minimiun
requirements. A utility function which we formally define in Section 2.3, maps a
user’s received service to some value hopefully within the expected range. Whenever a
user’s utility Ui = h a p p in e ssm o x then we say that the user has received the best pos
sible service. If Ui — h a p p in esS m in then the user’s requirements have been minimally
met. The worst that a user can be within this range is to be in a state of happi
ness. From a management perspective, it would be sufficient to operate the system
at slightly above h a p p in e s s m in levels especially in times of high resource demands.
There are no benefits for the network to expend resources th a t will not improve a
user’s state. This is because the user’s expectation has already been achieved and the
user is already happy. From the network’s perspective, the users are indifierent to
C H APTER 2. VALUE-BASED U TH .ITY 27
expectation
Utility
dissatisfaction
happiness
hîçpiness
^ unhappiness
Fig. 2.1: The expectation range is delimited by the points h a p p in esS m a x and
h a p p in e s s m in while the region of dissatisfaction is defined between the h a p p in e s s m in
and u n h a p p in e s s m o x values.
In cases where some services fail to meet user expectations, applications will be
come unhappy. Similarly, as with satisfaction, there are varying degrees of unhap
piness. We represent unhappiness and its levels as a range called the dissatisfaction
levels. This area lies just below the h a p p in e s s m in value and is delimited by the point
called u n h a p p in e s s m a x - Notice th at h a p p in e s s m in is a threshold value because it is
where the state of utility changes (fi’om satisfaction to dissatisfaction or vice-versa).
Service th a t is evaluated below this value can only make a user dissatisfied. If a user
flow’s utihty Ui = u n h a p p in e s s max ^ then the user is unhappy and is the recipient of
the worst possible service. Both of these areas are illustrated in Figure 2.1. Note th a t
the expectation range is equivalent to satisfaction levels. This is because a user is not
expecting to be unhappy.
2.3
G eneral Form o f th e U tility Function
In this section, we formally define Value-Based Utility and develop the function to
express satisfaction. We also highlight the im portant characteristics of the utility
C H APTER 2. VALUE-BASED U T IL IT Y 28
2 .3 .1 F o r m u la tio n
Let us assume th a t some percentage p from a flow of packets belonging to application
i must meet some QoS target bound 6 in an interval A t. To find a utility function U,
we first define the user expectation range to be in [0,1]. This range gives us the two
points happinessmax = 1 and happinessmin = 0- We shall later see th at the definition
of unhappinessjnax is dependent on these two points and is a function of p. We next
partition aU packets N transmitted in a time interval A t into two sets; one set S that
meets the requirements and another set Q th at does not. We can then associate the
following probabilities P {S) = ^ and P(Q) — to these sets, where G is equal to
the number of packets meeting the bound. The value P (S ) — P{Q) can be considered
as the relative bias of a service either towards meeting targets when positive or to
not meeting them when it is negative. However, this relation does not characterise
how well performance has met expectation (p, 6). We accomplish this by multiplying
a factor a, which should be a function of p, to P{Q) and then subtracting it from
P{S). Intuitively, we associate some benefit with P {S) while P{Q) * a is the rate of
how fast the benefit from P {S) diminishes. Given the two points of happinessmax and
happiness mini we find a suitable expression for a is given by We can also think of
this ratio as the penalty factor for not meeting expectation p. Thus, P {S) — P(Q ) * a
gives us a utility function U for describing both user satisfaction and dissatisfaction
within any specified time interval A t.
D e fin itio n 1 Value-Based Utility is an expression of user well-being. It uses a utility function to represent both the state and degree of user satisfaction (dissatisfaction).
The expression for the Value-Based Utility function is given by:
Ui,QoS,m,At(P'>^) ~ jg- N * q
where
Ui,QoS,m,At Sow i ’s utility for the specified QoS at point m during
C H APTER 2. VALUE-BASED U T IL IT Y 29
p is the target percentage of packets th a t should meet Q oS requirement,
b is the target QoS bound,
G is the number of packets meeting flow i ’s requirements,
N is the total number of packets seen, and
q is equal to 1 — p.
There are two problems when equation 2.1 is used to model utilities of deterministic
requirements. In the first case, | has no numerical meaning because q = 0. To avoid
this we use the limit of a as p approaches one. This results in an expression for
a = linip_>.i 2 = (X). W hat this says is th a t when q becomes very small, a becomes
very big and hence the penalty becomes larger. However, for operational purposes, q
should not be allowed to become very small (except for zero). If no bound on g is set,
managing resources would become impossible as the number of levels would infinitely
increase. To avoid this, the number of diflerent g’s must be limited and the smallest
of these values’ passing point m must be known. Selecting a suitable a when g = 0
can then easily be obtained as long as it is bigger than the a of the known smallest
g. To illustrate this, suppose point m allows the smallest g (largest p) to be equal to
0.01 (p = 0.99). The a of the smallest g is equal to 99 and therefore an a value of
Oiamaiiestq + step where step > 0 can be used when g = 0. To avoid confusion we shall
use a instead of a when dealing with deterministic requirements.
The other problem occurs when G = N . When this happens utility equals
happinessmax- The utility, although it correctly models the state, does not repre
sent the degree accurately. Since the expectation is p = 1.0, G = N should be the
minimum service to make the user happy. Therefore the resulting utility U must
only be equal to happinessmin- To model this accurately, we modify ^ of
equation 2.1 to when G = N . Combining these two special cases gives us the
definition of the utflity function for the deterministic case:
C H APTER 2. VALUE-BASED U T IL IT Y 30
than happinessmin ' The expression for a deterministic Value-Based Utility function is defined as:
j y Q ^
Ui^QoS,m,AtO-i h) = * Oi (2-2)
where
a is some value greater than the a of the known smallest q at point m,
the others are defined as before.
2 .3 .2 A n a ly sis
To verify th a t Equation 2.1 represents the state of user well-being, we consider the
best, the minimal, and worst possible service. A s im ilar analysis can also be used for
the deterministic case (Equation 2.2). The best possible service occurs when G = N ,
which means that all the packets were serviced according to expectation (p, 6). We
see th at the second term disappears and the equation simply evaluates to one or
h a p p in esS m o x - The second term also becomes zero when there is no expectation
(p = 0 and a don’t care bound b). In this case utility will always be greater or equal
to happ%nesSfjiin‘
When the requirement is exactly achieved, th a t is ^ = p, utility is equal to zero or
h a p p in e s s m in - An apphcation wiU be satisfied if the utihty from the service is above or
equal to this level. A service th at performs less than the expectation whl have a utihty
value less than h appin essm in ^ which is a negative utihty U. The range of unhappiness
begins at a point below the h a p p in e s s m in level and is bounded by u n h a p p in e sS m o x
-We find the expression u n h a p p in e s s m o x is equal to —^ (see Figure 2.2). This occurs
when service to ah packets fail to meet objectives (G = 0). Note ihaX u n h a p p in e sS m a x
is not assigned a fixed point because of its dependence on user expectation p. It is also
interesting to see th a t u n h a p p in e s s m o x = —ol- This should not be surprising since
a is the total penalty with the negative sign indicating dissatisfaction. We note th at
for the deterministic case, the best service G = N \s just equivalent to the required
C H APTER 2. VALUE-BASED U T H IT Y 31
Uti ity
expectation
dissatisfaction
happiness = 1
happiness = 0
A
unhappiness^^= -p/q
Fig. 2.2: The h a p p in e s s m a n h a p p in esS m in and u n h a p p in e sS m a x are assigned the values 1, 0 and -p /q respectively.
2.3 .3 K ey Term s and D efin itio n s
FVom the analysis of section 2.3.2 we can infer from utility the success or failure of
the service in meeting requirements. More importantly, from utility we can deduce
the level of user satisfaction (dissatisfaction). This allows us to determine how far
above or below users are from the happiness threshold, a measure th at can be used
for management. We now summarise some of the key terms and definitions we used
in the previous sections for future reference. These are given below
Definition 3 State o f Satisfaction. A user can either he in a State of Happiness or in a State of Unhappiness depending on whether utility is negative or not.
Definition 4 State o f Happiness. A user is in a state of happiness or simply happy if utility is either positive or zero (U > 0 ). This implies user expectations were achieved.
Definition 5 State o f Unhappiness. A user is in a state of unhappiness or simply unhappy if utility is less than zero (U <Q). This implies user expectations were not achieved.
C H APTER 2. VALUE-BASED U T H IT Y 32
Utility
rrMX
min
p—0.95 o p = 1 .0 0 ---10
-12
0.9 0.92 0.94 0.96 0.98 1
G/N
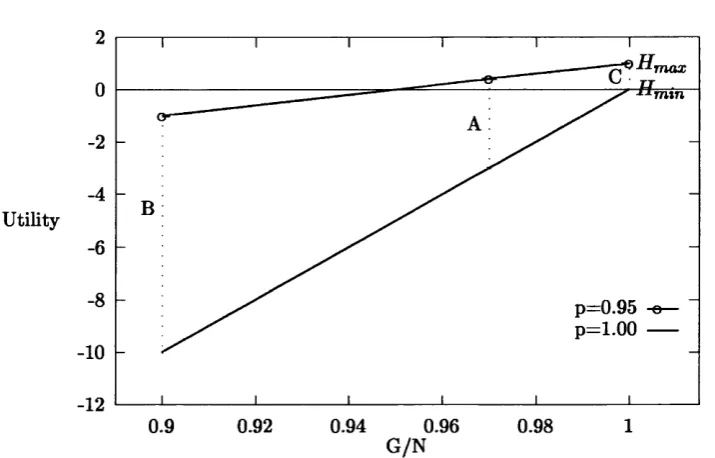
Fig. 2.3: Utility of service bundles A^ B and C for both statistical and deterministic requirements.
D efin itio n 7 M a x im u m H a p p in ess. Happinessmox (Hmax) equal to one and occurs when G=N for 0 < p < 1. It does not exist for p=1.0.
D e fin itio n 8 M in im u m H a p p in ess. Happinessmin (Hmin) is equal to zero and occurs when G/N=p for 0 < p < 1 and G=N fo r p=1.0.
D e fin itio n 9 M ax im u m U n h a p p in e ss. Unhappinessmox —p / q when 0 < p < 1. It does not exist for p=0.
(UHjnox) is equal to
As an example, consider the state of satisfaction of the voice apphcation in Sec
tion 2.1 with the service bundles A and B and another service C:
• C :<1000 ms @ 100% of the time, -, >
Using p = 0.95 and applying Equation 2.1 on the delay parameter of each service
offering, we get U{A) = 0.4, U (B) = —1.0 and U{C) = 1.0. Definition 4 tehs us that
service bundles A and C whl provide a successful service because their uthities are non
negative whhe service bundle B whl fah to meet expectations. Since U{C) = 1.0, this
C H APTER 2. VALUE-BASED U T IL IT Y 33
Let us now assume th at we have a deterministic requirement (p = 1.0). Using
Equation 2.2 with a = 100 results in the following utilities: U{A) = — 3, U{B) = —10
and U{C) = 0. In this example the voice application can only be happy if all of its
packets receive the expected service. This means that only service bundle C could
satisfy the application. The best possible service (100%) results in minimum happi
ness (Definition 8). The example utilities for both the statistical and deterministic
requirements are shown in Figure 2.3. Observe th at the two curves in this figure trace
the possible values of U for different ^ ’s.
Until now, we have only considered utility at the three reference values (0, 1 and
—p/q). The values in between these points are equally important for signalling the
level of weU being. Hence, there is a need to characterise the utility in these areas as
well. We accomplish this by observing how utility changes as both p and ^ changes.
However, before we do this, we present equivalent expressions for the Value-Based
Utility functions.
T h e o re m 1 An equivalent ^pression for Equation 2.1 is given by:
Ui,QoS,m,AtiP^ ^ ~ g
P ro o f. Prom Equation 2.1, we can expand the second term to get ^ We
then rearrange the terms to give us Grouping terms gives ^ and
simplifying gives us the result above.
T h e o re m 2 A n equivalent expression for Equation 2.2 is given by:
^i,Qo5,m,At(lî b) = a (2-4)
P ro o f. This is just a simple rearrangement of terms.
Taking the derivative of theorems 1 and 2 with respect to ^ yield ^ and a re
spectively; we see th at both slopes are constant making it easy to compare utilities.
CHAPTER 2. VALUE-BASED U TILITY 34
U tility
m ax
m tn
^ 8 0
p=.95 p = 1 .0
,=.90
UH
-10 max
0 0.2 0.4 0.6 0.8 1
G /N
Fig. 2.4: This figure shows the utility’s sensitivity to p. As p approaches one, the steeper the slope becomes.
strict, the more susceptible users are to missed targets. This behaviour is illustrated
in Figure 2.4. In this figure, the lines represent the utilities of fixed p’s as G /N is
made to vary from zero to one. Observe that the utilities of larger p’s are steeper than
the ones with smaller p’s. As an example, the line representing p = 0.95 is sloping
at an angle of % 87.13° while the line representing p = 0.50 is sloping at an angle of
~ 63.43°. Generalising gives us the following definition:
D efin itio n 10 U ser Sensitivity. Given two users A and B with p ’s p\ and p2 re
spectively, we say that user A: a) is more sensitive than B if p\ > P2,’ b) as sensitive as
B if Pi — P2,‘ and c) is less sensitive than B if p\ < p2- Generally, it is more difficult to satisfy a sensitive user than a less-sensitive user.
2.4
M axim um N um ber o f Satisfied U sers - A n E xam ple
One of the most straightforward uses of VBU is to find the highest number of satis
fied users. In an earlier work [30], VBU was used to find the maximum number of
satisfied voice calls supported by a 10 Mbps Ethernet hub. Utilities were measured
C H APTER 2. VALUE-BASED U T IL IT Y 35
transmission rate on the measured VBU. It is well known th a t large frames maximise
Ethernet throughput while small frames reduce utilisation [4,1, 34, 21]. In this section
we present some results from our earlier work [30] to show how VBU can be used to
quantify the effects of frame sizes and transmission rates on the maximum number of
voice calls supported.
2.4.1 E x p erim en ta l M o d el
A model^ was developed for an 10 Mbps Ethernet Hub using the CLOWN simulation
environment [71]^. In the model, each station sharing the Ethernet hub emulates a
64 Kbps voice source without silence suppression. Each source transmits a fixed size
frame P bytes every (f) ms to a randomly chosen receiver. Five different frame size-
rate (P-(j>) pairs were studied (see Table 2.1). For a given source N, each P-cp pair
was used to load the Ethernet until 40000 frames were transm itted successfully across
the Ethernet. This was rephcated ten times for each source N. Two event times are
logged: the time the frame was created at the source and the time it was received at
the receiver. From these information statistics such as throughput, delay, jitter as well
as VBU for these performance indices can be obtained. The number of happy users,
VQoS^ can be determined by counting the number of users whose Ui^QoS is greater or
equal to zero. More formally, the number of satisfied users for a particular QoS is
given by following definition :
Definition 11 Total Satisfied Users.
Vqos = \X \ where X = { x : x e {Ui^QoS > 0}} (2.5)
2 .4 .2 D iscu ssio n
We now show selected results illustrating the relationship between channel utilisation
and the maximum number of satisfied users for throughput (V^), delay (Vj), and jitter
{Vj). Figure 2.5(a) shows the channel efficiency as a function of the number of sources
CH APTER 2. VALUE-BASED U TILITY 36
source (f) (ms) P bytes
1 10 80
2 20 160
3 40 320
4 80 640
5 160 1280
Table 2.1: 64 Kbps Source Models with DiflFerent Frame Sizes and Rates
0.8
5-Vs vs tANTiter of Voba Cafe when f iame Sze and Rsde am Varied (p=0.90. b^ 7?80)
40 60 æ 100 120 140 160 180 nufTit»r of wok» cafe
(a) Channel Efficiency vs Number of Voice (b) V» vs Number of Voice Calls
Calls.
Fig, 2.5: Channel Utilisation and Vg vs Number of Voice Calls
for the different P-(f) pairs'^. In the figure it can be seen that with increasing frame
sizes and slower transmission rates, the utilisation increases. In all ^ ’s the utilisation
reaches a point where it eventually levels off. We would suspect that the number of
satisfied users will not be maximum above the knee point of utilisation. This intuition
is confirmed by Figure 2.5(b) where the resulting Vg when p = 0.90 and b = 7280
bytes are shown. In all (j) cases, the maximum number of satisfied users is below the
knee point and when utilisation reaches the knee, the number of satisfied users is zero
or near zero. This result is quite significant as it indicates that in terms of utility,
operating the Ethernet at the maximum (near collapse) possible utilisation is not in
the best interest of users.
Aside from varying the frame size and rate, there are two possible actions th at can
CH APTER 2. VALUE-BASED U TILITY 37
Vd v s Number olVMco C a ls when p is V arM ( p h l^ m s .b » 1 1 ms)
40 60 80 to o 120 140 160 180 number o( voice caite
Fig. 2.6: Vfi vs Number of Voice Calls with diflFerent p ’s {(/) = 40 ms and 6 = 1 1 ms)
ciffect the maximum number of satisfied users supported. The first way is by varying
the value of p in the utilities. Definition 10 tells us that it is more difficult to satisfy
sensitive users. Therefore, it is likely that we can make more of the less sensitive
users happy than a group of sensitive users. This is confirmed by the result shown in
Figure 2.6. The decline of the number of satisfied users, V^, is smoother at higher p’s.
For lower p’s, the decline is more sudden and abrupt. In terms of management, a slow
decline is preferred because it allows for possible control actions to take place. These
results are interesting because they show different possible trade-off’s between control
and meeting the objectives.
The other factor that can affect the value of the maximum number of satisfied users
is the target bound 6. Similarly to p, we would expect that a much more relaxed bound
would allow for more users to be happy. However, it seems that this is not always
the case. Figure 2.7(a) shows one example. In this figure, the curves representing
the number of satisfied users for the three different delay bounds follow the same
behaviour as the number of voice calls is increased. In this particular situation, no
différences can be inferred. This not the case for jitter bounds. In Figure 2.7(b),
we find that increasing the jitter bounds improves the Vj when the number of voice
calls is increased. From both observations, it appears that the effects of 6 are QoS
CH APTER 2. VALUE-BASED U TILITY 38
0.4
0
V) V8 Number 01 Vote© C a te wh8 0 b IB Variai (pN=40 m& p=0 80)
40 60 80 100 120 140 160 180 number o1 «ok» c a te
1
0
nurrtMf of voice c ate
(a) Vd vs Number of Voice Calls (b) Vj vs Number of Voice Calls
Fig. 2.7: Vd and Vj with Different Target Bounds 6’s {(p = 40 ms, p — 0.80)
2.5
Sum m ary
Our aim in this chapter was to represent both the state and degree of user satisfaction
in a form that can be used for characterising network services and managing resources.
We began by further motivating the need for such a representation of user satisfaction.
In particular, we highlighted how existing views fail to encapsulate both aspects of
satisfaction completely. We then introduced a notion of utility which we believe
successfully models both state and degree of satisfaction. In a simple example, we
demonstrated how our representation of satisfaction can be used as performance index
Chapter 3
U tility in TrafRc M anagement
3.1
O verview
This chapter establishes the context in which utUity can be used for traffic man
agement. We begin by looking at how networks use various mechanisms to achieve
service quality. These mechanisms are then abstracted and are described in a general
framework on how utility may be applied to service differentiation.
3.2
In troduction
In an integrated service environment, the primary objective is the satisfaction of the
application requirements. This is difficult to accomplish because of the diversity in the
QoS requirements of apphcations. Two opposing views on how to achieve this objective
have been the subject of numerous debates [11]. The first view is th a t the problem can
be overcome by throwing bsmdwidth a t it. It assumes th at applications wül always
get the resources they need because bandwidth is infinite. The main argument for
the viability of this approach is the steady fall of the cost of bandwidth. However,
this method potentially wastes resources when it is available. In addition, it may
not always be feasible because bandwidth cannot be expected to be available on an
end-to-end basis. The second option makes use of traffic management in an attem pt
to use resources more efficiently. In order to achieve service commitments through
traffic management, the routers may need to have more sophisticated scheduling and