University of Windsor University of Windsor
Scholarship at UWindsor
Scholarship at UWindsor
Electronic Theses and Dissertations Theses, Dissertations, and Major Papers
2010
Study of Thickly and Thinly Sectioned Melanoma Skin Tissues
Study of Thickly and Thinly Sectioned Melanoma Skin Tissues
with Mechanical Scanning Acoustic Reflection Microscopy
with Mechanical Scanning Acoustic Reflection Microscopy
Yihan Tian
University of Windsor
Follow this and additional works at: https://scholar.uwindsor.ca/etd
Recommended Citation Recommended Citation
Tian, Yihan, "Study of Thickly and Thinly Sectioned Melanoma Skin Tissues with Mechanical Scanning Acoustic Reflection Microscopy" (2010). Electronic Theses and Dissertations. 8209.
https://scholar.uwindsor.ca/etd/8209
Study of Thickly and Thinly Sectioned Melanoma Skin
Tissues with Mechanical Scanning Acoustic Reflection
Microscopy
By
Yihan Tian
A Thesis
Submitted to the Faculty of Graduate Studies Through the Department of Physics In Partial Fulfillment of the Requirements for
The Degree of Master of Science at the University of Windsor
Windsor, Ontario, Canada
2010
1*1
Library and Archives Canada Published Heritage Branch Biblioth6que et Archives Canada Direction duPatrimoine de l'6dition
395 Wellington Street Ottawa ON K1A 0N4 Canada
395, rue Wellington Ottawa ON K1A 0N4 Canada
Your file Votre reference
ISBN: 978-0-494-70576-6
Our file Notre riterence
ISBN: 978-0-494-70576-6
NOTICE: AVIS:
The author has granted a
non-exclusive license allowing Library and Archives Canada to reproduce, publish, archive, preserve, conserve, communicate to the public by
telecommunication or on the Internet, loan, distribute and sell theses
worldwide, for commercial or non-commercial purposes, in microform, paper, electronic and/or any other formats.
L'auteur a accorde une licence non exclusive permettant a la Bibliotheque et Archives Canada de reproduire, publier, archiver, sauvegarder, conserver, transmettre au public par telecommunication ou par ('Internet, preter, distribuer et vendre des theses partout dans le monde, a des fins commerciales ou autres, sur support microforme, papier, electronique et/ou autres formats.
The author retains copyright ownership and moral rights in this thesis. Neither the thesis nor substantial extracts from it may be printed or otherwise reproduced without the author's permission.
L'auteur conserve la propriete du droit d'auteur et des droits moraux qui protege cette these. Ni la these ni des extraits substantiels de celle-ci ne doivent etre imprimes ou autrement
reproduits sans son autorisation.
In compliance with the Canadian Privacy Act some supporting forms may have been removed from this thesis.
While these forms may be included in the document page count, their removal does not represent any loss of content from the thesis.
Conformement a la loi canadienne sur la protection de la vie privee, quelques formulaires secondaires ont ete enleves de cette these.
Bien que ces formulaires aient inclus dans la pagination, il n'y aura aucun contenu manquant.
DECLARATION OF ORIGINALITY
I hereby certify that I am the sole author of this thesis and that no part of this
thesis has been published or submitted for publication.
I certify that, to the best of my knowledge, my thesis does not infringe upon
anyone's copyright nor violate any proprietary rights and that any ideas,
techniques, quotations, or any other material from the work of other people
included in my thesis, published or otherwise, are fully acknowledged in
accordance with the standard referencing practices. Furthermore, to the extent
that I have included copyrighted material that surpasses the bounds of fair
dealing within the meaning of the Canada Copyright Act, I certify that I have
obtained a written permission from the copyright owner(s) to include such
material(s) in my thesis and have included copies of such copyright clearances
to my appendix.
I declare that this is a true copy of my thesis, including any final revisions, as
approved by my thesis committee and the Graduate Studies office, and that
this thesis has not been submitted for a higher degree to any other University
ABSTRACT
The contents of the present study are organized into two parts: the first is
focused on characterizing a thickly sectioned skin tissue with a mechanical
scanning acoustic reflection microscopy (hereinafter simply called "SAM") of
pulse-wave mode. The second part is focused on characterizing a thinly
sectioned skin tissue with tone-burst-wave mode of SAM.
We showed analyses of optical and acoustical images, as well as developed
mathematical models using an angular spectrum approach for predicting
contrast and characterizing acoustic properties of both sections of tissue.
Also, for thin specimens a reflectance function for the tissue located on a
substrate was theoretically determined, and fitted into a mathematical model of
the V(z) curve. Their leaky surface acoustic wave velocities were obtained
from the experimentally formed V(z) curves through FFT analyses. Finally, a
computer simulation with a parameter-fitting technique was implemented to
Dedicated to my parents
ACKNOWLEDGEMENTS
I want to express my sincere thanks to the people who gave me direct or
indirect support during my graduate study and my research at the University of
Windsor and Pennsylvania State University.
My sincere appreciation first goes to Dr. E. Maeva for her constant and
continued support which brought me the peace of mind to freely think, study
and research. Her guidance both with respect to the science behind this project
and academic pursuit as a whole has been indispensable.
I would especially like to thank Dr. C. Miyasaka who initiated the ideas, taught
me advanced ultrasonic imaging and quantitative data acquisition techniques,
and kept me in the right direction during my research.
Furthermore, I would like to thank Dr. B. R. Tittmann who kindly provided his
facility and equipment, and gave useful advice for my research.
As well, I would also like to thank Dr. D. Shum for his great help to provide a
biological specimen and pathological evaluation of an image formed from the
specimen.
And finally, I would like to thank Dr. I. Seviaryn for teaching me how to
appropriately operate a mechanical scanning acoustic reflection microscope
TABLE OF CONTENTS
DECLARATION OF ORIGINALITY iii
ABSTRACT iv
DEDICATION v
ACKNOWLEDGEMENTS vi
LIST OF TABLES ix
LIST OF FIGURES x
CHAPTER
I. INTRODUCTION
1
II. REVIEW OF LITERATURE
2.1 Brief History of SAM 6 2.2 Biological Applications for SAM 13
III. THICK SECTIONED MELANOMA TISSUE
3.1 Design and Methodology 21 3.1.1 Imaging Principle (Pulse-Wave Mode) 21
3.1.2 Resolution 26 3.1.3 Description of Specimen 28
3.1.4 Experimental Procedures and Results 29
3.1.4.1 Experimental Setup 29 3.1.4.2 Optical Images 31 3.1.4.3 Acoustic Images (C-Scan) 32
3.1.4.4 Acoustic Images (B-Scan) 34 3.1.4.5 Waveform Analysis 37 3.1.4.6 Frequency Analysis 43
3.2 Physical and Mathematical Modeling 48
IV. THIN SECTIONED MELANOMA TISSUE
4.1 Design and Methodology 56 4.1.1 Imaging Principle (Tone-Burst-Wave Mode) 60
4.1.2 Description of Specimen 63 4.1.3 Experimental Procedures and Results 65
4.1.3.4 Method for Visualizing Anisotropy 76
4.2 Physical and Mathematical Modeling 78
4.3 Computer Simulation 87
V. CONCLUSIONS AND RECOMMENDATIONS
93
APPENDICES
A - RAY TRACING OF ULTRASONIC WAVE PROPAGATION 94
B - ACOUSTIC WAVES IN ISOTROPIC MEDIA 95
C - REFLECTANCE FUNCTION 99 D - TRANSDUCER OUTPUT 105
E - DETERMINATION OF 107
F - THEORY OF V(Z) CURVE (Ray Optic Model) 109
REFERENCES 111
LIST OF TABLES
Table 1. Comparison of acoustic impedance 29
Table 2. Amplitudes of waveforms 38
Table 3. Center frequency and acoustic signal loss 39
Table 4. Acoustic Properties of Some Biological Tissue and Water 40
Table 5. Parameters of Acoustic Lens 91
LIST OF FIGURES
Fig. 1. Schematic diagram of the experimental setup for the SAM (Pulse-Wave
Mode) 23
Fig. 2. Schematic diagram showing reflected acoustic beams from each
interface of a specimen system 24-25
Fig. 3. Optical images of thickly sectioned abnormal and normal skin tissues
28
Fig. 4. Setup of the specimen chamber 30
Fig. 5. Optical mosaic images of skin tissues 31
Fig. 6. Acoustic C-Scan images of thick skin tissues 33
Fig. 7. B-scan images of thickly sectioned abnormal and normal skin tissues 35-36
Fig. 8. Reference for waveform analysis 37
Fig. 9. Waveforms obtained from the thickly sectioned abnormal tissue. 38
Fig. 10. A-Scan images of thick melanoma tissue 40
Fig. 11. Setup of specimen in the chamber for attenuation measurement 42
Fig. 12. Schematic diagram showing acoustic reflected beams for attenuation
Measurement 43
Fig. 13. FFT reference (FFT of water) 44-45
Fig. 14. FFT analysis of thick melanoma skin tissue 46
Fig. 15. The structure of the specimen and their periphery conditions 51
Fig. 16. Optical image of thinly sectioned melanoma tissue 57
Fig. 17. Acoustic image of the thinly sectioned melanoma tissue with reflected
Fig. 18. Resolution Comparison (Tone-Burst-Wave Mode) 59
Fig. 19. Schematic diagram of the SAM (Tone-Burst-Wave Mode) 60
Fig. 20. Interior observation with defocused lens (Tone-Burst-Wave Mode) 62
Fig. 21. Optical images of normal/abnormal specimens at low magnification
64
Fig. 22. Optical images of a thinly sliced normal skin tissue 66
Fig. 23. Montage optical image of abnormal skin tissue 68
Fig. 24. Optical images of melanoma tumor in the dermis 69
Fig. 25. Comparison of optical and acoustic images of normal skin specimen 71
Fig. 26. Comparison of optical and acoustic images of abnormal skin specimen
73
Fig. 27. Maturational stages of melanosomes 75
Fig. 28. Experimental TEM images of thinly sectioned melanoma skin tissue
75
Fig. 29. Schematic diagram of shear wave-buffer rod lens system 76
Fig. 30. Isotropic acoustic images of skin tissues 77
Fig. 31. The V(z) curve (experimental result) for fused quartz 79
Fig. 32. Schematic diagram of contrast mechanism in the spatial distribution
80
Fig. 33. The structure of the specimen and their periphery conditions 82
Fig. 34. SAW velocity acquisition with FFT 87
Fig. 35. V(z) curves obtained at abnormal/normal spot region of the melanoma
Fig. 37. V(z) curve simulation of abnormal/normal spot region of the melanoma
CHAPTER I
INTRODUCTION
What is melanoma?
Melanoma is a form of cancer that begins in melanocytes {i.e., cells that make
the pigment melanin). It may start predominantly in a mole {i.e., skin
melanoma), but also may present itself in other pigmented tissues, such as in
the eye or in the intestines. It is one of the less common types of skin cancer
but causes the majority (75%) of skin cancer related deaths.
The skin is the body's largest organ. It protects the organs inside your body
from injury, infection, heat and ultraviolet light from the sun. The skin has two
main layers. The layer at the surface is called the epidermis. Below the
epidermis is the inner layer, the dermis. Deep in the epidermis are cells
called melanocytes. Melanocytes make melanin, which gives color to your
skin. When skin is exposed to the sun, the melanocytes make more melanin
and cause the skin to tan or darken. Sometimes melanocytes cluster together
and form moles {i.e., nevi).
There are three types of skin cancer:
• Squamous Cell Cancer (hereinafter simply called "SCC") starts in the
squamous cells {i.e., thin flat cells found on the surface of the skin)
• Basal Cell Cancer (hereinafter simply called "BCC") starts in the basal
cells (I.e., round cells that lie under the squamous cells).
• Melanoma starts in the melanocytes.
Melanoma is less common than squamous cell and basal cell skin cancers
(sometimes called non-melanoma skin cancers). Melanoma can start in other
places in the body where melanocytes are found, such as the eyes, the mouth,
Early signs of melanoma are changes in the shape or color of existing moles.
A mole, whose medical name is a melanocyte nevus, is a common benign
growth of the color cells of the skin called melanocytes. Moles that are
irregular in color or shape are suspicious of malignant or premalignant
melanoma. Melanoma needs to be detected as early as possible in order for
patients to have the best possible prognosis due to its aggressive tendency to
invade other tissues of the body. Treatment is much less successful if the
cancer is well advanced or has already metastasized to other areas.
How is melanoma diagnosed?
To detect melanomas, it is recommended to be aware of moles and check for
changes (i.e., shape, size, color, itching, bleeding and the like). Furthermore,
a popular method for remembering the signs and symptoms of melanoma is
the so-called mnemonic "ABCDE":
• Asymmetrical skin lesion. If the lesion was folded in half, the two sides
would not match.
• Border of the lesion is irregular.
• Colors: melanomas usually have multiple colors.
• Diameter: moles greater than 6 mm are more likely to be melanomas
than smaller moles.
• Enlarging: Enlarging or evolving. A mole or skin lesion that looks
different from the rest or is changing in size, shape, or color.
Therefore, any moles that are found that have notably altered, or are
asymmetric, have irregular borders or coloration, or are more than one-quarter
inch in diameter should be of special concern and be brought to the attention of
a medical professional.
A biopsy is necessary to make a definite diagnosis of melanoma. The doctor
will try to remove all of the unusual-looking growth or mole. The entire tumor
along with a margin of tissue that is not a visible part of the tumor is removed.
all of the growth, then a sample of the tissue will be removed. This is called
an incisional biopsy. The removed tissue sample is examined under a
microscope to determine if cancer cells are present and, if so, which kind. If
an excisional biopsy is performed, the physician examining the sample also
should be able to determine how deeply the cancer has penetrated the skin. If
the sample reveals melanoma cells then further testing is usually carried out to
determine the extent of the cancer growth before a specific treatment plan is
developed.
Present Problems for Biopsy
Excisional biopsy is the preferred method for removing lesions suspected to be
melanoma. The main limitation of excisional biopsy is the problem of
sampling error. The assumption that pathological examination of a few
samples of tissue is representative of the pathological process involving the
entire organ is not always correct. This is particularly true when there is a
localized pathological process. Furthermore, when performing incisional
biopsy, large volumes of the tissues are required in order to reduce the
sampling error. It is not realistic to take such amounts from patients suffering
from diseases. A technique that enables visualization of in-situ cellular detail
in multiple areas would therefore provide superior information to that obtained
by biopsy.
Present Problems for Optical Microscopy
Conventional optical microscopes are often used for observing such data from
tissues or cells taken from patients. However, the cells or the tissues need to
be chemically stained and/or fixed for optical microscopic observation. The
staining and/or fixation usually kill the cells. Therefore, when those techniques
are applied, it is difficult to understand the real effects of the treatment or the
medicine, as the transformation in the tissue may only be visible in living cells.
Further, it takes at least one week to prepare the specimen for pathological
Why SAM?
The contrast mechanism of SAM is different from that of a conventional optical
microscopy [1 ]. Since staining and/or fixation of the specimen are not required
for the SAM, living cell activities can be observed directly with the SAM [2] so
that the sample preparation process can be effectively reduced. Furthermore,
SAM can nondestructively observe not only the surface but also the internal
structure of the specimen with sub-micron resolution when the SAM is operated
at a frequency at 1.0 GHz or more [3]. The SAM also has the capability of
measuring the mechanical properties {i.e., loss factor and modulus) of tissues
[4]. Therefore, a high frequency ultrasonic diagnostic apparatus could
provide pathological information about multiple areas of skin {i.e., epidermis
and dermis) and enable a more accurate assessment of pathology. It
sampling error is effectively reduced, the transformation of living cells and the
real effects of treatment or medicine within the tissue can be observed more
readily.
Objective of the Present Work
There are a number of publications on investigating thinly sectioned tissue with
SAM [5-18,29], but few publications have studied thickly sectioned biological
tissues including cancer cells or tumors [19-23,28]. Here, we present the first
attempt to systematically study thin and thick specimens sectioned from the
same melanoma skin tissue with the SAM. In this report, the systematic
procedures of the acoustic characterization of the thickly sectioned tissue are
described.
(1) High Quality Imaging and Characterization of Thickly Sectioned
Biological Tissue
The present study investigates the feasibility of applying in-vivo acoustic
microscopy to the analysis of cancerous tissue. However, observation of
an internal structure of a thickly sectioned biological tissue with
ultra-high-frequency SAM is relatively difficult for the following reasons.
First, an ultrasonic wave is attenuated in proportion to the square of its
from the acoustic lens to the tissue through the coupling medium {i.e.,
water), the wave may not penetrate into the appropriate internal focal
plane of the tissue. Even if the wave can penetrate into the internal focal
plane, the wave may not reflect from the tissue to the acoustic lens with
enough amplitude to form the acoustic image. Second, when a low
frequency ultrasonic wave is used, the image of the appropriate internal
focal plane of the specimen may be formed, but the resolution of the
image may not be very useful. Most importantly, if the surface has
irregularities or is rough, subsurface imaging is sub-optimal. Thus,
surface roughness poses a major limitation to acoustic microscopy. In
order to overcome these limitations in the present study, or imaging of
thickly sectioned cancer tissues was carried out with acoustic lenses
operating at frequencies in the range of 25MHz to 250MHz. This was
found to provide useful information without some of the disadvantages of
the ultra-high-frequency systems. Lower frequency acoustic lenses
provide better tissue penetration and stronger backscattered signals.
However, to determine the ideal trade-off between resolution and
penetration, it is important to establish the lowest frequency at which
cellular imaging for identification of tissue pathology is feasible. The
resultant images were then arranged to find out appropriate techniques for
improving scanning acoustic microscopy of melanoma cancer tissues.
(2) Mathematical Modeling
Using an angular spectrum approach, we developed a mathematical
model to analyze waveforms of the transducer output. The approach
was found to be useful to predict contrast in an acoustic image of thickly
sectioned tissue.
Note that part of the material included in Chapter III of this thesis has been
CHAPTER II
REVIEW OF THE LITERATURE
2.1 BRIEF HISTORY OF SAM
Basic Concept
In 1949, Sokolov suggested the possibilities of SAM as a concept and
indicating the advantages such a technology would have over conventional
optical light microscopes. He made a remarkable statement in his article that
the microstructure of a material could be microscopically visualized when using
ultrasound having a frequency at 1 GHz or more [31]. However, the
realization of a practical scanning acoustic microscope was delayed until the
development of electronic imaging, high frequency processing, and an acoustic
lens.
Hardware Development
In 1973, Lemons et al. developed a mechanically scanning acoustic
transmission microscope including two acoustic lenses (one for emitting
focused ultrasound into a specimen and another for receiving the ultrasound
transmitted from the specimen), and an RF generator emitting a high frequency
of 1 GHz and above [32], For this type of microscope, a specimen is located
between the lenses so that the thickness of the specimen is limited. To
overcome this disadvantage, the reflection mode of a mechanically scanning
acoustic microscope having one acoustic lens was developed [1]. This type
of SAM has been widely accepted as standard hardware in industry because of
its simple system configuration and capability of forming a highly resolved
image.
Quantitative Data Acquisition
In 1979, Weglein et al. found that a change in voltage of an acoustic lens,
a specimen, is unique to the elastic properties of the specimen [33]. This
phenomenon was modeled by ray tracing by Parmon et al. [34], and Fourier
optics by Atalar [35]. Also, they found that the velocity of surface acoustic
waves traveling within a spot of an ultrasonic beam could be obtained by
measuring the distance between the periods of the V(z) curves. By the
establishment of these basic theories, the SAM became the accepted
apparatus for not only imaging but also quantitative data acquisition. After its
development, the SAM was modified or newly designed to improve the
resolution, contrast, penetration depth, and capability of quantitative data
acquisition of the system, as well as to design the SAM for a specific
application.
Improvement of Resolution
Resolution of an image formed by the SAM is determined by the frequency of
the wave, the wave velocity in the coupling medium, and the lens geometry.
Therefore, three approaches were pursued to increase the resolution.
The first approach was to raise the acoustic frequency. By means of this
approach, Hadimiooglu et al. achieved a resolution of 0.2 micron by operating
at about 4.4 GHz with the specimen in boiling water in order to minimize the
attenuation of the coupling medium [36]. The second approach was to use
low velocity coupling media. Using the second approach, referred to as
cryogenic microscopy, Foster et al. were able to obtain a resolution of 20
nano-meters using super-fluid liquid helium as coupling medium at a
temperature of 0.2°K [37],
These approaches are excellent for increasing resolution on the surface of a
specimen, but not necessarily in its interior. In the first approach, the
ultrasonic wave is attenuated in proportion to the square of its frequency;
therefore, when a high frequency ultrasonic wave is used as a probe, the wave
will not penetrate the inside of the specimen, and the internal information may
not be obtained. In the second approach, the acoustic impedance if the
ultrasonic waves are reflected at the interface between the coupler and the
specimen, and it is unlikely that an image from any significant depth may be
obtained [38]. Hence, acoustic microscopy's most important and unique
feature, namely obtaining subsurface information may not be realized by these
two approaches.
The third approach, which was to design a new acoustic lens, has been
considered to be the best approach for maintaining the most important feature
of the SAM. By means of the third approach, the following new acoustic
lenses were proposed. Chubachi et al. developed the concave transducer to
increase resolution by removing spherical aberration [39]. Davids et al.,
Atalar et al., Yakub et al. and Miyasaka et al. proposed new acoustic lenses
having restricted apertures using Rayleigh waves [40], a non-spherical
aperture using Lamb waves [41], a pin hole aperture for near-field imaging [42],
and a center-sealed aperture substantially using shear waves [43],
respectively.
Improvement of Contrast
Apart from increase in resolution, contrast enhancement is another way to
increase imaging quality. Daft etal., Chou etal., and Atalar etal. proposed an
acoustic lens having a large transducer for phase contrast imaging [44], a
shear polarized transducer for increasing contrast of acoustic images [45], and
a slit aperture for pseudo line focusing to image anisotropy of materials [46],
respectively.
Penetration Depth
In the field of plastic matrix composites, especially fiber-reinforced plastic
(denoted as "FRP") laminates, it is necessary to detect delaminations located
at an interface between laminates. In the field of inspecting microelectronic
integrated circuits (denoted as "IC"), it is necessary to form a cross-sectional
image for displaying the details of defects (i.e., voids, delaminations,
micro-cracks or the like) located within an IC package. Materials commonly
MHz or higher may not penetrate into a portion of interest. Therefore, to meet
the requirements, a new SAM, which is an improved version of C-scan imaging
apparatus, was designed for using the time-of-flight method (pulse-wave
mode) with the lower frequency range of 10-100 MHz. [47-50]. This SAM can
perform A-scan and B-scan as well as C-scan so that conventional ultrasonic
techniques can be directly used. Therefore, this type of SAM is the most
widely used in various industries [51-56].
Improvement of Quantitative Data Acquisition Methods
Quantitative data {i.e., velocities of surface acoustic waves) obtained by a
spherical lens, which is commonly used for acoustic imaging, may not provide
sufficient information on the elastic anisotropy of materials. Kushibiki et al.
developed a cylindrical lens (or called "line-focus lens") and a measuring
method to overcome this issue [57].
Liang et al. developed a SAM which can obtain complex V(z) curves based on
a non-paraxial formulation of the V(z) integral, and a reflectance function of a
liquid-solid interface by inverting the V(z) curves formed at frequencies of 10
MHz or less [58]. Endo et al. improved the above SAM in terms of mechanical
movement and an increase in frequency range (up to 3.00 GHz) to perform
higher precision measurements [59].
Kulik et al. developed a SAM for continuous wave operation obtaining V(z)
curves having better signal-to-noise ratios [60].
Not adopting the V(z) curve techniques, Tsukahara et al. developed a SAM, a
so-called ultrasonic microspectometer, for accurately measuring an acoustic
reflection coefficient of isotropic and/or anisotropic materials at a frequency at
100 MHz or more [61].
Modifications for Applications
An acoustic image can be formed by using either amplitude or phase of the
ultrasonic signals reflected or transmitted from a specimen. The amplitudes
were often used to form the image because of the simplicity of designing
electric circuits. However, the phase contrast can often provide significant
information such as a residual stress distribution.
Nikoonahad developed the tilted transducer to obtain the differential phase
contrast [62], Meeks etal. developed a phase-sensitive SAM, which operated
at large bandwidth into the GHz regime [63].
(2) Use of Various Coupling Media
Water is commonly used as a coupling medium for the SAM. However, some
specimens allow only dry conditions. Attal et al. proposed liquid metals (i.e.,
mercury or gallium) as coupling media [64], Wickramasinghe et al. developed
a SAM using gases (i.e., Argon and Xenon) as coupling media under elevated
pressure [65]. To increase resolution, Karaki et al. developed an acoustic
microscope using liquid nitrogen instead of superfluid liquid helium, and
obtained images at 1.0 GHz [66]. Yamanaka et al. developed a
low-temperature microscope to study a 0.5 mm thick epoxy bonding between
two 1mm Polymethyl Methacrylate (PMMA) sheets at 40 MHz at -50°C using
methyl alcohol as a coupling medium [67], The above types of SAMs were
designed for use strictly in a laboratory because they required environmental
chambers for the coupling media.
For industrial use, the air-coupled SAM is desirable although the resolution is
limited. The challenge is the transfer of acoustic energy across the solid/air
interface. A calculation of the transmission coefficient between a
steel-transducer-face-plate and air is equal to only 1.797x10"5. This means
that 99.996% of the power is reflected back from the interface. Therefore, an
appropriate transducer needed to be developed. Fox et al. manufactured
transducers using silicone rubber as the front acoustic impedance matching
layer, and operating frequencies at 1 MHz and 2 MHz [68]. By using such a
measured from 20 mm to 40 mm with an accuracy of 0.5 mm. Further
improvements in transmission efficiency were shown by planting an acoustic
impedance matching layer that is composed of tiny glass spheres in matrix of
silicone rubber on piezoelectric elements [69], and [70]. Reilly et al. have
reported air-coupling transducers using piezoelectric composites, and
operating with tone-burst waves with frequency ranging from 250 kHz to 1.5
MHz. They have been successful in producing transmitted signals (milli-volt
level) through a composite laminated honeycomb structure at 500 kHz [71].
Shindel et al. developed a micro-machined capacitance air transducer
characterized by high bandwidths for evaluating composite materials [72],
The micro-machined capacitance air transducer could be operated with
frequency at 11.4 MHz [73]. Bhardwadj et al. equipped a transducer for a
non-contact SAM (reflection type) [74],
(3) Elevated Temperature
Observation of changes of interior portions of materials due to a temperature
increase had been desired with the SAM. Miyasaka et al. developed a SAM
for operating temperature up to 500°C to observe a specimen located in motor
oil [75]. Ihara et al. developed a SAM for operating up to 920°C for liquid
metals [76]. However, issues such as frequency increase still remain.
(4) Nonlinear Imaging with High Frequency Ultrasound
The sharply convergent acoustic beam used in the SAM can provide sufficient
intensity to produce strong nonlinear effects at microwave frequencies. First,
nonlinear imaging was performed with a mechanically scanned transmission
acoustic microscope. Second, harmonic acoustic radiation generated in the
vicinity of the beam focus is readily detected and used to form an image of an
object placed in the focal plane [77]. To obtain nonlinear data, the receiving
transducer is tuned to either the second or third harmonic. When harmonics
are produced, the resultant images have a complex appearance. However, a
significant portion of the detected signal is due to the non-linearity not
coupling medium. To minimize these phenomena, Yeack et al. used a
three-lens scanning acoustic microscope (transmission type) to achieve
non-secular oblique incidence. This enables the mixing of two independent
inputs to occur only in the specimen, thus eliminating the contribution from, for
example, the water coupling medium [78]. Germain et al. used high-order
harmonic acoustic radiation to form nonlinear images with a
mechanically-scanned reflection acoustic microscope [79], and evaluated
biological media [80]. Tan et al. constructed a micron wavelength acoustic
microscope to observe third-order nonlinear products [81]. More recently,
nonlinear effects have been studied in pressurized superfluid helium in which
resolution was shown improved beyond the diffraction limit [82-85]. Recently
several investigators have studied non-linear propagation with application to
2.2 BIOLOGICAL APPLICATIONS FOR SAM
In the biomedical field, many new treatment methods and new medications
have been developed. Obviously, their effects and side effects need to be
studied qualitatively and quantitatively. Conventional optical microscopes are
often used for observing such data from tissues or cells taken from patients as
specimens. However, the cells or the tissues need to be chemically stained
and/or fixed, in order to emphasize particular tissue features of interest for
optical microscopic observation. Such staining and/or fixation can be quite
involved and elaborate, many can take several days to implement and they
usually kill the cells. Therefore, when these techniques are applied for
microscopy, it is virtually impossible to visualize fresh or living tissue, as well as
it is difficult to understand the real effects of the treatment or the medicine,
because the transformation of interest in the tissue may only be visible in living
cells.
On the other hand, the contrast mechanism of a mechanical scanning acoustic
reflection microscope is different from that of a conventional optical microscope;
it has great inherent sensitivity and requires no staining to bring out the
features of interest [90]. Hence, acoustical methods permit us, in principle, to
observe living cells in fresh tissues. Furthermore, the SAM can
nondestructively observe not only the surface but also the internal structure of
the specimen with sub-micron resolution [91]. Although, as will be seen, many
similarities do exist between optical and acoustic images, many of the
important differences (such as the differences between the optical and elastic
properties of tissue) are not well known or fully appreciated. Part of the
problem centers on the fact that many of the subtle features noted in the
acoustic image are not understood or have not yet been correlated with a
particular biological process.
The acoustics have strong correlations to physics. Since a biological tissue is
assumed to be a liquid material or soft solid material, the elastic bulk modulus,
Young's modulus and Poission's ratio can be applied to assess the elastic
tissue have close relation to elasticity of the tissues. The SAM has the
capability of measuring the mechanical properties {i.e., loss factor and
modulus) of biological specimens. Even from the beginning of acoustic
microscopy in the mid-1970's, biomedical problems were thought to be an
important application area for this new technology.
The first attempt to study the microstructure of biological specimens with a
mechanical scanning acoustic transmission microscope was undertaken by
Lemons and Quate [92]. Maev et al. extended this technique, and intensively
applied it to various biological objects [93-95]. For their type of a system, a
specimen is located between the lenses so that the thickness of the specimen is
limited. Therefore, this technique did not receive widespread attention, and
over the past two decades wide application of acoustic microscopy to
biomedicine never developed as initially predicted. Recently, however, a new
generation of scientists has rediscovered acoustic microscopy and is applying
this tool to a myriad of applications in both the basic sciences as well as
diagnostic medicine. Biologists are beginning to apply acoustic microscopy to
the study of living cells, including cellular development and biochemical
processes, in a way simply not possible with any other imaging modality.
Pathologists are beginning to use acoustic microscopy to develop a new gold
standard by which tissue changes and disease processes may be defined.
Medical scientists are developing new tools, based on acoustic microscopy
technology, for the non-invasive and minimally invasive diagnosis of tissue
Cell Visualization
In 1979, R. Johnston etal. investigated the possibility of using SAM to analyze
subcellular components [96]. By sequential viewing of identified fixed cells
with acoustic, light, and electron microscopy, they have established that the
acoustic microscope can readily detect such features as nuclei and nucleoli,
mitochondria, and actin cables. Under optimal conditions, images can even be
obtained of filopodia, slender projections of the cell surface that are
approximately 0.1-0.2|im in diameter. It has also been proposed that
acoustic microscopy technology might be adopted for in vivo applications.
SAM has been applied in medicine and biology by Tohoku University since
1980 [97,98]. There are several objectives for using SAM for medicine
because SAM can be applied for intra-operative pathological examination since
it does not require a special staining technique.
Biological cells and/ or tissues with acoustic impedances close to that of water
and virtually no contrast caused by the difference in reflection coefficient have
been displayed in acoustic micrographs. Basically, contrast in the acoustic
images of living cells in the tissues was generated from the acoustic properties
(i.e., density, stiffness, and the variation in attenuation) of the cells as the
acoustic waves propagate within the tissues. Hence, it was necessary for the
specimens to be mounted onto substrates composed of highly reflective
materials [i.e., glass, fused quartz, or the like) as background for making
maximum use of the variation in absorption. Using this technique, Hildebrand
et al. applied the SAM to acoustically visualize different living cells grown on
substrates of different materials [99]. They report preliminary results of the
observation by high-frequency acoustic microscopy of living cells in vitro.
Variation in distance separating the acoustic lens and the viewed cell also has
a profound effect on the image. When the substratum is located at the focal
plane, thick regions of the cell show a darkening that can be related to cellular
acoustic attenuation. When the top of the cell is placed near the focal plane,
concentric bright and dark rings appear in the image. The location of the rings
stiffness and density of the cell.
Additionally, for investigation of the feasibility of imaging at the cellular level
using acoustic microscopy, P. Anthony et al. have examined the possible
effects of high-frequency ultrasound on cellular integrity of cultured fibroblasts
[100]. Their results show that the exposure of fibroblasts to 600MHz
ultrasound at intensities sufficient to image cellular detail did not result in
observed changes in cell shape, cell swelling, or disruption of the cell or
nuclear membrane. Moreover, neither thermal nor non-thermal effects were
observed and the acoustic power levels were estimated to be well below those
where adverse effects are noted.
Y. Saijo et al. evaluated the human umbilical vein endothelial cells (HUVECs)
before and after exposure to endotoxin by using SAM with a frequency range
of 100-210MHz. The acoustic images were successfully obtained to identify
the outer shape of the HUVEC and the location of the nucleus in the cell. The
attenuation of the nucleus is higher than that of the cytoplasm. The attenuation
of the cytoplasm was increased and became inhomogeneous after endotoxin
exposure. Thus, they demonstrated that SAM is useful for assessing cellular
viscoelastic properties since it can detect both the morphological and acoustic
changes without contacting the cellular surface [101].
Also, acoustic microscopy in principle allows distinguishing between
modulation of the signal by the viscous properties of a material and its elastic
properties. It is a unique tool for the investigation of mechanical properties of
cells. This might bridge the gap between the level of supra-molecular
structures and ultrasound signals used in medical diagnosis. In the last
decade several efforts have been made to obtain elastic properties of a variety
of materials by acoustic microscopy techniques. This is done by analyzing
the V(z) curve which is also known as the acoustic material signature (AMS) of
the investigated specimen. Investigations of biological cells by acoustic
microscopy have been performed by Hildebrand et al. [102,103], Hildebrand
and Rugar [104], Bereiter-Hahn [105,106], and Litniewski and Bereiter-Hahn
connection between image contrast and cellular elastic properties
[102,103,105,106] and some others [104,107] tried to obtain quantitative
measurements of elastic properties of cells on a microscopic scale. There are
quite a few publications reporting that the elastic properties of living cells with
SAM [108-114] were investigated.
V(z) Curve
V(z) curves show the variation of voltage generated by an acoustic microscope
as the distance between the microscope lens and the specimen varies.
Different researchers used V(z) curves for measuring different properties of
materials; Kushibiki et al. [115,116] evaluated velocity and attenuation of
surface waves analyzing the V(z) curves, Weglein [117,118] measured coating
thickness; Kushibiki et al. [119] suggested the possibility of using it for material
anisotropy investigation, Briggs and his associates [120] used it for crack
detection, Yamanaka et al. [121] measured rates of surface hardening, Kino
and his associates [122] measured residual stress patterns in materials,
Hildebrand and Rugar [123], Litniewski and Bereiter-Hahn [124] determined
elastic properties of living and dead cells from V(z) analyses. Every
investigator computed V(z) curves with different simplifying assumptions which
are appropriate for their analysis. Then experimental V(z) curves were
properly compared with the corresponding theoretical V(z) curves to obtain
parameters of interest.
Tissue Characterization
Similarly, the elastic microstructure and properties of various thinly sliced
tissues have also been studied [125-131]. However, few articles have been
published for a tissue including cancer cells or tumors [132-138]. They have
been conducted with liver, prostate and eye cells, performed with frozen or
formalin-fixed slices, and have demonstrated that acoustic images distinctly
and precisely reveal abnormal portions in the tissues.
A group of researchers at University of California at Irvine determined that the
diagnosis [139,140]. Their studies began with a detailed comparison between
optical and acoustic microscopy. The optical image is of a standard
hematoxylin and eosin (hereinafter called simply "H&E") section; (i.e., the
tissue has been fixed and stained to bring out those features which could lead
to a diagnosis). The acoustic image was made from the adjoining tissue block
and was neither fixed nor stained. However, it was frozen to permit accurate
slicing. The samples were 6 microns thick. Since the optical images
represented the standards used for making a pathological evaluation, the
acoustic imaging was attempted to produce similarities to their optical
counterpart.
Y. Saijo et al. have shown that SAM can also classify the types of cancer in the
stomach [141] and kidney [142] by quantitative measurement of ultrasonic
attenuation and sound speed at 200MHz.
Ultrasonic data obtained with high-frequency SAM can be used for assessing
reflectability or texture in clinical echo-graphic imaging. It has been shown
that the calculated reflection and clinical data were matched in the myocardium
[143]. Chandraratna et al. also assessed the echo-bright area in the
myocardium by using 600 MHz SAM [144], The values of attenuation and
sound speed in six types of tissue components in atherosclerosis were
measured by 100-200 MHz SAM [145]. As the term arteriosclerosis means
hardening of the artery, atherosclerotic tissues have been known to increase in
stiffness or hardness in the development of atherosclerosis. Assessment of
the mechanical properties of atherosclerotic tissue is important, in addition to
determining the chemical components of the tissue. The composition of
atherosclerotic tissue is defined as the collagen fibers, with lipid and
calcification in the intima, smooth muscle and elastic fiber in the media, and
collagen fibers in the adventitia, respectively. Variations in the degree of
staining for optical microscopy indicate that the collagen content or the
chemical property is not homogeneous in fibrotic lesions in the intima.
The recent introduction of high frequency ultrasound in dermatology has
diagnosis in dermatological disease. Up to now, only a few quantitative
studies on skin have been reported in the literature. Skin attenuation
measurements [146-151] have been done in most cases in the transmission
mode for characterization of wounds, aging and burns of the skin. T.
Baldeweck et al. present the first simulation study on attenuation
measurements for the skin with the reflection mode [152]. Since skin is a
highly attenuating medium, the measurement of acoustic attenuation in
biological tissues has received much interest in the field of ultrasound tissue
characterization. For most biological tissues, the frequency-dependent
attenuation varies linearly with frequency across a usable frequency bandwidth.
With this assumption of a linear-with-frequency attenuation (P in dB/cmMHz)
and a Gaussian spectrum (the spectral variance is a constant a2 versus depth),
the attenuation coefficient (3 can be calculated with the following relation:
p = 8.68 dfc
ccr1 df (2.1)
where c is the speed of sound in the tissue.
For soft tissue characterization in the reflection mode, the spectra can be
estimated with the classical Short Time Fourier Analysis using Fast Fourier
Transform (hereinafter called simply "FFT") [153]. However, in the case of
highly attenuating media, limitations due to the method (stationarity, window
size) may prevent the use of Fourier analysis. Normally we find a higher
attenuation in cancerous tissue [154].
Thick Biological Tissues
To date, biomedical imaging with ultrasound for observing cellular tissue
structure has been limited to very thinly sliced tissue at very high ultrasonic
frequencies (i.e., 1GHz). Research has been done mainly concentrated on
thinly sectioned biological tissues which are of several micrometer thicknesses.
However, only a few publications have been made for thick section biological
tissues [155-157], E. Maeva et al. conducted an ex vivo imaging and
characterization of a fixed but unfrozen human breast cancer tissue that
contains breast cancer tumors with thickness about 2-5mm [155]. The
and contrast. C-scan images were shown to correlate well with
corresponding optical images. Also, the internal structures could be
highlighted in C-scan images that were not visible from the surfaces of the slice.
Moreover, velocity and attenuation image maps of the sample were also made
and used to identify the tumor regions based on quantitative criteria.
Further, a recent study to investigate the feasibility of applying in-vivo acoustic
microscopy to the analysis of cancerous tissue was investigated by C.
Miyasaka and E. Maeva et al. [157]. The study implemented ultrasonic
imaging for both thinly and thickly sectioned normal/abnormal skins, (abnormal
skin tissue contains a large amount of malignant melanoma tumors). Both
tissues were ultrasonically visualized with two different modes (i.e., pulse and
tone-burst wave modes) to obtain the highest quality ultrasonic images, and in
order to select the best mode for the design of a future SAM for in vivo
examination. In addition, a mathematical modeling technique based on an
angular spectrum approach for improving image processing and comparing
CHAPTER III
THICK SECTIONED MELANOMA TISSUE
3.1 DESIGN AND METHODOLOGY
3.1.1 Imaging Principle (Pulse-Wave Mode)
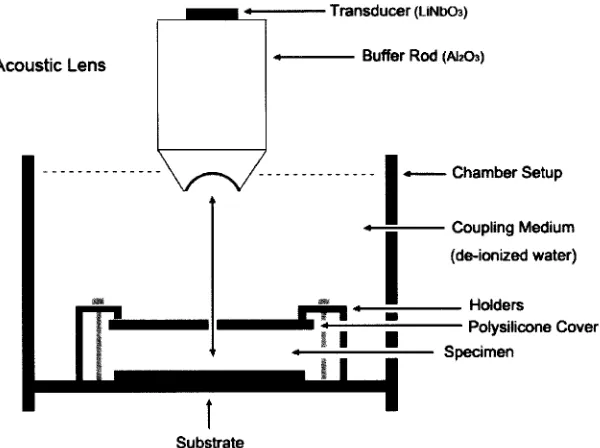
Figure 1 is the schematic diagram of the SAM (pulse-wave mode). The
imaging mechanism of the pulse-wave mode is described below.
An electrical signal (i.e., pulse wave) generated by a RF source is transmitted
via a circulator to a piezoelectric transducer (i.e., LiNbOa), located on the top of
a long buffer rod designed for the time-of-flight method. Input voltage from
the source to the transducer is approximately 100 V. The electrical signal is
converted into an acoustic signal (i.e., ultrasonic plane wave) by the
transducer. The ultrasonic plane wave travels through the buffer rod made of
fused quartz to a spherical recess (hereinafter called simply the "lens") located
at the bottom of the buffer rod. The lens converts the ultrasonic plane wave to
an ultrasonic spherical wave (i.e., ultrasonic beam).
The specimen is located on a c-cut sapphire substrate (thickness: 1.78 mm),
and is submerged in de-ionized water. A biological tissue with acoustic
impedances close to that of water has virtually no contrast because differences
in reflection coefficients are displayed. In other words, the contrast in the
acoustic image of the tissue is generated from the variation in attenuation from
tissue structure to tissue structure as the acoustic waves propagate within the
tissues. Therefore, it was necessary for the specimens to be mounted onto
substrates composed of highly reflective materials (i.e., sapphire, fused quartz,
The ultrasonic beam is focused on the back surface of the specimen via a thin
transparent poly-silicon cover, and reflected from the back surface. It
comprises a variety of properties such as good electrical insulation, thermal
stability, low toxicity, low chemical reactivity, etc., which are suitable for
medical preparation and applications. Also, it is stable for months and even
years and, in contrast to other materials, insensitive to rough handling. The
thickness of the cover is about 0.5 mm. The cover (i.e., Cover Well™ imaging
chamber gasket with adhesive) is manufactured by Molecular Probes. The
cover was fixed by an aluminum holder. When the specimen does not have
noticeable surface roughness, it is not necessary to place the cover for
visualization. The reflected ultrasonic beam, which carries acoustic
information of the specimen, is again converted into an ultrasonic plane wave
by the lens. The ultrasonic plane wave returns to the transducer through the
buffer rod. The ultrasonic plane wave is again converted into an electric
signal by the transducer.
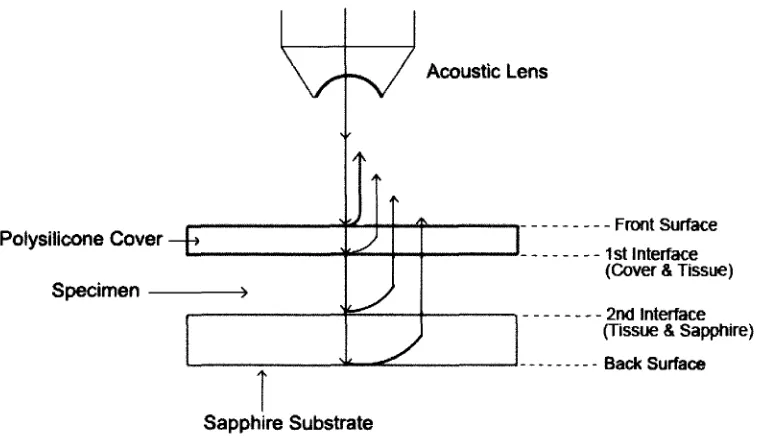
Suppose that a pulse wave emitted from an acoustic lens via a coupling
medium (i.e., de-ionized water) is focused on to the back surface of the
specimen. Suppose that the pulse wave is strong enough to travel through
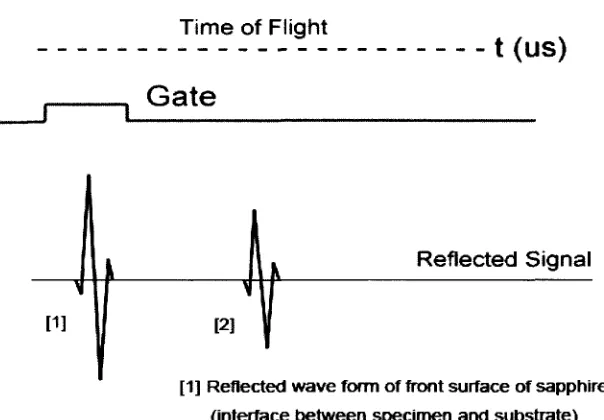
the specimen and reflect back to the acoustic lens. The timing of each
reflection is different because the traveling distance is different. The
waveform includes information such as amplitude, phase, or delay, and can be
monitored by the oscilloscope (see Fig. 2). The reflected pulse wave is
electronically gated out to visualize the portion of a horizontal cross-sectional
image by horizontally scanning the acoustic lens.
The acoustic lens is able to translate axially along the z-direction varying the
distance between the specimen and the lens for clearly focused sub-surface
focusing to obtain clear visualization. That is, when the acoustic lens is
focused on the surface of the specimen, the amplitude of the reflected signal
from the surface is optimized (we denote z = 0 ^im). Then, we look for a
reflected signal from the specimen. When focusing the acoustic signal
reflected from the subsurface plane of the specimen, the acoustic lens is
the distance from the surface to the subsurface of the specimen) until the
amplitude of the reflected signal is optimized.
In order to form a two-dimensional acoustic image, an acoustic lens is
mechanically scanned across a certain area of the specimen.
Acoustic Lens
Transducer (UNbOs)
Buffer Rod (AkCb)
Chamber Setup
Coupling Medium
(de-ionized water)
Holders
Polysilicone Cover
Specimen
Substrate
Fig. 1: Schematic diagram of the experimental setup for the SAM (Pulse-Wave Mode).
An appropriate acoustic lens must be selected considering its penetration depth in a specimen
Fig. 2(a): Schematic diagram showing reflected acoustic beams from each interface of a
specimen system.
In this setup, a thickly sectioned biological specimen is sandwiched between a thin transparent
poly-silicone cover and a sapphire substrate. Four reflections of the acoustic waves are
shown. The reflections are from the surface of the cover, interface between the cover and the
front surface of the specimen, the interface between the back surface of the specimen and the
surface of the substrate and the back surface of the substrate, respectively. Thickness of
Time of Flight
t(US) Gate
[1]
Reflected Signals
[1] Reflected wave form of front surface
[2] Reflected wave form of 1st interface
[3] Reflected wave form of 2nd interface
[4] Reflected wave form of back surface
Fig. 2(b): Schematic diagram of acoustic waves from the specimen located on the
substrate via a cover. The diagram shows timings of reflected pulse waves
reflected from a specimen.
The 1st signal is the reflected wave from the surface of the cover. The 2nd signal is the
reflected wave from the 1st interface between the back surface of the cover and the surface of
the specimen. The 3rd signal is the reflected wave from the 2nd interface between the back
surface of the specimen and the front surface of the substrate. The 4th signal is reflected
wave from the back surface of the substrate.
For forming an interior acoustic image, a gate is set on an appropriate reflected signal.
Selecting the appropriate reflected signal from the specimen is an important step in the
experiment. This step can be implemented by observing the change of signal amplitude
when moving the acoustic lens along its z-axis. When the acoustic lens is focused on the
interior plane of the specimen, the amplitude of the wave from the interior plane is maximized.
In this study, the 3rd reflected wave is gated to visualize the specimen interior. Since the
specimen is acoustically transparent, no image can be formed by gating the reflected signal
3.1.2 Resolution
Two types of resolution must be considered for the SAM. One is a lateral
resolution {i.e., Ar), and the other is a vertical resolution {i.e. Ap). They are
expressed as follows [158]:
'v. A
Ar = FA = F
I f J
Ap = 2F2A = (2F2)
{ \ v.
\ f J
= 2 fo
kDJ \ f J
f 1 \ 2 / \
v 2 tan Q j
1
y f )
2 tan 6
c \
v / y
(3.1)
(3.2)
where F is a constant related to lens geometry (i.e., F-number), which is given
by F=focal length/diameter of entrance pupil, A is the wavelength in the
coupling medium (i.e., de-ionized water), f is the frequency of the wave
generated by the transducer, vw is the longitudinal wave velocity in the coupling
medium, f0 is the focal distance of the lens, D is the diameter of the lens
aperture, and 6 is one-half of the aperture angle of the lens.
In order to observe cellular details within the tissue, the maximum lateral
resolution, Ar, has to be at least the same size of a cell, and is about 10 pm.
For example, suppose the acoustic wave velocity in water is 1,500 m/s, and the
F-number is 0.7. Then the lowest frequency for pulse-wave mode to visualize
the cells is approximately 100 MHz. Therefore, when the frequency of the
transducer output signal is less than 100 MHz, the pulse-wave mode apparatus
with the conventional c-scan technique is not capable of visualizing the cells.
Referring to Eq. (3.1), we know that the resolution of the image formed by the
coupling medium, and the lens geometry. Therefore, one approach to
increase resolution is to increase the acoustic frequency. However, as can be
appreciated, the ultrasonic wave is attenuated in proportion to the square of its
frequency; therefore, when a high-frequency ultrasonic wave is applied as a
probe, the wave will not penetrate to a significant depth inside the specimen,
and the internal information may not be obtained. Therefore, we need to
know the upper limitation of the frequency which can be applied to the
3.1.3 Description of Specimen
Figure 3(b) is a thickly sectioned normal skin tissue. The tissue is consistent
in color and softness. The thickness of the tissue is 3.0 mm. Figure 3(a) is a
thickly sectioned abnormal skin tissue. The abnormal tissue has a firmer
consistency, is substantially flatter, and has less surface roughness. When
compared to normal tissue, its thickness is also 3.0 mm. The tissue includes
black, white, and yellow colored portions. The black colored portions have
been diagnosed as melanoma carcinoma. In addition, the carcinoma area
has less surface roughness than the normal sections.
(a) (b)
Fig. 3: Optical images of thickly sectioned abnormal and normal skin tissue.
The images are formed by the digital camera (Olympus); (a) Thickly sectioned melanoma
3.1.4 Experimental Procedures and Results
3.1.4.1 Experimental Setup
Acoustical Image
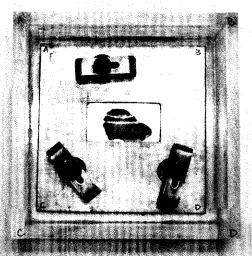
Figure 4 shows a thickly sectioned skin tissue as a specimen located on the
surface of a substrate made of c-cut sapphire with a thin transparent
poly-silicone (thickness: 500 fjm) cover pressed onto the tissue by a holder
made of aluminum. The cover makes the surface of the specimen flat,
thereby reducing effects to the acoustic image caused by surface roughness.
The cover also prevents the specimen from floating into the water. The
chamber is filled up with a coupling medium (i.e., water). For obtaining better
acoustic reflection, the specimen is located on a substrate made of a material
having highly reflective property such as a sapphire (see Table 1).
Table 1: Comparison of Acoustic Impedance, Z
Polystyrene Z= 2.52 kg/m2x10B
Silica Glass Z= 13.0 kg/m2x106
Fig. 4: Setup of the specimen in the chamber.
The thickly sectioned melanoma tissue is placed on the sapphire substrate; is covered by a
transparent cover made of poly-silicone, and is pressed by the holder toward the substrate to
3.1.4.2 Optical Image
Figures 5 (a) and (b) are comparisons of the optical images of horizontal
cross-sections of the thickly sectioned melanoma and normal skin tissues.
These images are formed by Stereoscopic Microscope (Olympus, Model:
SZX16). The optical image shows only the surface information of the thick
tissues. The surface of melanoma tissue varies in contrast, which indicates
the specimen has difference in electromagnetic properties. However, the
normal skin tissue is consistent in contrast, meaning the internal structure of
the specimen is continuous.
2 mm
(a) Optical Image of the Melanoma Skin Tissue (b) Optical Image of the Normal Skin Tissue
Fig. 5: Optical montage images of both horizontal cross-sections of thickly sectioned
melanoma and normal skin tissues (thickness: 3mm).
By comparison with the normal tissues, the appearance of the black coloration in the abnormal
tissue is evidently recognized as melanoma. The optical image of the abnormal tissue shows
the full extent of the carcinoma tumors spread mostly in the epidermis and the dermis, as well
as some that have scattered into the hypodermis and appeared around the cartilage, which is
present in the yellow zone that is surrounded by mostly fat. Within this zone, cartilage is
3.1.4.3 Acoustic Images (C-Scan)
Figures 6 (a) and (b) show acoustic C-Scan images of both thickly sectioned
abnormal melanoma and normal skin tissues horizontal cross-sections
(thickness: 3mm), respectively, with an acoustic lens (Olympus NDT) which
has an operating frequency at 50 MHz. The input frequency was 50 MHz,
which was the maximum frequency emitted from the acoustical lens to the
specimen. The acoustic beam was focused at the interface between the
specimen and the substrate, (i.e., Z=0 |am or V(0)). The resolution of the
image is limited due to the frequency of the acoustical lens. At this point we
are unable to diagnose the melanoma cancer cells from the acoustic images of
the thick tissues. However, they show both the surface and the internal
structures of the thickly sectioned tissue. Since the images cannot review
cellular details of the thickly sectioned tissue, we need to select an acoustic
lens capable of operating at a frequency at 50 MHz or more.
Furthermore, since acoustic properties (i.e., reflection coefficient, attenuation,
and velocity of acoustic wave) and the surface condition (i.e., surface
roughness and discontinuities) of the specimen are factors in forming acoustic
images, it is also significantly important to study the acoustic images in order to
obtain the acoustic properties and surface condition. Therefore, waveforms,
FFT analysis and B-Scan images need to be performed and carefully
2 mm 1 mm
(a) Acoustic Image of the Melanoma Skin Tissue (b) Acoustic Image of the Normal Skin Tissue
Fig. 6: (a) An acoustic Image (C-Scan) of a thickly sectioned melanoma skin tissue (Left),
and (b) a normal skin tissue (Right). Thickness of the tissues is about 3mm.
3.1.4.4 Acoustic Images (B-Scan)
A SAM b-scan image can form a vertical cross-sectional 2-D image of a
specimen. Figures 7(a) and 7(b) are B-scan images of melanoma and normal
skin tissues, respectively, and show the pseudo surface condition of the normal
and abnormal tissues. Figure 7(a) clearly illustrates the surface is much
rougher. The surface structure of the normal tissue is more uniform,
consistent, and homogeneous. The pseudo-surface discontinuities
correspond and are seen as the contrast difference in C-scan images, which is
caused by attenuation (i.e., absorption of ultrasound) due to surface
irregularities. This leads to a significant understanding of the contrast
(b) Normal Skin Tissue (Frequency: 50 MHz; Mode: Pulse-wave mode)
Fig. 7: B-scan images of thickly sectioned abnormal and normal skin tissues, wherein
3.1.4.5 Waveform Analysis
Attenuation
The insertion technique [22] is used to measure the acoustic properties of the
different materials. This technique is a relative measurement method which
employs water as the reference to study the transmission of longitudinal
ultrasonic waves through solid media embedded in an aqueous environment
{i.e., water). Therefore, the waveform of the wave reflected from the substrate
via water was taken as a reference waveform (see Fig. 8). In this case, the
acoustic beam is focused on the sapphire substrate, and because of high
reflectivity, the reflected signal carries relative high energy and its waveform
has an amplitude of 100% Full Screen Height (hereinafter called simply "FSH").
The echo amplitudes represent the product of the local scattering strength and
the attenuation loss factor, which takes into account scattering in all directions
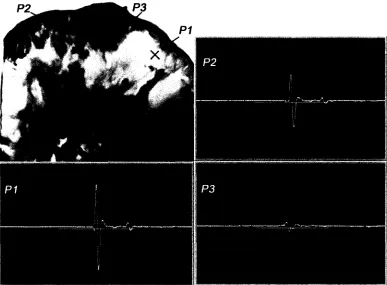
and absorption. Based on the difference in contrast, three points {i.e., P1, P2
and P3 in Fig. 9) were chosen. The waveforms corresponding to these points
are shown in Fig. 9, and their amplitudes are shown in Table 2.
WP: 17.098us, 12.678 mm Depth: 0.005us, 0.021mm Amp: 100% FSH
Fig. 8: Reference for waveform analysis. The waveform of the reflected wave from the
surface of the sapphire substrate via water shows that its amplitude is 100% FSH
Waveforms obtained from the thickly sectioned abnormal tissue. The tissue
includes melanoma cancer cells that were sandwiched between the poly-silicone
cover and the sapphire substrate.
Table 2: Amplitude of waveform (A)
P1 A=86%FSH
P2 A=53%FSH
The FFTs of P1, P2 and P3 were obtained (see Fig. 10) as well as their center
frequency and signal loss (see Table 3).
Table 3: Center Frequency, fc, and Acoustic Signal Loss, A
P1 fc= 12.207MHz A = 14.111 MHz
P2 fc = 9.766 MHz A = 16.552 MHz
P3 fc = 5.371 MHz A = 20.947 MHz
It can be seen that the frequency of the acoustic beam returned from the thickly
sectioned abnormal tissue is less than 15 MHz because of high attenuation of
the tissue including cancer cells. It could be concluded that emitting a 50
MHz frequency acoustic beam is not an appropriate way to form highly
resolved acoustic images in the pulse-wave mode.
The skin tissues are acoustically transparent due to the impedances of skin
tissues are close to that of water, therefore, there is no ultrasonic reflection
from the interface between water and skin tissue. (The acoustic impedance in
human soft tissues ranges from 1.35x10⁶ kg m"2s"1 for fat, to 1.74x10⁶ kg m"2
s"1 for muscle, the mean being 1.62x10⁶ kg m'2s'1. The impedance of skin has
been reported to range from 1.57x10⁶ kg m"2s"1 to 1.60x10⁶ kg m"2s'1 [30], see
Table 4 [159].) The contrast of the tissue in acoustic images is primarily
generated from difference in attenuation. High attenuation causes significant
signal loss. Therefore, by comparing the amplitudes of the waveforms the