Use of laser interferometry for measuring concrete
substrate roughness in patch repairs
GRIGORIADIS, Konstantinos
Available from Sheffield Hallam University Research Archive (SHURA) at:
http://shura.shu.ac.uk/11474/
This document is the author deposited version. You are advised to consult the publisher's version if you wish to cite from it.
Published version
GRIGORIADIS, Konstantinos (2016). Use of laser interferometry for measuring concrete substrate roughness in patch repairs. Automation in Construction, 64, 27-35.
Copyright and re-use policy
See http://shura.shu.ac.uk/information.html
Sheffield Hallam University Research Archive
1
Use of laser interferometry for measuring concrete substrate roughness in patch repairs
Konstantinos Grigoriadis1,2*
1
School of Engineering and Mathematical Sciences, City University, Northampton Square,
London, EC1V 0HB, UK
2
Centre for Infrastructure Management, Materials & Engineering Research Institute,
Sheffield Hallam University, Howard Street, Sheffield, S1 1WB, UK (*Corresponding
Author. Tel: +44 114 225 5075; Email: [email protected])
Abstract
The overall success and long-term durability of a patch repair is significantly influenced by
the bond developed at the interface between the concrete substrate and the repair material. In
turn, the bond strength is influenced by the topography (roughness) of the substrate surface
after removal of the defective concrete. However, different removal methods of defective
concrete produce substrate surfaces with different topographies. Hence, the ability to measure
and characterise the topography of substrate surfaces is of great importance for evaluating the
effectiveness of different removal methods. In this paper, the effect of two removal methods:
electric chipping hammers and Remote Robotic Hydro-erosion (RRH) on the surface
roughness is investigated through the use of a prototype non-contact (optical) laser
interferometry measuring device. Laboratory results show that the above equipment can be
used to characterise substrate roughness and confirm the ability of RRH to create rougher
surfaces as opposed to chipping hammers.
Keywords
2
Nomenclature
CV Coefficient of variation (%)
d Mean diameter of the circular area in sand patch method (mm)
Da Average double amplitude of an irregular wave (mm)
𝑑𝑧 𝑑𝑥
Local slope of the surface profile
L Evaluation length along the x axis (mm)
Lo Actual profile length (mm)
Lr Profile length ratio (-)
RG Roughness gradient (mm)
RI Roughness index of sand patch method (mm)
Ra Average absolute slope (rad)
Rq Root mean square average slope (rad)
SD Standard deviation
Distance between measuring consecutive points (mm)
𝑥̅ Population mean
Double amplitude of a saw-toothed curve (mm)
1. Introduction
Surface roughness has a different meaning in different fields of Science and Engineering. In
the field of concrete patch repairs, surface roughness can be used to describe the topography
of the concrete substrate prior to the application of repair. The overall success and long-term
durability of a concrete patch repair is highly dependent upon the interface bond between the
concrete substrate and the repair material. Interface bond consists of mechanical interlocking
and adhesion. The effect of mechanical interlocking is determined by the surface roughness
3
the hardened concrete substrate and the paste of the repair material. Hence, adhesion is
influenced by the factors that generally influence aggregate-paste bond as highlighted by
Neville [1] and Mindess et al. [2]. Although, adhesion develops as the repair material cures, the contribution of mechanical interlocking stays the same with age. However, increased
surface roughness results in improved mechanical interlocking which in turn increases the
interface bond. Hence, more surface area is available for the paste to adhere and together with
mechanical interlocking it increases the bond strength [3].
The surface roughness needs to be measured and characterised in order to study its influence
on the bond between concrete substrate and the repair material. However, with the exception
of sand patch and contact (stylus) profilometry methods [4-7], no other method has been standardised by BS EN 1504-10 [4] for use in the field of concrete patch repairs.
The sand patch method is based on measuring the mean peak-to-valley height known as
Roughness Index (RI) of a horizontal surface. For this purpose, 25 ml of dry sand is
distributed in a circular configuration on the surface to be measured in such a way that all
cavities are just filled. Next, the mean of 3 measured diameters in mm taken at three equally
spaced positions around the circumference of the circular area covered by the sand is
obtained as shown in Fig. 1. Finally, the Roughness Index is calculated by eq. (1) [4].
𝑹𝑰 =𝟑𝟏𝟖𝟎𝟎𝒅𝟐 (1)
where RI is the roughness index (mm) and d is the mean diameter of the circular area (mm).
The sand patch method is quick, inexpensive and very simple to perform on site. However, it
4
Fig. 1. Schematic diagram of sand patch method.
Contact profilometry method on the other hand, is based on the use of diamond stylus
instruments which move along a predetermined horizontal path and record vertical deflection
as a function of position as shown in Fig. 2. Typical stylus profilometers can measure small vertical deflections (10 nm to 1 mm) in relatively small industrial components such as screw
threads, gear shafts, and valves making them unsuitable for measuring concrete substrate
roughness. In addition, like the sand patch method, it requires contact with the substrate to be
characterised and its application is limited to horizontal surfaces.
Fig. 2. Schematic diagram of a typical contact (stylus) profilometer.
z
y
Surfaceunder examination
[image:5.595.77.321.481.672.2]5
A number of methods are available for measuring and characterising the surface roughness
of concrete pavements. Holt and Musgrove [8] provide a detailed review of these methods.
The surface roughness of concrete substrates can be characterised by comparing them with
standard Concrete Surface Profiles (CSP) which have been produced by ICRI in the form of
nine plastic model surfaces [9]. These profiles replicate different levels of surface roughness
obtained by different methods of concrete removal. Each profile is assigned a CSP number
starting from CSP1 (acid etched/almost flat) up to CSP9 (heavily scarified/very rough).
ASTM D7682 [10] describes a method to obtain a permanent record of a concrete surface
that has been abraded or roughened. For this purpose, a replica putty is used to obtain a
replica coupon of the concrete surface. Next, the replica coupon is either visually compared
to the nine plastic model surfaces produced by ICRI [9] or it is measured by a specially designed micrometre to determine its depth.
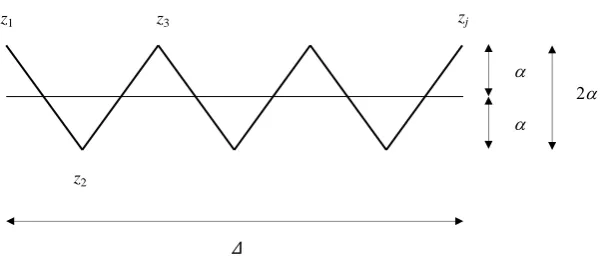
Silfwerbrand [11] proposed a different method for measuring and characterising surface roughness by developing an automatic laser profilometry equipment. His method was based
on approximating the measured surface profile by a saw-toothed curve as shown in Fig. 3. Double amplitude 2 was used as the main surface roughness parameter and was evaluated
for different values of the distance Δ between consecutive measuring points using eq. (2).
𝟐𝒂 =𝒏−𝟏𝟏 ∑𝒏−𝟏|𝒛𝒋+𝟏− 𝒛𝒋|
𝒋=𝟏 (2)
where 2 is the double amplitude of the saw-toothed curve (mm); Δ is the distance between
6
Fig. 3. Schematic diagram of saw-toothed roughness profile used by Silfwerbrand [11] for evaluating surface roughness.
Abu-Tair et al. [12] used a two-dimensional profile texture metre to measure and
characterise surface roughness. The profile texture metre consisted of 500 needles spaced 1
mm apart, each 0.8 mm in diameter. The needles were allowed to fall on the surface under
investigation and hence replicate its profile. A photograph was then taken of the profile. By
enlarging the photograph, measurements were obtained which defined the texture depth of
the concrete surface. The profile of the surface was treated as a series of irregular waves with
each wave having its own wavelength and minimum and maximum amplitude. Next, the
average double amplitude (Da) for each wave was evaluated. Finally, by averaging the values
of Da for all irregular waves, a roughness parameter known as roughness gradient (RG) was
determined.
Maerz et al. [13] developed an experimental hand-held laser profilometry scanner to measure the surface roughness of concrete substrates prior to FRP laminate application. It
was based on the principles of Schmaltz light-section microscope and the method of shadow
profilometry also known as laser striping. The captured image was transformed into a series
of eleven profiles in the x-y plane. Each profile was then measured by using Ra roughness
parameter described in Section 2.5.
Ahmed and Haas [14] used closed range digital photogrammetry to accurately reconstruct a
detailed 3D model of a pavement surface. For this purpose, a non-metric DSLR CMOS
z1
z2
z3 zj
[image:7.595.87.389.77.208.2]7
camera with built-in flash was used. Their results demonstrated the potential of using
photogrammetry for crack detection and 3D surface reconstruction. Photogrammetry is
simple to perform, has a relatively low cost and the accuracy of the 3D surface model can be
improved by adding new photographs taken from different positions [15]. However, it should
be noted that the accuracy of the 3D model is significantly affected by the type of camera
used and its specifications, number of photos used and position where these were taken [15].
Finally, over the last 5 years, a number of researchers [16-20] used both experimental and
commercial 3D laser scanners based on triangulation method to assess the surface of either
asphalt pavements or concrete substrates. They are based on a laser emitter which produces a
beam of energy that hits a point on the surface of the object under investigation. Next, the
reflected light is measured with the aid of a CCD or CMOS sensor. By repeating the
procedure for all points on the surface of the object it is possible to obtain their co-ordinates
using basic trigonometric equations and construct a 3D point cloud of the surface [17]. Once
a 3D model of the surface is obtained, it can be analysed using a number of 3D roughness
parameters.
2. Experimental programme
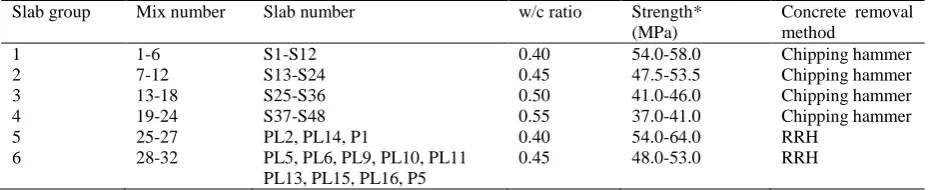
2.1. Details of mixes and slab specimens
A laboratory research based on the use of prototype non-contact equipment (described in
Section 2.6) was carried out in order to measure and characterise the surface roughness of concrete surfaces prior to patch repairs and at the same time check the ability of Remote
Robotic Hydro-erosion (RRH) to produce much rougher surfaces compared to chipping
hammers. Sixty concrete slab specimens with dimensions of 400 x 400 x 125 mm were
produced in six groups. The first four groups consisted of six mixes each. Group five
8
mixes were produced in total. One, two or three slabs together with the required number of
100 mm cubes for determining 28 day strength were produced from each mix. The w/c ratios
of groups 1, 2, 3, 4, 5 and 6 were 0.4, 0.45, 0.50, 0.55, 0.4 and 0.45, respectively. At 28 days
age, concrete was removed from the trowelled surface of the slabs using an electric chipping
[image:9.595.66.532.279.374.2]hammer or RRH as described in Section 2.4. Details of all slab mixes are shown in Table 1.
Table 1
Details of slabs.
Slab group Mix number Slab number w/c ratio Strength* (MPa)
Concrete removal method
1 1-6 S1-S12 0.40 54.0-58.0 Chipping hammer
2 7-12 S13-S24 0.45 47.5-53.5 Chipping hammer
3 13-18 S25-S36 0.50 41.0-46.0 Chipping hammer
4 19-24 S37-S48 0.55 37.0-41.0 Chipping hammer
5 25-27 PL2, PL14, P1 0.40 54.0-64.0 RRH
6 28-32 PL5, PL6, PL9, PL10, PL11 PL13, PL15, PL16, P5
0.45 48.0-53.0 RRH
* 28 day compressive strength.
2.2. Materials
The specimens were produced using OPC CEM I 42.5 N conforming to BS EN 197-1: 2000
[21], coarse sharp sand (50% passing a 600 m sieve), and uncrushed river gravel with
maximum coarse size of 10 mm. The mix design was based on the guidelines of BRE [22].
2.3. Casting and curing of slab specimens
The specimens were cast in timber moulds and compacted on a vibrating table. After the
concrete had set, the moulds were covered with damp rags. The specimens were de-moulded
24 hours after casting and placed in water. After 6 days in water, the specimens were
9
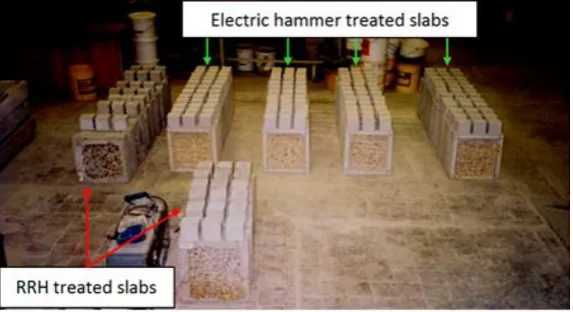
2.4. Surface preparation
A layer of approximately 25-30 mm was removed from the top (trowelled) surface of slabs
S1-S48 using a Kango Type 950 electric hammer which simulated the action of pneumatic
chipping hammers commonly used in the construction industry. In the remaining twelve slab
specimens (PL2, PL5, PL6, PL9-PL11, PL13-PL16, P1 and P5) a layer of approximately
25-30 mm was removed using Remote Robotic Hydro-erosion (RRH). RRH is a precise form of
robotic hydro-demolition that takes advantage of remote robotic technology and uses sensor
feedback to control better the quality and quantity of concrete removal [23-24]. A panoramic
[image:10.595.73.360.321.477.2]view of all specimens is shown in Fig. 4.
Fig. 4. Concrete substrate surfaces obtained using either RRH or an electric hammer.
2.5. Selection of roughness parameters
The first step in measuring and characterising concrete substrate surfaces is the acquisition
of a satisfactory profile. Once an adequate profile is obtained, it should be analysed and
characterised using some form of roughness index or parameter. Unfortunately, there is no
universal number, descriptor or parameter that can be used to analyse and characterise the
topography of a surface. A large number of two-dimensional (2D) and three-dimensional
(3D) roughness parameters have been developed to characterise the roughness of a surface
10
a review of the 2D parameters, whereas Griffiths [26] and Bewoor and Kulkarni [27] provide
a detailed review of both 2D and 3D parameters.
In the field of concrete patch repairs, the bond strength is considerably influenced by the
topography (roughness) of the substrate surface obtained after removal of the defective
concrete. Hence, roughness parameters which influence the surface contact area available
between concrete substrates and repair materials should be chosen and evaluated. Based on
the above criterion, 2D roughness parameters which are important for mechanical
interlocking [13, 25-27] are evaluated for the surface profile shown in Fig. 5.
The average slope Ra is evaluated by first calculating the slope between two successive
points of the surface profile as shown in Fig. 5. Next, the average of these slopes is evaluated.
Rq is the root mean square of the average slope. Both Ra and Rq parameters are
important to determine the mechanical interlocking property. A surface with higher Ra and
Rq values provides better mechanical interlocking than a surface with lower values. Lr is
the ratio of the actual profile length Lo and the evaluation length L. A surface with high peaks
and deep valleys has a higher Lo and hence a higher Lr value compared to a surface with low
peaks and shallow valleys. Thus more surface area is available for the repair material to
[image:11.595.77.429.561.719.2]adhere at higher Lr values.
Fig. 5. Local slopes along the surface profile.
𝑑𝑧 𝑑𝑥
𝑑𝑧 𝑑𝑥
𝑑𝑧 𝑑𝑥
𝑑𝑧 𝑑𝑥
𝑑𝑧
𝑑𝑥 𝑑𝑧 𝑑𝑥
L
11
The following equations can be used to determine these roughness parameters [26-27]:
Parameter 1: Average absolute slope Ra
𝑹𝐚 =𝟏𝑳∫ |𝟎𝑳 𝒅𝒙𝒅𝒛| 𝒅𝒙 (3)
or in discretised form
𝑹𝐚 =𝟏𝑳∑𝑵𝒏=𝟏|𝒛𝒏+𝟏− 𝒛𝒏| (4)
Parameter 2: Root mean square average slope Rq
𝑹𝒒 = √𝟏𝑳∫ (𝟎𝑳 𝒅𝒛𝒅𝒙)𝟐𝒅𝒙 (5)
or in discretised form
𝑹𝒒 = √𝟏𝑳∑𝑵𝒏=𝟏(𝒛𝒏+𝟏− 𝒛𝒏)𝟐 (6)
Parameter 3: Profile length ratio Lr
𝑳𝒓 =𝑳𝒐𝑳 =𝟏𝑳∫ √𝟏 + (𝟎𝑳 𝒅𝒙𝒅𝒛)𝟐𝒅𝒙 (7)
or in discretised form
𝑳𝒓 =𝑳𝒐𝑳 =𝟏𝑳∑𝑵𝒏=𝟏√(𝑵𝑳)𝟐+ (𝒛𝒏+𝟏− 𝒛𝒏)𝟐 (8)
where Ra is the average absolute slope (rad), Rq is the root mean square average slope
(rad), Lr is the profile length ratio, 𝑑𝑧
𝑑𝑥 is the local slope of the surface profile, Lo is the actual
profile length (mm), and L is the evaluation length along the x axis (mm).
2.6. Surface roughness measuring equipment
An experimental 3D interferometric fringe-based imaging system for surface profiling,
12
characterise the substrate surfaces. The method belongs to a group of non-contact (optical)
techniques known as phase measurement interferometry.
The measuring system consists of a fringe projector, a C-Cam Technologies Model CCi4
digital camera (sensor type: IBIS4 CMOS, total light-sensitive pixels: 1310720 (1280
Horizontal x 1024 Vertical), pixel pitch: 7 x 7 m, frame speed full resolution: approximately
7.5 frames/s, operating temperature: 0 to +50 oC), a control system for the laser diode and a
computer for processing the data. The fringe projector illuminates the surface of the object
under investigation with a set of vertical interference fringes through an illumination cone as
shown in Fig. 6 (a-c). Projected fringes having cosine intensity profiles are used. Next, the pattern of the projected fringes on the surface of the object is analysed to determine the
co-ordinates of points on the surface. The aim of using projected fringes, instead of a scanning
spot or line, is that data for all points in an image plane can be captured simultaneously,
hence reducing the image acquisition time. The fringe projector, object and camera remain
stationary during measurement [28].
The distance between the laser projector and the surface of the object is limited to a
minimum of 0.5 m and a maximum of 5 m due to the sensitivity of the camera and the power
of the projector. The camera distance from the surface of the object is similar to that of the
projector. In the case of the concrete substrate slabs, the camera and the projector were
positioned at a distance of approximately 2 m from their surface. The time required to
measure a single specimen involved the acquisition of only 6 image frames and was done in
approximately 2 s.
Two software modules (data acquisition module and data processing module) are used for
control and data processing purposes. Data acquisition module is responsible for controlling
the camera, image averaging and phase stepping of the fringe projector. Data processing
13
produce the x, y and z co-ordinates of the surface points [28]. The equipment can capture and
analyse a square area of approximately 140 x140 mm on the x-y plane. Both x and y axes are
divided into 251 points, resulting in a spacing length of approximately 0.5 mm, in a very fine
square mesh consisting of 251 lines on both x and y axes and a total of 63001 points. Next,
the z-coordinates of the 63001 points are generated and stored in a matrix form. Once the
image is captured and analysed, a very detailed and accurate 3D topography of the surface is
created using Mathcad software as shown in Fig. 7. This is one of the big advantages of the
above system compared with the Sand Patch method and Contact Stylus profilometers.
Finally, the z axis coordinates of the 63001 points can be processed using computer software
such as Mathcad or Matlab to calculate various 2D roughness parameters on either x or y
axis. The 2D parameters Ra, Rq and Lr,described in Section 2.5 were used to calculate the
surface roughness of the substrate samples. Computer programmes for evaluating each one of
them, along the x axis of the specimens, were written in Matlab.
(a) (b)
(c)
[image:14.595.69.520.433.736.2]14
(a) (b)
Fig. 7. Typical 3D surfaces obtained using (a) an electric hammer and (b) Remote Robotic Hydro-erosion.
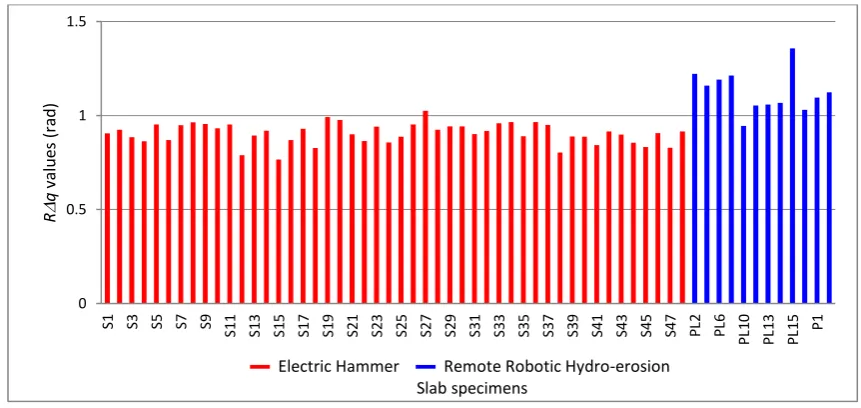
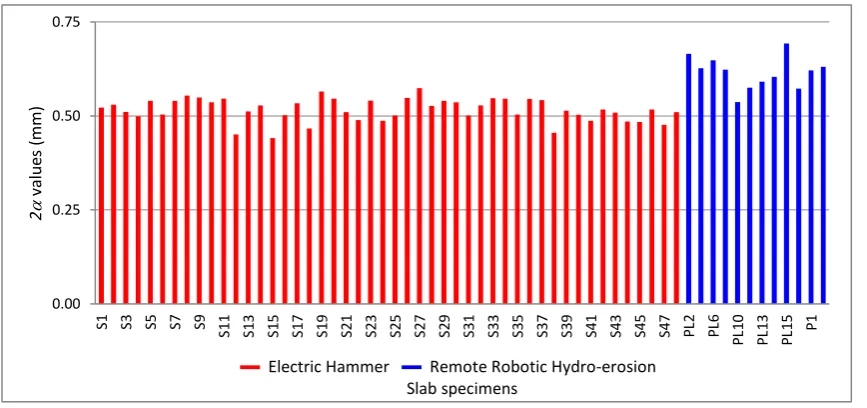
3. Results and discussion
Initially, 3D images of the excavated surface of the 60 slab specimens were created using
the fringe-based laser interferometry equipment. Next, Ra, Rq and Lr roughness
parameters were calculated for every mesh line parallel to the x axis and an average
roughness value based on the results of 251 such lines was obtained for each slab. In addition,
2 roughness parameter proposed by Silfwerbrand [11] was evaluated. The measured values
of all concrete substrate surfaces (produced using either an electric hammer or RRH) are
shown in Figs. 8-11. A summary of all the above results is provided in Table 2. As shown in
Table 2, all four 2D roughness parameters were able to distinguish between surfaces obtained by the two removal methods and confirm that RRH produces rougher surfaces which can
promote bond strength. When Ra parameter was employed, RRH showed an average
increase in surface roughness of 21% along the x axis. RRH showed an average increase of
[image:15.595.76.508.73.290.2]15
an average increase in surface roughness of 10% along the x axis. Finally, when 2 was used,
[image:16.595.71.500.123.329.2]RRH showed an average increase in surface roughness of 19%.
Fig. 8. Ra values (rad) measured along the x axis.
Fig. 9. Rq values (rad) measured along the x axis.
0 0.5 1 1.5
S1 S3 S5 S7 S9 S11 S13 S15 S17 S19 S21 S23 S25 S27 S29 S31 S33 S35 S37 S39 S41 S43 S45 S47 PL2 PL6
P L1 0 P L1 3 P L1 5 P1 R a valu es ( rad )
▬ Electric Hammer ▬ Remote Robotic Hydro-erosion Slab specimens
0 0.5 1 1.5
S1 S3 S5 S7 S9 S11 S13 S15 S17 S19 S21 S23 S25 S27 S29 S31 S33 S35 S37 S39 S41 S43 S45 S47 PL2 PL6
P L1 0 P L1 3 P L1 5 P1 R q valu es ( rad )
[image:16.595.68.499.397.601.2]16
[image:17.595.71.505.338.542.2]Fig. 10. Lr values (-) measured along the x axis.
Fig. 11. 2values (mm) measured along the x axis.
Table 2
Values of Ra, Rq, Lr and 2 roughness parameters of electric hammer and RRH prepared surfaces.
Roughness parameter
Range of values Mean values % increase with RRH
Electric hammer surfaces
RRH surfaces Electric hammer surfaces
RRH surfaces
Ra (rad) 0.79-1.03 0.97-1.28 0.93 1.12 21
Rq (rad) 0.77-1.03 0.95-1.36 0.91 1.13 24
Lr (-) 1.36-1.54 1.49-1.73 1.46 1.61 10
2 (mm) 0.44-0.57 0.54-0.69 0.52 0.62 19
0 0.3 0.6 0.9 1.2 1.5 1.8
S1 S3 S5 S7 S9
S1 1 S1 3 S1 5 S1 7 S1 9 S2 1 S2 3 S2 5 S2 7 S2 9 S3 1 S3 3 S3 5 S3 7 S3 9 S4 1 S4 3 S4 5 S4 7 P
L2 PL6
P L1 0 P L1 3 P L1 5 P1 Lr valu es ( -)
▬ Electric Hammer ▬ Remote Robotic Hydro-erosion Slab specimens
0.00 0.25 0.50 0.75
S1 S3 S5 S7 S9 S11 S13 S15 S17 S19 S21 S23 S25 S27 S29 S31 S33 S35 S37 S39 S41 S43 S45 S47 PL2 PL6
P L1 0 P L1 3 P L1 5 P1 2 valu es ( mm)
[image:17.595.69.529.665.744.2]17
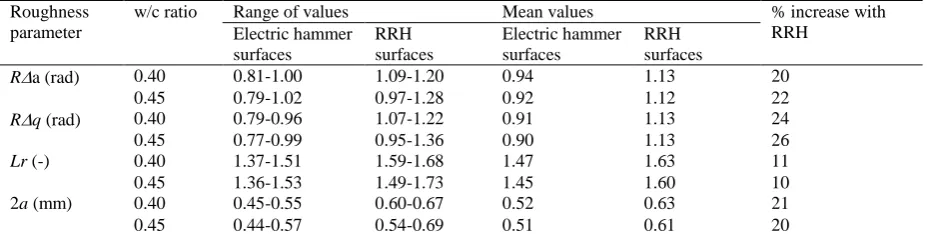
In addition, the effect of substrate compressive strength (w/c ratios of 0.4 and 0.45) on the
percentage increase with RRH was investigated for electric hammer and RRH treated slabs
cast at the same grade. Very similar results were observed for both w/c ratios as shown in
Table 3, indicating no significant effect of w/c ratio on roughness within the range of
[image:18.595.67.531.279.396.2]0.4-0.45.
Table 3
Effect of substrate strength on percentage increase with RRH.
Roughness parameter
w/c ratio Range of values Mean values % increase with
RRH Electric hammer
surfaces
RRH surfaces
Electric hammer surfaces
RRH surfaces
Ra (rad) 0.40 0.81-1.00 1.09-1.20 0.94 1.13 20
0.45 0.79-1.02 0.97-1.28 0.92 1.12 22
Rq (rad) 0.40 0.79-0.96 1.07-1.22 0.91 1.13 24
0.45 0.77-0.99 0.95-1.36 0.90 1.13 26
Lr (-) 0.40 1.37-1.51 1.59-1.68 1.47 1.63 11
0.45 1.36-1.53 1.49-1.73 1.45 1.60 10
2a (mm) 0.40 0.45-0.55 0.60-0.67 0.52 0.63 21
0.45 0.44-0.57 0.54-0.69 0.51 0.61 20
Finally, it should be noted that the level of surface roughness obtained using electric
chipping hammers may be affected by the sharpness and length of the chipping attachment as
well as the level of vibration frequency at which it operates. Hence, by carefully investigating
the above parameters an improvement on roughness values obtained using electric chipping
hammers may be possible.
Ra, Rq, Lr and 2 values for both types of surfaces were also plotted in the form of
histograms to observe their distribution. These are shown in Fig. 12 (a-h) together with the
values for the mean (𝑥̅) standard deviation (SDand coefficient of variation (CV). As
expected, all roughness parameters for both surfaces correspond in general to standard
18
a) 𝑥̅ = 0.93 rad, SD 0.054 rad, CV = 5.81% b) 𝑥̅ = 1.12 rad, SD0.092 rad, CV = 8.24%
c) 𝑥̅ = 0.91 rad, SD0.054 rad, CV = 5.97% d) 𝑥̅ = 1.13 rad, SD0.109 rad, CV = 9.71%
e) 𝑥̅ = 1.46, SD0.040, CV = 2.75% f) 𝑥̅ = 1.61, SD0.065, CV = 4.02%
g) 𝑥̅ = 0.52 mm, SD0.030 mm, CV = 5.76 % h) 𝑥̅ = 0.62 mm, SD0.043 mm, CV = 6.93 %
Fig. 12 (a-h). Histogram plots of Ra, Rq, Lr and 2 for electric hammer and RRH prepared surfaces. 0 1 2 3 4 5 6 7 8 9 10
0.76 0.79 0.82 0.85 0.88 0.91 0.94 0.97 1 1.03 1.06 1.09
F
re
qu
en
cy
Ramean values (rad) for electric hammer treated surfaces
Electric hammer 0 1 2 3 4 5
0.8 0.9 1 1.1 1.2 1.3 1.4
F
re
qu
en
cy
Ramean values (rad) for RRH treated surfaces
RRH 0 1 2 3 4 5 6 7 8 9
0.74 0.79 0.84 0.89 0.94 0.99 1.04
F
re
qu
en
cy
Rq mean values (rad) for electric hammer treated surfaces
Electric hammer 0 1 2 3 4 5
0.8 0.9 1 1.1 1.2 1.3 1.4 1.5
F
re
qu
en
cy
Rq mean values (rad) for RRH treated surfaces
RRH 0 2 4 6 8 10 12
1.34 1.39 1.44 1.49 1.54 1.59
F
re
qu
en
cy
Lr mean values for electric hammer treated surfaces
Electric hammer 0 1 2 3 4 5
1.4 1.5 1.6 1.7 1.8
F
re
qu
en
cy
Lr mean values for RRH treated surfaces
RRH 0 2 4 6 8 10 12 14
0.42 0.45 0.48 0.51 0.54 0.57 0.6
F
re
qu
en
cy
2a mean values (mm) for electric hammer treated surfaces
Electric hammer 0 1 2 3 4 5 6
0.49 0.54 0.59 0.64 0.69 0.74
F
re
qu
en
cy
2a mean values (mm) for RRH treated surfaces
[image:19.595.69.524.69.715.2]19
4. Conclusions
The following conclusions can be drawn from the present laboratory-based investigation on
measuring concrete substrate surface roughness prior to patch repair.
A non-contact fringe-based laser interferometry imaging technique suitable for potential
on-site application can be used to create a very accurate 3D digital profile of a concrete
substrate surface regardless of its orientation (horizontal, vertical or overhead).
2D roughness parameters Ra, Rq, Lr and 2 can be employed to measure the substrate
surface roughness. They confirm the ability of Remote Robotic Hydro-erosion to produce
rougher surfaces than pneumatic chipping hammers and hence improve mechanical
interlocking, which in turn promotes bond strength.
Further work is needed for the proposed method to become fully portable for in-situ
evaluation of concrete substrates. Additional measurements (including the evaluation of
3D roughness parameters) are required for performing comparisons against traditional
methods (sand patch method) and highly advanced 3D laser scanners. Finally, it should be
noted that more advanced digital cameras with higher specifications than the one used in
this study, can provide higher resolution images and hence improve the accuracy of the 3D
reconstructed surface.
Acknowledgements
The author gratefully acknowledges Professor D. Chamberlain for his guidance and support
in conducting the above research. Special thanks go to Professor B. T. Meggitt, Dr. W. Boyle
and J. Couper for providing the fringe-based laser interferometry equipment and assisting
with the measurements. Finally, the author would like to express his gratitude to Professor P.
20
References
[1] A.M. Neville, Properties of Concrete, fifth ed., Harlow, Essex, Pearson Education
Limited, 2011.
[2] S. Mindess, J.F. Young and D. Darwin, Concrete, second ed., Upper Saddle River,
Prentice Hall, 2003.
[3] N.J. Dellate Jr, D.W. Fowler, B.F. McCullough and S.F. Grater, Investigating
performance of bonded concrete overlays, J. Perform. Constr. Facil. 12 (1998) 62-70.
http://dx.doi.org/10.1061/(ASCE)0887-3828(1998)12:2(62).
[4] BS EN 1504-10, Products and Systems for the Protection and Repair of Concrete
Structures-Definitions-Requirements-Quality Control and Evaluation of
Conformity-Part 10: Site Application of Products and Systems and Quality Control of the Works.
British Standards Institution, London (UK), 2003.
[5] BS EN 1766, Products and Systems for the Protection and Repair of Concrete
Structures-Test Methods-Reference Concretes for Testing. British Standards
Institution, London (UK), 2000.
[6] BS EN ISO 3274, Geometric Product Specifications (GPS)-Surface Texture: Profile
Method-Nominal Characteristics of Contact (Stylus) Instruments. British Standards
Institution, London (UK), 1998.
[7] BS EN ISO 4288, Geometric Product Specification (GPS)-Surface Texture-Profile
Method: Rules and Procedures for the Assessment of Surface Texture. British
Standards Institution, London (UK), 1998.
[8] F.B. Holt and G.R. Musgrove, Surface Texture Classification: A Guide to Pavement
Skid Resistance. Special Publication, ASTM International, West Conshohocken
21
[9] ICRI Technical guideline No. 03732, Selecting and Specifying Concrete Surface
Preparation for Sealers, Coating and Polymer Overlays. International Concrete Repair
Institute, Rosemont, Illinois (USA), 1997.
[10] ASTM D 7682, Standard Test Method for Replication and Measurement of Concrete
Surface Profiles Using Replica Putty, ASTM International, West Conshohocken,
(Pennsylvania State, USA), 2012.
[11] J. Silfwerbrand, Bonding between old and new concrete in structures loaded by static
and time-dependent load, In: Proceedings of the International Conference on
Adhesion Between Polymers and Concrete. France, 1986.
[12] A.I. Abu-Tair, D. Lavery, A. Nadjay, S.R. Rigden and T.M.A. Ahmed, A new method
for evaluating the surface roughness of concrete cut for repair or strengthening,
Constr. Build. Mater. 14, 2000, 171-176.
http://dx.doi.org/10.1016/s0950-0618(00)00016-7.
[13] N.H. Maertz, A. Nanni, J.J. Mayers and G. Galecki, Laser profilometry for concrete
substrate characterization prior to FRP laminate application, Concr Repair Bull 1,
2001, 4-8.
[14] M.F.M. Ahmed and C.T. Haas, The potential of low cost close range photogrammetry
towards unified automatic pavement distress surveying, In: Proceedings of the 89th
annual meeting of the transportation research board, Washington, DC, January 2010.
[15] P.M.D. Santos and E.N.B.S. Julio, A state-of-the-art review on roughness
quantification methods for concrete surfaces, Constr. Build. Mater. 38, 2013, 912-923.
http://dx.doi.org/10.1016/j.conbuildmat.2012.09.045.
[16] J. Hola, L. Sadowski, J. Reiner and M. Stankiewicz, Concrete surface roughness
22
Safety/Defektoskopie, Sec u Chrudimi, Czech Republic, 30 October-1 November
2012, 101-106.
[17] G. Bitelli, A. Simone, F. Giraldi and C. Lantieri, Laser scanning on road pavements:
A new approach for characterising surface texture, Sensors 12, 2012, 9110-9128.
http://dx.doi.org/10.3390/s120709110.
[18] S. Warner, I. Neumann, K.C. Thienel and O. Heunecke, A fractal-based approach for
the determination of concrete surfaces using laser scanning techniques: a comparison
of two different measuring systems, Mater. Struct. 46(1-2), 2013, 245-254.
http://dx.doi.org/10.1617/s11527-012-9898-y.
[19] L. Sadowski, Application of three-dimensional optical laser triangulation method for
concrete surface morphology measurement, Indian J. Eng. Mater. Sci. 21, 2014,
692-700.
[20] J. Hola, L. Sadowski, J. Reiner and S. Stach, Usefulness of 3D surface roughness
parameters for nondestructive evaluation of pull-off adhesion of concrete layers,
Constr. Build. Mater. 84, 2015, 111-120.
http://dx.doi.org/10.1016/j.conbuildmat.2015.03.014.
[21] BS EN 197-1, Cement-Part 1: Composition, Specifications and Conformity Criteria
for Common Cements, British Standards Institution, London (UK), 2000.
[22] Design of normal concrete mixes, Garston: Building Research Establishment, second
ed., 1998.
[23] D. Chamberlain, A robotics approach to preparing surfaces for repair, Concr. 37,
2003, 22-23.
[24] D. Chamberlain, E. Gambao, S. McCormac, M.A. Garcia, T. McCulloch, C.A. Alves
23
preparation. In: Proceedings of the 16th International Symposium on Automation and
Robotics in Construction. Spain, 1999.
[25] E.S. Gadelmawla, M.M. Koura, T.M.A. Maksoud, I.M. Elewa and H.H. Soliman,
Roughness parameters, J. Mat. Process. Technol. 123, 2002, 133-145.
http://dx.doi.org/10.1016/s0924-0136(02)00060-2.
[26] B. Griffiths, Manufacturing Surface Technology, first ed., Penton Press, London,
2001.
[27] A.K. Bewoor and V.A. Kulkarni, Metrology and Measurement, first ed.,
McGraw-Hill, New Delhi, 2009.
[28] B.T. Meggitt, A new self-calibrating 3D interferometric fringe-based imaging system
for profiling, positioning and control in space use. European Space Agency Final