University of Windsor University of Windsor
Scholarship at UWindsor
Scholarship at UWindsor
Electronic Theses and Dissertations Theses, Dissertations, and Major Papers
1-1-2006
A semantic partition based text mining model for document
A semantic partition based text mining model for document
classification.
classification.
Catherine Inibhunu University of Windsor
Follow this and additional works at: https://scholar.uwindsor.ca/etd
Recommended Citation Recommended Citation
Inibhunu, Catherine, "A semantic partition based text mining model for document classification." (2006). Electronic Theses and Dissertations. 7101.
https://scholar.uwindsor.ca/etd/7101
A Semantic Partition Based Text Mining Model
for Document Classification
by
Catherine Inibhunu
A Thesis
Submitted to the Faculty o f Graduate Studies and Research through Computer Science in Partial Fulfillment o f the Requirements
for the Degree o f Master o f Science at the University o f Windsor
Windsor, Ontario, Canada 2006
Library and Archives Canada
Bibliotheque et Archives Canada
Published Heritage Branch
395 W ellington Street Ottawa ON K1A 0N4 Canada
Your file Votre reference ISBN: 978-0-494-35962-4 Our file Notre reference ISBN: 978-0-494-35962-4
Direction du
Patrimoine de I'edition
395, rue W ellington Ottawa ON K1A 0N4 Canada
NOTICE:
The author has granted a non exclusive license allowing Library and Archives Canada to reproduce, publish, archive, preserve, conserve, communicate to the public by
telecommunication or on the Internet, loan, distribute and sell theses
worldwide, for commercial or non commercial purposes, in microform, paper, electronic and/or any other formats.
AVIS:
L'auteur a accorde une licence non exclusive permettant a la Bibliotheque et Archives Canada de reproduire, publier, archiver,
sauvegarder, conserver, transmettre au public par telecommunication ou par I'lnternet, preter, distribuer et vendre des theses partout dans le monde, a des fins commerciales ou autres, sur support microforme, papier, electronique et/ou autres formats.
The author retains copyright ownership and moral rights in this thesis. Neither the thesis nor substantial extracts from it may be printed or otherwise reproduced without the author's permission.
L'auteur conserve la propriete du droit d'auteur et des droits moraux qui protege cette these. Ni la these ni des extraits substantiels de celle-ci ne doivent etre imprimes ou autrement reproduits sans son autorisation.
In compliance with the Canadian Privacy Act some supporting forms may have been removed from this thesis.
While these forms may be included in the document page count,
their removal does not represent any loss of content from the thesis.
Conformement a la loi canadienne sur la protection de la vie privee, quelques formulaires secondaires ont ete enleves de cette these.
Abstract
Feature Extraction is a mechanism used to extract key phrases from any given text
documents. This extraction can be weighted, ranked or semantic based. Weighted and
Ranking based feature extraction normally assigns scores to extracted words based on
various heuristics. Highest scoring words are seen as important. Semantic based
extractions normally try to understand word meanings, and words with higher orientation
based on a document context are picked as key features. Weighted and Ranking based
feature extraction approaches are used for creating document summaries that can act as
their representations in the absence of the original documents. However, these two
approaches suffer from some major drawbacks: (1) summaries generated could contain
words that seem irrelevant to the document context, (2) sentences containing some key
words could be eliminated if ranked lower than a given threshold, (3) summaries must be
processed further in order to serve as input for mining algorithms like the Apriori.
This thesis proposes Semantic Partitions (SEM-P) and Enhanced Semantic Partitions
(ESEM-P) algorithms based on the semantic orientation of words in a document. This
partitioning reduces the amount of words required to represent each document as input
for discovering word frequent patterns from a collection of documents, while still
maintaining the semantics of the documents. A weighting and ranking heuristic measure
for each word term in a partition is used in ESEM-P to prune low ranked terms resulting
in improved performance of the ESEM-P over the SEM-P. Identified word frequent
patterns are used to generate a document classification model.
Keywords: Text mining, text information mining, unstructured data mining, feature
extraction, semantic orientation, text classification, semantic partitions, text
Acknowledgement
I would like to give thanks to my Supervisor Dr. Christie Ezeife for her guidance through
out my entire studies at the University of Windsor both Undergraduate and Graduate
studies. Dr. Ezeife gave me advice on numerous issues, including the courses to take, she
got me interested in research and gave me an excellent research direction. Dr. Ezeife has
carefully reviewed all my reports and given me suggestions on how to make
improvements. I truly admire her dedication to teaching and care for students. She always
wants the best from her students and is always available to lend any help with or without
appointments. Thank you Dr. Ezeife for being such a good person and professor, totally
dedicated to students welfare and academic success.
I would like to thank my entire thesis committee members. I thank my external reader,
Dr. Zhiguo Hu for teaching me Mathematics, thanks to my internal reader, Dr. Arunita
Jaekel for accepting to read my bulky thesis within a very short notice due to
replacement. I also thank the thesis chair, Dr. Jessica Chen, for teaching me Software
Engineering and being part of my thesis committee. Special thanks to the entire
committee for taking their valuable time to review my thesis and provide valuable
suggestions.
I am infinitely grateful to my family, my wonderful husband and our lovely children who
have given me unconditional love and care through out my studies. I also give special
thanks to my parents for installing excellence as a virtue early in my childhood. I finally
want to thank the staff at the School of Computer Science and members of the WODD
Table of Contents
Abstract... iii
Acknowledgement... iv
Table o f Contents... v
List o f Tables... vii
List o f Figures...ix
Chapter 1: INTRODUCTION...1
1.2 Text Information Mining... 2
1.2.1 Information Retrieval... 2
1.2.2 Text Extraction... 3
1.2.3 Text Summarization... 4
1.2.4 Text Classification...5
1.2.5 Text Clustering... 7
1.2.6 Association Rules... 10
1.3 The Motivation o f Thesis... 12
1.4 The Thesis Contribution... 15
1.5 Outline o f the Thesis... 16
Chapter 2: RELATED WORKS... 17
2.1 Feature Extraction Algorithms...17
2.1.1 Cue Markers...17
2.1.2 ClearStudio... 20
2.1.3 Rapier and DiscoTex Methods... 21
2.1.4 Multi-Strategy Approach... 23
2.2 Ranking and Weighting Mechanisms... 25
2.2.1 Summarization with Relevance Measure... 25
2.2.1.1 Relevance Measure... 26
2.2.1.2 Singular Value Decomposition...27
2.2.2 Summarization as Feature Selection for Text Categorization... 29
2.2.3 Sentence-Selection Heuristic...30
2.3 Lexical A nalysis... 33
2.3.1 Efficient Text Summarization with Lexical Chains...33
2.3.2 Text Summarization with Lexical Chains... 35
2.4 Association Rule Approach...37
2.4.1 Multi-pass Apriori (M-Apriori) and Multi-pass-Direct Hashing and Pruning (M-DHP). ... 38
2.4.2 Associating Terms with Text Categories... 42
2.4.3 Discovering Technological Intelligence... 44
Chapter 3: PROPOSED ALGORITHMS FOR TEXT INFORMATION MINING... 45
3.1 Description o f Semantic Partition (SEM -P)... 49
3.1.1 Semantic-Partition Algorithm (SEM-P)... 49
3.2.1 Enhanced Semantic-Partitions Algorithm (ESEM-P)... 69
Chapter 4: PERFORMANCE ANALYSIS... 70
4.1 Implementation Environments... 70
4.2 Performance Measures with Existing Text Collections...70
4.3 Experiments on Memoiy Usage and Text Preprocessing Time...72
4.4 Experiments on Building Classification M odels...74
4.5 Analysis o f Experimental Results...75
4.5.1 Suggestions to Improve the Preprocessing Time o f Both the SEMP and E S E M P 76 Chapter 5: CONCLUSIONS AND FUTURE WORK...77
Bibliography...79
List of Tables
Table 1.1: Highly occurring Terms in Figure 1.2.2 and Figure 1.2.5... 8
Table 1.1.2: Matrix Representation o f Sentences and Clusters Cxand C 2 ...9
Table 1.1.3: The first Distance Calculation (D0) Generating ( C0)... 9
Table 1.1.4: The Second Distance Calculation (D x) Generating (Cx)... 10
Table 1.2: A Structured Database with Unique Transaction Ids... 10
Table 1.3: Transaction representations o f text segments in Fig 1.2.2 and Fig 1.2.5...11
Table 1.4.1: Itemsets generating C ,...12
Table 1.4.2: Itemsets with Minimum Support... 12
Table 1.4.3: C, generated from Lx ...12
Table 1.4.4: Generating Z 2fromC2 ...12
Table 2.1.1: Vocabulary list o f terms from Scientific Paper in Fig 2.1.4... 24
Table 2.1.2: A Frequency Count o f Terms from G x and G 2 from Table 2.1.1... 24
Table 2.2.1: Individual Text Sentences...27
Table 2.2.1.2: A 2 x 4 Sample Matrix Representation (Matrix A )... 28
Table 2.2.1.3: Transpose o f Matrix A ... 28
Table 2.2.2: Breakdown o f Text Segment in Figure 2 .2 .1 ... 31
Table 2.2.3: Term Representation in Table 2 .2 .2 ... 31
Table 2.4.1: A Sample Transaction Data Set... 39
Table 2.4.2: Candidate 1 Itemset, Cx ...39
Table 2.4.3: Frequent 1 Itemset, Lx... 39
Table 2.4.4: Candidate 2 Itemset, C 2 ... 40
Table 2.4.5: Frequent 2 Itemsets, Lx... 40
Table 2.5: A HashTable Representation o f Candidate 2 Itemsets... 41
Table 3.1.1: A Ranking o f Semantic Partitions from Figure 3.1.4... 56
Table 3.1.2: Groups Formed from Ranked Semantic Partitions... 57
Table 3.1.3: Candidate 1 itemset, C , ... 61
Table 3.1.4 Frequent 1 itemset, Lx... 61
Table 3.1.5: Candidate 2 itemset, C 2 ... 62
Table 3.1.7: Candidate 3 Itemset, C 3 ... 62
Table 3.1.8: A HashMap Binary Identifier for the Concept Hierarchy in Figure 3.1.4.2...65
Table 3.1.9: The Identified Semantic Partitions for Document D 6... 66
Table 3.1.10: An Updated HashMap after Adding Document D6...67
Table 3.1.11: A result o f Pruning the Contents o f Figure 3 .1 .5 ... 68
Table 4.3.1: Amount o f Disc Space Before and After Processing Text... 72
Table 4.3.2: Execution Time to PreProcess Text Documents...72
List of Figures
Figure 1.2.1: An Information Retrieval Procedure...3
Figure 1.2.2: Sample Paragraph in a Text Document... 4
Figure 1.2.2.1: Final Extracted Words from Text Document in Figure 1.2.2...4
Figurel.2.3: Final summary o f Text Segment in Figure 1.2.2...5
Figure 1.2.4: A Sample Term Matrix... 7
Figure 1.2.5: A Sample Text Document to be Clustered...8
Figure 2.1.1: A Text Segment Adapted from (Chuang and Yang, 2000)... 18
Figure 2.1.2: Decomposition o f Sentences in Figure 2.1.1 into Individual Segments...19
Figure 2.1.3: Sample Extraction Rule in Rapier Adopted from (Califf and Mooney, 2003)...22
Figure 2.1.4: A Scientific paper Adapted from (Castillo and Serrano, 2004)... 23
Figure 2.2.1: A Paragraph o f a Text Document...26
Figure 2.3.1: Lexical Centroids Adapted from (Salton et. al, 1996)...34
Figure 3.1: A Collection o f 5 Documents {D l, D2, D3, D4, D 5 }...47
Figure 3.1.1: Overall process o f text information mining... 48
Figure 3.1.2 The Semantic Partition Algorithm, (SEM P ) ...49
Figure 3.1.3: Feature Extraction Algorithm... 50
Figure 3.1.3.1: Documents D l to D5 after Feature Extraction...51
Figure 3.1.3.2: The Generate Semantic Partition Algorithm... 54
Figure 3.1.4: Semantic Partitions on words in Documents D l, D2, D3, D4 and D 5 ... 55
Figure 3.1.4.1: Ranking Semantic Partition Algorithm...56
Figure 3.1.4.2: Representation o f Group 1 from Table 3 .1 .2 ...58
Figure 3.1.4.2a: The Merging Partition Algorithm... 58
Figure 3.1,4.2b: The Merging Partition Algorithm... 60
Figure 3.1.5: A Concept Hierarchy for Frequent 1 items, Lx...63
Figure 3.1.5.1: The algorithm to Generate Concept Hierarchies... 64
Figure 3.1.5.2: The algorithm for Generating HashMap Identifier... 65
Figure 3.1.6: Document D6 to be classified... 66
Figure 3.1.7: Enhanced Semantic-Partitions Algorithm (ESEM-P)...69
Figure 4.2: Overall process in the experiments...71
Figure 4.3.1: Memory Reduction after Preprocessing T ext... 73
Figure 4.3.2: Comparison on Text Document Preprocessing Times...73
Chapter 1: INTRODUCTION
The world has accepted computers as the best means for storing information. This is due
to the fact that it is very easy to save data, it is convenient, any one with access to a
computer can do it, and most importantly, information stored can be shared among many
users, or transferred to other locations. However, as more text documents are stored in
large databases, it becomes a huge challenge to understand hidden patterns or
relationships between the stored documents. Since text data are not in numerical format,
they cannot be analyzed with statistical methods.
Various mechanisms have been proposed for analyzing textual data. These include,
clustering algorithms that classify documents into a constant number (k) of distinct
clusters (Krishna and Krishnapuram, 2001). This becomes a problem when the text
documents themselves do not fit into these k clusters. Categorization is another approach
that has been used (Bekkerman and Allan, 2003), where predefined classes are given. A
scan performed on source documents assigns each document to the class that best
represents it. This approach fits only domain-specific environments, thus documents that
do not have predefined categories are not analyzed.
Probabilistic models assign various weights to different words in a document (Meir and
Zhang, 2003), but some core key words with low occurrence or frequency end up getting
the lowest probabilistic measure leading to poor analysis. Association rules have also
been used in creating text summaries. However, the algorithms used are based on the
traditional Apriori-like structure that normally performs recursive scans on the entire
database to get frequent items. This was proved to be slow and inefficient in (Zaiane and
1.2 Text Information Mining
Text mining is the discovery of not yet known information from different written sources,
i.e. text documents. The goal is to be able to link together related documents based on
their context. Text mining is different from classic data mining in that natural language
text like, letters, journals, books and emails are the initial texts to be mined. These texts
have to undergo some preprocessing stages before the actual mining procedure is done,
(Hearst, 1997).
Why Text Mining
Researchers for decades have been concentrating on discovering knowledge from
structured datasets, however, much of business and government data are stored in textual
format and there is a growing need to understand this data. Various mechanisms have
been used for mining knowledge from text including, Information retrieval (Salton et al.,
1996, Stairmand, 1997, Eiron and McCurley, 2003). Information extraction (Turney,
2002, Chuang and Yang, 2000, Kotcz et al., 2001, Yonatan et al., 2001, McDonald and
Chen, 2002, Mooney and Bunescu, 2005). Text clustering (Baker and McCallum, 1998,
Nomoto and Matsumoto, 2001, Han et al., 2003, Zhai et al., 2004). Text summarization
(Hahn and Mani, 2000, Gong and Liu, 2001, Hu and Liu, 2004, Okumura et al.,2004, Mei
and Zhai, 2005). Text Classification (Huang et al., 2004, Castillo and Serrano, 2004), and
Association Mining (Holt and Chung, 1999, 2005, Lin and Pantel, 2001, Nahm and
Mooney, 2002, Zaiane and Antonie, 2002, Sakurai and Suyama, 2004).
1.2.1 Information Retrieval
Having a collection of documents, one would like to find documents related to a certain
topic. A query is normally submitted to the database and the documents that are evaluated
as having some relevance to the submitted query are retrieved, (Eiron and McCurley,
2003). These retrieved documents are normally indexed with a relevance measure where
the highest ranked documents are displayed first. An example of such an information
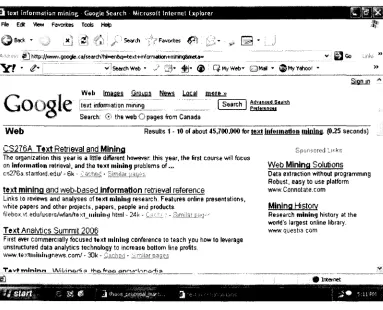
Figure 1.2.1 shows an information retrieval sample after the query “Text information
mining” is given as the search key. Documents online that contain any of the terms in the
search key are retrieved.
te x t in fo rm a tio n m in in g Google S e a rc h M icrosoft I n te rn e t E xplorer Rte Ed* View Favorites Tods Help
| y g | Back !* f! ■< ' Search V Favorites ; *
viS earthW eb * crt* J g * ® Q w y W e b ’ Q f r M * $ My Yahoo) H
-g
| 6 0sign in
W e b R esu lts 1 -10 of about 45.700.000 for te x t Inform ation m in in g , (0.25 seco n d s)
CS276A T ext Retrieval and Minina
The organization this y ear is a little different However this year, th e first co u rse will focus on Inform ation retrieval, and th e te x t m in in g problem s o f .,,
cs2 7 8 a. s1anfoni.edu/ - 6k - £a£ tm £ *
text m ining and w eb-based Information retrieval reference
Links to reviews and an a ly s e s of te x t m in in g researc h . F eatu re* online presen tatio n s, white p ap e rs and other projects, p ap e rs, people and products.
fileb o * ,v t.ed u fu so rs/w fan /t» x tjn in in .j html 24k
-Text Analytics Summit 2006
First ever com m ercially fo cu sed te x t m in in g conference to te a c h you h o w to leverage unstructured d a ta an aly tics technology to in c rease bottom line profits.
w w w .textm iningrsew s.com / - 30k - C ash s, .
n s o re d I W eb Minina Solutions
D ata extraction without programming R obust, e a s y to u s e platform w ww.Connotate.com
Minina Histotv
R esearch m in in g history at th e world’s largest online library. w ww .quesha com
16 0 Internet
S tS ft* -■ ^ Jl
Figure 1.2.1: An Information Retrieval Procedure.
1.2.2 Text Extraction
This is the process of identifying specific pieces of data from text documents then
extracting it, (Mooney and Bunescu, 2005). This is also referred to as information
extraction. One type of information extraction is the named entity recognition described
in (Patman and Thompson, 2003) and (Bikel et. al., 1999, Bunescu et al., 2005) where
references to particular objects such as names, companies, locations from texts are
Several predefined patterns are involved in information extraction, (Sukhahuta and
Smith, 2001), these patterns are seen as triggers. That is, if certain terms are found in text,
then they trigger an extraction pattern. Sample trigger terms described in (Riloff, 1999)
include: “is a”, “with”, “by”, “o f ’, etc. Now a trigger pattern looks like this; <Subject> is
a <subject>, <Subject> by < Subject>, or <Subject> with <Subject> each of the subjects
are terms extracted from text, due to the presence of a trigger term.
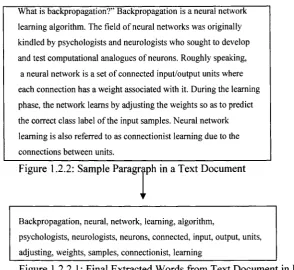
For example, using the text segment in Figure 1.2.2, suppose the above three patterns are
used for text extraction, then the words in Figure 1.2.2.1 are identified as subjects and
extracted. These terms are then analyzed depending on users’ needs.
What is backpropagation?” Backpropagation is a neural network
learning algorithm. The field o f neural networks was originally
kindled by psych ologists and neurologists w ho sought to develop
and test computational analogues o f neurons. Roughly speaking,
a neural network is a set o f connected input/output units where
each connection has a w eight associated with it. During the learning
phase, the network learns by adjusting the w eights so as to predict
the correct class label o f the input sam ples. Neural network
learning is also referred to as connectionist learning due to the
connections betw een units.
Figure 1.2.2: Sample Paragraph in a Text Document
Backpropagation, neural, network, learning, algorithm,
psychologists, neurologists, neurons, connected, input, output, units,
adjusting, weights, sam ples, connectionist, learning
Figure 1.2.2.1: Final Extracted Words from Text Document in Figure 1.2.2
1.2.3 Text Summarization
Summarization is the process of obtaining the most important information of a document,
(Sengupta et al., 2004). This obtained information is much smaller in content than the
original document and therefore referred to as a document summary. There are two
techniques used in summarization. The first method is extraction based approach as
used to create a summary. The second method uses abstraction (Hu and Liu, 2004), some
of the contents used in creating the summary do not come from the original document
instead, they are selected from predefined sets of vocabulary that act as summary
enhancements.
First documents are identified with a certain predefined set of known document types,
(Brandow et al, 1995), this includes, {headlines, outlines, minutes, biography,
chronologies etc}. Given the genre of the document, key sentences are identified.
Using the summarization described in (Kupiec et al., 1995), the text segment in Fig 1.2.2
is summarized as follows;
Sentence lengths are identified, the sentences with a length greater than five is seen as
potential for inclusion in a summary. There are 5 sentences; S = {SI, S2, S3, S4, S5} in
Figure 1.2.2, each having the following recorded lengths |S1| = 7, |S2| = 13, |S3| = 12, |S4|
= 13, |S5| = 9. The top ranking sentences are then selected from the set S, S’ = {S2, S3,
S4}. Using the discourse marker in (Marcu, 1999) further discussed in section 2, S3, and
S4 are further evaluated. The character is seen as a sentence divider and one part of
the sentence is seen as a nucleus and the other part is a satellite (Marcu, 1999). The final
summary will contain parts of S3 and S4 as seen in Figure 1.2.3.
A neural network is a set o f connected input/output units where
each connection has a w eight associated to it. The network
learns by adjusting the w eights so as to be able to predict the
correct class label o f input samples.
Figurel.2.3: Final summary o f Text Segment in Figure 1.2.2.
1.2.4 Text Classification
Given predefined classes, classification is the process of assigning appropriate classes to
subsets of a database also called supervised learning, (Huang et al., 2004). A
classification model is normally generated using parts (samples) of a database; this is
database are classified using the training set; this portion is normally referred to as testing
set. The accuracy of the classification model depends on how well the testing data is
classified using the generated classification model.
Various methods are used in developing classification models and these include decision
trees described by (Chickering et al., 1997), Naives Bayesian in (Good, 1965, Calvo et
al., 2004), distance based algorithms such as Support Vector Machines (SVMs) in
(Vapnik, 1995).
Text Classification with Naive Bayesian Theory, (Calvo et al., 2004).
Let there be a set C of predefined classes, C = {C ,, C2, C3}, and each C, is composed of
predefined set of terms , C, = {t] ,t2 tm}, where m is the number of terms in each C ,.
Given a document d, d is to be classified as either in C,, C2 or C3 using posterior
probabilitity, Pr( dt \ c,). This is the probability that a document di and a class ci occur
together. This is calculated as; Pr( ci \dt ) = p( d{ \ cl )p( c,) / p(d) where c, is a class and
<7, is the document. If d is taken to be the text paragraph in Figure 1.2.2, and C, =
{neural}, C2 = {networks}, and C3 = {computing}, then classification is carried out as
follows.
First preprocessing is done by removing stop words where common words such as {the,
an, a, an, of, was, by etc.,} are eliminated. The remaining list of words together with their
frequency count is; {backpropagation 2, neural/neurons 4, networks 4, learning 3,
algorithm 1, field 1, originally 1, kindled 1 ... ,weights 1}. Total number of words
remaining in d is taken as 55. The number of times d contains any of the terms in the
three predefined classes is recorded as follows;
P( w, | neural) = p(neural | wj) p(neural) / p( wj)
= (3/55) (50/100) = 0.0273
= (4/55) (50/100) = .0364
P( w, | computing) = p(computing | w,) p(computing) / p( wi )
= 0(.5) = 0
P(computing), p(neural) and p(networks) are prior probabilities estimated from a training
set, in this example 50% prior probability is used. The document is assigned to category
C, and C2 as their posterior probability is greater than zero.
1.2.5 Text Clustering
Clustering is the process of grouping objects into classes with similar components (Zhang
et al., 2002, Han et al., 2003). A collection of data objects that are similar is called a
cluster. In machine learning clustering is referred to as unsupervised learning; there are
no predefined classes or training labels used. More often, clustering is known as learning
by observation (Krishna and Krishnapuram, 2001).
In Text Information Mining, documents are represented as a data matrix such that if there
are n number of documents to be clustered, and each is represented by m terms, an m x n
matrix is created. Figure 1.2.4. shows a representation of n documents with m terms each.
{m terms}
{n documents}
Figure 1.2.4: A Sample Term Matrix
The most common method for data clustering is the k-means clustering (Nomoto and
Masumoto, 2001), k represents the number of clusters to be generated after the clustering
N eural netw orks involve long training tim es and are therefore m ore
suitable for applications where this is feasible. They require
a num ber o f param eters for applications where this is feasible. They
require a num ber o f param eters that are typically best determined
em pirically, such as the network topology or “structure.” Neural
networks have been criticized for their poor interpretability, since
it is difficult for hum ans to interpret the symbolic m eaning
behind the learned weights. These features initially m ade neural
networks less desirable for data mining. Advantages o f neural
networks, however, include their high tolerance to noisy data as
well as their ability to classify patterns on which they have not
been trained. In addition, several algorithm s have recently been
developed for the extraction o f rules from trained neural networks.
These factors contribute tow ards the usefulness o f neural networks
for classification in data mining.
Figure 1.2.5: A Sample Text Document to be Clustered
Suppose a data set has 3 dimensions and the cluster has 2 points x, y and a centroid z;
x = ( xx, x2, x3) , y = ( y x, y 2, y 3) m d z = ( z x, z 2, z 3). z, = (x, + y x)/2, z2 = ( x 2 + y 2)/2, z3 =
(x3 + y3 )/2. The cluster centroid is randomly selected, each point in the matrix is assigned
to the nearest cluster center and then a new centroid for each cluster is recalculated using
the new cluster member values. For example, using Figure 1.2.2 and Figure 1.2.5 as two
text documents, the frequencies of the highly occurring words in both documents are
recorded in Table 1.1, (Krishna and Krishnapuram, 2001).
Terms Frequency
Neurons 7
Networks 5
Learning 3
Backpropagation 2
Algorithm 1
Table 1.1: Highly occurring Terms in Figure 1.2.2 and Figure 1.2.5
These words are picked to represent each document in a frequency matrix [2 x 5 ],
Document 1 (fi?,) = 5 4 3 2 1 and Document2 ( d 2) = 6 6 0 3 2, using Euclidean distance
suppose one wants to cluster the docum ent in tw o clusters, C ,, and C2, random num bers are
p ick ed to represent the centroids for both Ci and C2, as sh ow n b elow ;
x , X J
c,
c2
_ 5 6 — " 3 1_
4 6 3 1
3 0 3 1
2 3 3 1
1 2 3 1
Table 1.1.2: Matrix Representation o f Sentences and Clusters C, and C2.
Then the distances betw een the colum ns in Table 1.1.2 is calculated as follow s;
d ( X l, Cl) = ( 5 - 3 ) 2 + ( 4 - 3 ) 2 + ( 3 - 3 ) 2 + ( 2 - 3 ) 2 + ( l - 3 ) 2 = 7 4 + 1 + 0 + 1 + 4 = VlO
d ( X l,C2) = ( 6 - 3 ) 2 + ( 6 - 3 ) 2 + ( 0 - 3 ) 2 + ( 3 - 3 ) 2 + ( 2 - 3 ) 2 = 79 + 9 + 9 + 1 + 1 = 728
d ( X j , C 1) = (5 - 1)2 + (4 - 1)2 + (3 - 1)2 + (2 - 1)2 + (1 - 1)2 = 716 + 9 + 4 + 1 + 10 =
d ( X j , C 2) = (6 - l ) 2 + ( 6 - l ) 2 + ( 0 - l ) 2 + ( 3 - l ) 2 + (2 - 1)2 = 725 + 25 + 1 + 4 + 1 = 756
D i represents the ith iteration in distance measure between a data set and a cluster
centroid w h ile C, represents the clustering allocated for the ith iteration. For exam ple,
D0 in Table 1.1.3 show s the first calculation o f differences in distances betw een colum ns
in Table 1.1.2. C0 represents the first clusters assigned to the documents.
A =
7
10 7 2 8 = 3.16 5.29c 0=
l l = group 17
307
56 5.48 7.48 0 0 = group 2Table 1.1.3: The first Distance Calculation ( Dn) Generating ( C0)
Based on the minimum distance, only one cluster is assigned to both documents.
Recalculating the new centroid in each group is then done, in this case the centroid at
group 2 remains unchanged at (1, 1, 1, 1, l)as no objects are assigned to it, but the new
centroid for group 1 has changed as follows; C2 = ((5+6)/2, (4+6)/2, (3+0)/2, (2+3)/2,
(l+2)/2) = (11/2, 10/2, 3/2, 5/2, 3/2). Now after recomputing the centroids, the
A = 7.0171 6.325 c , = 0 1 = group 1
5.48 7.48 1 ° _ = group 2
Table 1.1.4: The Second Distance Calculation (D l) Generating (C l)
New centroid for group I is recomputed, this re-computation of cluster centroid continues
until each group member remains unchanged.
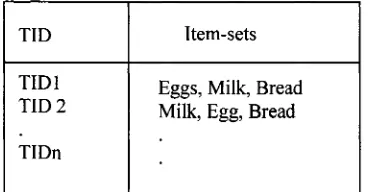
1.2.6 Association Rules
Association rules have been used extensively in data mining research where transactions
are stored in a structured database, see Table 1.2. Associations among these different
transactions are discovered through association algorithms which are based on the
original Apriori (Agrawal and Srikant, 1994) and frequent pattern trees in (Han et al.,
2000). Rules of the form x -> y are generated where both x and y are subsets of the
database but x ^ y .
TID Item -sets
TID1 E ggs, M ilk, Bread T ID 2 M ilk, E gg, Bread
TID n
Table 1.2: A Structured Database with Unique Transaction Ids.
Extracting the commonly occurring itemsets in the different transactions normally
generates association rules. For example, if several transactions contain milk, bread and
eggs, then a rule of the form {milk,bread} -> {eggs} can be generated. This is some kind
of market basket analysis where a prediction can be made that whenever a customer
purchases milk and bread, then there is a high possibility that they will also buy eggs. In
marketing analysis, keeping the three items closer in a grocery store could increase sales.
In text information mining the same relations can be identified from different documents,
stop words and stemming, normally the porters stemming algorithm described in
(Rijsbergen et.al, 1980) is used to remove suffixes of related words and having a single
word as the representation. For example, having a set of words S, S = {consider,
considerably, considered}, all the words in S share the same prefix “consider”. The
stemming algorithm identifies suffixes of the form {ably, ered, ies, ation etc.}. When
stemming is applied to S, all these suffixes are removed and one word is left to represent
the entire set S.
A document Dx with n sets of words is represented as a transaction. Z), = {w,, w2,.. wn}.
The words w, to wn are the itemsets in the transaction. Just like in a market transaction,
the document is represented with a unique ID.
For example, using the text extraction patterns described in section 1.2.2, if three terms
are selected to represent each of the text segments in Fig 1.2.2 and Fig 1.2.5; dl and d2
respectively, then dx = {neural, networks, learning} d2 = {networks, topology, neural}.
This forms the transaction table in Table 1.3.
D ocum ent ID Item set 1 Item set2 Item set3
D l N eural N etw ork Learning
D 2 N etw ork T o p o lo g y N eural
Table 1.3: Transaction representations o f text segments in Fig 1.2.2 and Fig 1.2.5
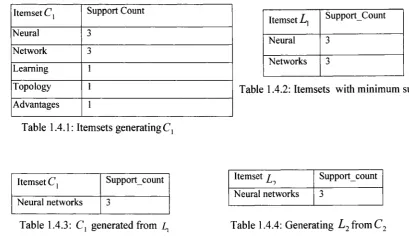
Using the Apriori algorithm in (Agrawal and Srikant, 1994), Table 1.3 can now be mined.
First scan of the transactions results to Table 1.4.1, where each itemset is matched with
its frequency count in the entire transaction set. If minimum support = 2, with the total
number of itemsets in the transactions as 5, the percentage support is 2/5 = 40%. Table
1.4.2 shows the itemsets with support > minimum support, this isZ ,. C2 is generated by
performing a join of Lx with itself, see Table 1.4.3, L2 is the set with minimum support
Item set C , Support Count
N eural 3
N etw ork 3
Learning 1
T o p o lo g y 1
A d van tages 1
Table 1.4.1: Itemsets generating C,
Item set Lx S u p p o r tC o u n t
N eural 3
N etw ork s 3
Table 1.4.2: Itemsets with minimum support
Item set Cx S u p p o r tc o u n t
N eural netw orks 3
Item set t
L ‘ ~>
S u p p o r tc o u n t
Neural netw orks 3
Table 1.4.3: C, generated from i , Table 1.4.4: Generating L 2 from C 2
Finally L = {L x u L2} = {{neural, network} u {neural network}}, the following rule is
then derived; neural networks.
1.3 The Motivation of Thesis
Text extraction serves as the baseline for input to all the other text information mining
methods described in section 1.2. However, there is a huge challenge as to how sentence
segments should be extracted from text for them to yield important information about the
original document. At the same time, when a segment is extracted, can it be combined
with other extracted segments to form a document summary?, (Chuang et. al., 2000).
Since documents are not structured in a standard way, does structuring the data before
extraction of features make the procedure more feasible? These are some of the important
questions that are addressed by (Mooney and Bunescu, 2005).
Accuracy in feature selection is regarded as one criteria for measuring a text-
summarization mechanism (Forman, 2003). If a user looks at extracted document
segments, they should be able to infer what would be the real context of the original text.
Any system that provides such knowledge would be ideal for text information mining.
are mostly domain specific, and do not generate meaningful and timely information,
(Hahn and Mani, 2000).
For a document summary to represent an original document, the semantics in the
summary should be a component of the original document. Terms that are closer in
meaning should be grouped in the same summary. Various studies have been done on
summarization using lexical analysis by (Silber and McCoy, 2000 ), discovery of rules by
understanding the lexical knowledge in the document (Sakurai and Suyama, 2000) and
using semantic orientation of document segments in (Turney and Littman, 2003).
Redundancy is another huge problem for document summaries. Various researchers have
introduced weighting measures and ranking mechanisms to deal with this problem (Gong
and Liu, 2001; Kotcz et. al., 2001; McDonald and Chen, 2002). Terms scoring lower than
predefined thresholds are seen as redundant and therefore eliminated.
In traditional databases, the Apriori approach in (Agrawal and Srikant, 1994) was the
foundation of many rule-generation algorithms. It was originally designed for identifying
frequent patterns in structured data. Apriori requires several scans of the entire database
thereby taking up more processing power and memory. This leads to much inefficiency.
Improvements to the Apriori approach could still lead to generation of frequent patterns
in text documents (Holt and Chung, 1991; Zaiane and Antonia, 2002; Phan et. al., 2005).
The final rules in both data mining and text mining do not have any linkage to the
original transactions. For example, if a rule such as {A,B,C ->D} is generated, this rule
clearly shows that all the four itemsets must be frequent but, the transactions which they
come from are not given. In market basket analysis, this aspect might not be necessary,
however in text information mining, the original source of a frequent itemset could be
useful in assigning concepts to different documents, and this would normally form a
By combining feature extraction, summarization and association rule mechanisms, a
robust system that provides text understanding by linking together documents that are
identified as having some common grounds could be developed. Feature extraction could
be used to identify unique terms in a document; these terms could serve as the document
summary. Words in such a summary can be used to represent a document in a transaction
database. Several such summaries from different documents could be applied to a data
mining algorithm such the Apriori described in (Agrawal and Srikant, 1994), thereby
finding associations between different documents.
The major problem with text information mining is the amount of words that are to be
processed, but this could be significantly reduced when subsets of the documents are
used. Summarization with weighting and ranking mechanisms appear to be more
promising in eliminating redundant words. However, existing weighting and ranking
algorithms do not consider semantic orientation of words and therefore suffer from the
following drawbacks: (1) summaries generated could contain words that seem irrelevant
to the understanding of the document context; (2) key words in a document could be
eliminated if a sentence containing these words is ranked lower than a given threshold;
(3) if summaries are to serve as input for mining algorithms like the Apriori, then further
processing of each summary must be done as a summary is often not structured like a
relational database transaction.
This thesis proposes Semantic Partitions (SEM-P) and Enhanced Semantic Partitions
(ESEM-P) algorithms based on the semantic orientation of words in a document. This
partitioning reduces the amount of words required to represent a document as input for
discovery of frequent patterns while still maintaining the semantics of a document. A
weighting and ranking heuristic measure for each term in a partition is used in ESEM-P
to prune low ranked terms resulting in improved performance on the ESEM-P over the
SEM-P. Identified frequent patterns generate concept hierarchies and hash map
1.4 The Thesis Contribution
Given a collection of text documents t, the thesis proposes two algorithms for text
information mining based on frequent pattern generations. The main aim is to be able to
find associations between the documents in t using the Apriori algorithm, (Agrawal and
Srikant, 1994). However, a huge challenge exists when dealing with text documents since
text documents must undergo several preprocessing stages before any actual mining can
be done.
This thesis contributes to the text information mining problem as follows;
1. Providing a new system that links together text documents based on their
semantic content.
2. Providing a structured representation of a text document that portrays the exact
semantic content of a document. This structure acts as a document summary.
3. The structured summaries in (2) serves as individual items in a transaction
dataset.
4. Unlike other systems, the proposed system contains much fewer words per
document leading to improved computation time and storage space.
5. Identifying frequent patterns from related documents then generating concept
hierarchies that act as classification models.
6. Documents containing frequent patterns in (5) are represented in a Hashmap
identifier for visualization purposes.
Using a natural language process described in (Brill, 1992), understanding the part of
speech for each word in a document is done. Unlike the classification system used by (Hu
and Liu, 2004) where customer reviews are grouped based on specific adjectives in
sentences, the proposed system uses words identified as nouns. The WordNet ontology
described in (Miller, 1995) is used to retrieve the meanings of each noun, (semantics).
Words found to have similar meanings are said to be semantically related and therefore
form semantic partitions. No two semantic partitions in the same document can have the
same elements. For example, let SI and S2 be two semantic partitions for a certain
related, no term ti exists in S2 unless ti = wi and {SI} = {S2}. Therefore SI and S2 must
be distinct.
Using semantic partitions greatly reduces the amount of words processed by the Apriori
algorithm resulting in reduced computation time in comparison to the categorizer
algorithm described in (Zaiane and Antonie, 2002) which finds associations between
documents. The proposed algorithms will be faster, less expensive and more scalable
compared to related text mining algorithms discussed in the literature that are mostly
domain specific (Gong and Liu, 2001, Zaiane and Antonie, 2002, Hu and Liu, 2004,
Mooney and Califf, 2005).
1.5 Outline of the Thesis
The rest of the thesis is organized as follows: Chapter 2 reviews existing works on test
information mining. Detailed description of the proposed algorithms is presented in
chapter 3. Implementation and testing details are in Chapter 4 and the conclusions and
Chapter 2: RELATED WORKS
In this chapter, algorithms that have explored the text information mining are reviewed.
The review consists of algorithms of four different structures which include; extraction
based, (Chuang and Yang, 2000, Yonatan et. al., 2001, Castillo and Serrano, 2004,
Mooney and Califf, 2005), ranking and weighting, (Gong and Liu, 2001, Kotcz et.
al,2001, McDonald and Chen, 2002), lexical and semantic Analysis in (Silber and
McCoy, 2000, Tumey and Littman, 2003, Sakurai and Suyama, 2004) and association
based in (Holt and Chung, 1999, Zaiane and Antonia, 2002, Kongthon, 2004).
2.1 Feature Extraction Algorithms
There is a huge challenge as to how sentence segments should be extracted from text for
them to yield important information about the original document. When a segment is
extracted, can it be combined with other extracted segments to form a document
summary? “A summary will not be as good as an abstract”, (Chuang and Yang, 2000).
Since documents are not structured in a standard way, does structuring the data before
extraction of features make the procedure more feasible? All these are some of the
questions asked by researchers trying to understand text documents (Chuang and Yang,
2000, Yonatan et. al., 2001, Castillo and Serrano, 2004, Mooney and Califf, 2005).
2.1.1 Cue Markers
An automatic text summarizer was developed by (Chuang and Yang, 2000). They
proposed a method that used cue markers in extracting segments from sentences and by
providing a set of key words; segments that include those key words were used to create a
document summary.
First a sentence was identified as having different segments called clauses. Special
phrases described in (Marcu, 1996) as “cue markers” were used to identify the different
segments in a sentence. The phrases include words like words like; “there is”, “but”,
“because”, “i f ’, “however”, “with” etc. The idea is to understand what parts of a sentence
can be understood if separated from the other parts of a sentence. Cue markers act as a
For example, the first sentence in Figure 2.1.1 can be split into two segments SI, and S2.
The first segment S 1 contains, [with the fast growing popularity of the internet and the
worldwide web also known as {“www” or the “web”}] and second segment S2 contains
[there is also a fast growing demand for web access to databases]. The splitting spot is
identified by the presence of the words “there is” in the middle of the sentence. Further
evaluation of the two segments S 1 and S2 is done to identify any more special phrases in
each individual segment. SI contains the word “with” and no special phrase is identified
in S2. SI is seen as the subordinate of S2 due to the presence of the word “with” in SI,
(Marcu, 1996). A subordinate segment is called a satellite and is seen as a description of
another segment, SI is the satellite. S2 is the segment being described in SI and is
referred to as a nucleus. A nucleus is taken as the main part of a sentence and can
therefore act as a representation of the entire sentence.
Several relations between segments in a document are then formed based on what phrases
are present in a segment; these relations are called “rhetoric relations”. A relation r is
defined as r(name,satellite,nucleus), where name is the relation formed between two
segments, satellite represents the segment containing a cue marker and nucleus is the
segment that does not contain any cue marker. The presence of the words such as ’’with”
and “however” forms a justification relation. From the segments SI and S2, a relation r is
formed as; r(justification, si, s2).
More relations as described in (Marcu, 1996) includes thesis and antithesis; the antithesis
relation identifies the presence of a word such as ’’but”, “problem”, “difficult” and
“impossible” in a segment. A thesis relation is identified by the presence of words such as
“in support” in a segment.
With the fast grow ing popularity o f the internet and the world w ide web also known as { (“w w w ” or the“w eb”)}
there is also a fast grow ing demand for web access to databases. H owever, it is especially difficult to use
relational database management {(R D B M S )} software with the web. One o f the problems with using R D B M S
software on the w eb is the protocols used to communicate in the w eb with the protocols used to communicate
with R D B M S software.
[ W ith the fast g ro w in g popularity o f the internet and the w orld w ide w eb also k now n as {(“w w w ” or
the“w eb ”)} 1], [ there is also a fast grow in g dem and for w eb a ccess to databases 2 ], [H ow ever, it is
esp ecia lly d ifficu lt to use relational database m anagem ent {(R D B M S )} softw are w ith the w eb 3].
[ O ne o f the problem s w ith u sin g R D B M S softw are on the w eb is the protocols u sed to com m unicate
in the w eb w ith the protocols used to com m unicate w ith R D B M S softw are 4 ].
Figure 2.1.2: Decomposition of Sentences in Figure 2.1.1 into Individual Segments
Figure 2.1.2 shows the identified segments of the original text in Figure 2.1.1. Each
segment is given a numerical number. The second and third sentences are not segmented
individually as no splitting spots are identified. The following relations are then
developed between all the identified segments; Trustification, 1,2), r(antithesis, 3,2),
r(antithesis, 4,2), r(antithesis, 4,1), and r(antithesis, 3, 1).
Several facts about a segment identified as a nucleus are maintained in a feature vector. A
feature vector f = < PO, WF, BW, CS, CN> where PO = Position of a segment in the
original document, WF = Word frequency in a segment, BW = Bonus Words; (predefined
set of words), CS =No of times a segment appears as a satellite and CN = Number of
times a segment appears as a nucleus. The segments with highest scoring vectors are used
to create a summary. If bonus words BW = {WWW, web, RDBMS}, a feature vector Fj
represents the entries for a segment i. Using Figure 2.1.2, if i = 4, then / 4 = <1,4,4,2,0>
= 11, i = 2 then f 2 = <1,3,3,0,3> = 10. The other two segments are disqualified as they
do not contain any of the words in set BW.
Problem with this algorithm:
This method suffers in three main areas: (1) it is limited to a certain domain of the
supplied key words and does not scale well to documents with varying topics, (2) it is not
that obvious how predefined set of words; (bonus words) are to be supplied, one has to
know the contents of the documents to know what would be seen as a feature necessary
to be picked as a bonus words, and (3) if a bonus word is not found in a document, this
could lead to discriminating segments that might be core to the meaning of a text
2.1.2 ClearStudio
ClearStudio was proposed by (Yonatan et. al, 2001), a system for mining text through
information extraction. The system includes rules for defining important features to be
extracted from a document. These features include events, facts and words with meaning
within the extraction domain.
The system consists of several steps:
1. For each document, extraction is performed. This extraction aims at identifying
events, facts and any words that have some kind of meaning to the document
domain. Example of such an event would be a management change in an
organization, an example is given below.
Rules used to discover special events in a document are developed using DIAL
(Declarative Information Analysis Language), a language developed in (Fisher et. al
1995) for information extraction purposes.
Basic Elements in DIAL:
The language is designed to capture sequences and patterns from text. The language
identifies elements like:
1. Predefined sets of strings.
An example of predefined strings is {“merger”, “union”, “collaboration”}.
2. Word Class elements: Predefined sets of phrases that share semantic meaning.
An example, WC-States, this would hold a list of all states in the US.
3. ASCII characters for example HTML tags would be captured with
@HTMLTAG, and capital letters with @capital.
4. Compound features: This would include a combination of several features
including the above three. For example, Ohio State would match the @Capital
and WC-States.
Rule Definition as Created with ClearStudio:
Let P={P1, P2, ..Pn} be a set of Patterns defined using DIAL, and N be a set of
constraints operating on elements in P. Each i element in N = {Nij}, a set of constrains
operating on Pj. A rule R is defined as a conjuction of clauses Ci = Bi->Hi, where
elements in B are sets of literals from P and H is a head such that H is implied by
conjunction of the literals in B and satisfying constraints in N. For example, suppose one
wants to retrieve information about companies merging activities. Then, a rule must be
developed for automatic identification of key elements regarding mergers. A sample of
such a rule is:
Merger(Cl,C2):-Company(Compl) “and “ Company(Comp2),
WC-Merger(Merger),
VerifvtCompl. !@personName).
Verifty(Comp2, !@personName).
The above rule looks for two company names Cl and C2, it also looks for a word
“merger” in a set of predefined words WC-Merger. The constraint is that the company
names are not people’s names.
2.1.3 Rapier and DiscoTex Methods
The same rule based approach was taken by (Califf and Mooney, 2003) in the Rapier
system. The idea is to have a set of documents and a predefined structure called template,
the system extracts words from the documents and fills the template with these words.
The words extracted are called Slot Fillers (Fillers). To be able to extract these fillers,
some information are expected of the surroundings of the filler in the underlying text
document, and these are seen as patterns. The set of words before the filler is called pre
fillers patterns (pre-p) and the set of words after the filler is called post-filler patterns
(pos-p). Using the pre-p, pos-p and fillers, rules are generated to aid in extraction
First, text segments are tagged using the part of speech tags (POS) in (Brill, 1992), where
words are marked with corresponding syntactic categories; nouns, verbs, adjectives,
adverbs etc. For example, “a simple sentence” is tagged as “a<AT>simple
<JJ>sentence<NN>”, where AT = Singular article, JJ=Adjective and NN=Noun. This
tagging is done so as to create rules with certain constraints thereby eliminating some
strings.
Pre-Filler Pattern F iller Pattern P ost-Filler Pattern
1. syntactic: {N N ,N N P } 1 .word: u n d isclosed
Syntactic : JJ
1. sem antic: price
2. list: length 2
Figure 2.1.3: Sample Extraction Rule in Rapier Adopted from (Califf and Mooney, 2003).
A rule is normally represented in three columns, the first column is the pre-p pattern and
its constraints, the second column represents the filler and the third column represents a
pos-p as shown in Fig 2.1.3. The rule extracts the value “undisclosed” from phrases such
as “sold to the bank for an undisclosed amount” or “paid GEShneir Flooring an
undisclosed price”. Two constraints are placed on column 1 enforcing that a pre-filler
pattern should consist of nouns and proper nouns and must be of length 2, the middle
column enforces that the term “undisclosed” must be present and is the term to be
extracted (filler), and column 3 indicates that a post-filler pattern should be the term
“price” or its synonyms. Using the set of extracted terms from various documents,
DiscoTex system in (Mooney and Bunescu, 2005), organizes the terms in a structured
database and then applies traditional mining algorithms like Apriori in (Agrawal and
Srikant, 1994).
Problem with this extraction approach
A different set of data structure is created for each topic domain; this is quite tedious and
also takes up much processing time and memory space. The worst is that as new concepts
and constraints are to be placed in the extraction process, new rules must be created to
2.1.4 Multi-Strategy Approach
A different approach in text extraction was taken by (Castillo and Serrano, 2004). They
used parallelism to develop HYCLA (Hybrid Classifier), a multi-strategy classification
system. The system contains several learners and each learner takes two stages. The
preprocessing phase and the elimination phase.
Preprocessing phase
A system receives a training sample of either scientific or hypertext documents. Four
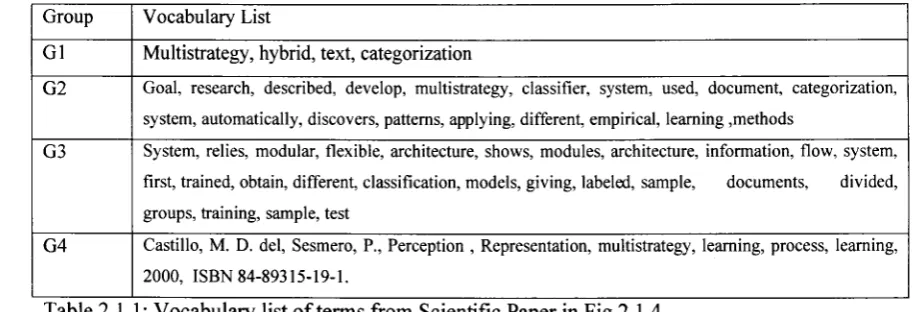
vocabularies are developed from any document received. For example, Fig 2.1.4 is a
sample of a scientific document that is divided into four sections, each section forms a
vocabulary group as seen in Table 2.1.4. The four groups are G l, G2, G3 and G4; G1
contains title words, G2 contains abstract words, G3 contains the plain text following the
abstract and G4 contains the words in the reference list.
M u ltistra teg y H yb rid T ex t C ategorization ->1--- Section 1
Abstract. Ih e goal o t the research described
here is to develop a multistrategy classifier
system that can be used for docum ent
categorization. The system autom atically
discovers classification patterns by applying
different em pirical learning m ethods to ...
^ Section 2
... The system relies on an m odular and flexible
architecture. Figure 1 shows the m odules o f the
architecture and the inform ation flow. The
system is first trained to obtain different
classification m odels by giving a labeled
sam ple o f docum ents that are divided into two
groups: the training sample and the t e s t ...
^ Section 3
References
1. Castillo, M. D. del, Sesmero, P., ''Perception
and Representation in a M ultistrategy Learning
Process", Learning'OO. ISBN 84-89315-19-1.
(2 0 0 0 )...
^ Section 4
G rou p V o c a b u la r y L ist
G1 M u ltis tra te g y , h y b rid , te x t, c a te g o r iz a tio n
G 2 Goal, research, described, develop, multistrategy, classifier, system , used, docum ent, categorization,
system , automatically, discovers, patterns, applying, different, empirical, learning ,m ethods
G 3 System , relies, modular, flexible, architecture, show s, m odules, architecture, information, flow , system ,
first, trained, obtain, different, classification, m odels, givin g, labeled, sample, docum ents, divided,
groups, training, sample, test
G 4 Castillo, M. D. del, Sesmero, P., Perception , Representation, multistrategy, learning, process, learning,
2000, IS B N 84-89315-19-1.
Table 2.1.1: Vocabulary list o f terms from Scientific Paper in Fig 2.1.4
After a count of term frequency in each vocabulary, a weight is given to each word
depending on its position. For example, in Table 2.1.1, G1 terms are given the following
scores; {Multistrategy = 3 x 10 = 30, hybrid = 1 x 10 = 10, text = 1 x 10 = 10,
categorization = 1 x 1 0 = 1 0 } , Multistrategy get the highest score as it appears three
times in the four groups combined and it’s a title word. The final scores for some of the
terms in the vocabulary list G1 and G2 are shown in Table 2.1.2.
Term Frequency Term Frequency
Multistrategy 30 Develop 1
Hybrid 10 Multistrategy 30
Text, 10 Classifier 2
Categorization 10 System 2
Goal 1 Document 1
Research 1 Categorization 1
Table 2.1.2: A Frequency Count o f rferms from G 1 anc G2 from Table 2.
In order to reduce the size of the vocabulary lists, measures such as information gain,
mutual information, document frequency, chi square and cross over entropy are applied
in each term in a vocabulary list. For example, the term “multistrategy” has the following
measures: Information gain, mutual information and document frequency all have a value
Given a category C, with terms that are relevant to that category, for example, if C =
{multistrategy , categorization, system}, a string match is performed on the term
“multistrategy” from G1 with the terms in C. If the term is present, then the odds ratio is
taken as non-zero. The total scores for the term “multistrategy” is at least 90 while that of
the term “goal” is just 3 as it is not a title word, and does not match the terms in C,
therefore the term “goal” is eliminated. The highest scoring terms are the only ones left
for classification {multistrategy, hybrid, text, categorization}.
Problem with this representation
String matching categorization might be helpful in identifying key terms in various
documents with the same kind of text context. However, this might not be helpful if a
document that contains none of the categories being matched is very domain specific.
2.2 Ranking and Weighting Mechanisms
Redundancy is a huge problem for document summaries. Various researchers have
introduced weighting measures and ranking mechanisms to reduce the amount of words
being analysed, (Gong and Liu, 2001, Kotcz et. al,2001, McDonald and Chen, 2002).
2.2.1 Summarization with Relevance Measure
Text extraction with ranking was addressed by (Gong and Liu, 2000), they proposed two
text summarization methods that ranked sentences extracted from original documents.
Some of those ranked sentences were used to create document summaries.
The first method summarizes documents according to relevance measures while the
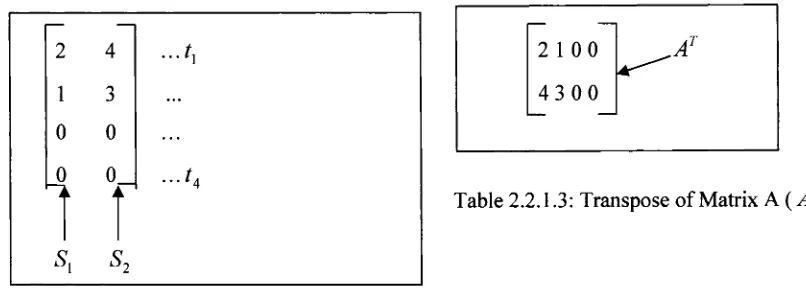
second one used singular value decomposition. Both methods first break documents into
individual sentences and then creates a weighted term-frequency vector for each
We have all heard inspirational stories about people who have faced a cancer diagnosis with courage. Perhaps you have had the privilege
of cheering on a cancer survivor taking a victory lap in the R e la y F o r Life or witnessed the camaraderie of a dragon boat team as they cross the finish line together. You may have wondered how so many people with cancer cope with this experience. A big part of the equation can be summed up in one word: support. Many will tell you
that fighting this disease takes a team effort, a team that includes family and friends.
Figure 2.2.1: A Paragraph o f a Text Document
2.2.1.1 Relevance Measure
Let there be a document segment S t, then S l is represented by a term-frequency vector
T, = { t\i, t2,, .., tm} where every {tp } represents the frequency of term j in segment i.
Segment i could be a sentence, a paragraph or even the entire document itself. The term
frequency of {tp} is computed as: {t n} = Local weighting of term j X Global
weighting of term j. Local represents a position of a document while global represents the
entire document.
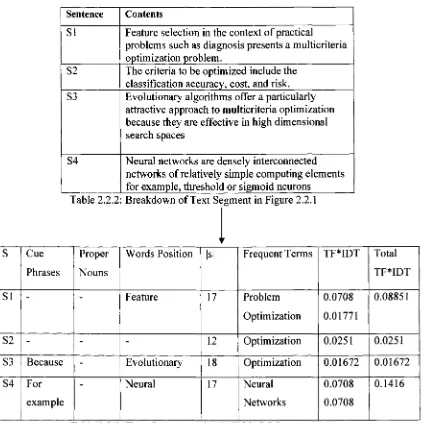
For example, the text segment in Figure 2.2.1. is broken down into sentences S; S= {SI,
S2, S3, S4 S5} as shown in Table 2.2.1. The weighted term frequency of each Si in S is
computed and represented in a vector, the vectors for SI, S2 and S3 are;
VI = <heard 1, inspiration 1, stories 1, about 1, people 1, faced 1, cancer 1, diagnosis 1,
courage 1>, V2 = < perhaps 1, privilege 1 cheering 1, cancer 1, survivor 1, taking 1,
victory 1, lapl, relay 1, life 1, witness 1, camaraderie 1, dragon 1, boat 1, team 1, cross 1,
finish 1 , line 1, together l>and V3 = <wondered 1, people 1, cancer 1, cope 1,
experience 1>. The relevance score for each Si is computed by taking its corresponding
vector and calculating its term frequency in comparison to the document frequency of the
same terms. From the text segment in Figure 2.2.1., there are two frequent words,