| INVESTIGATION
Meta-analysis of Complex Diseases at Gene Level
with Generalized Functional Linear Models
Ruzong Fan,*,1Yifan Wang,* Chi-yang Chiu,* Wei Chen,†Haobo Ren,‡Yun Li,§Michael Boehnke,** Christopher I. Amos,††Jason H Moore,‡‡and Momiao Xiong** *Biostatistics and Bioinformatics Branch, Eunice Kennedy Shriver National Institute of Child Health and Human Development, National Institutes of Health, Bethesda, Maryland 20892,†Division of Pulmonary Medicine, Allergy and Immunology, University of Pittsburgh, Medical Center, Pittsburgh, Pennsylvania 15224,‡Regeneron Pharmaceuticals, Inc., Basking Ridge, New Jersey 07920,
§Departments of Genetics and Biostatistics, University of North Carolina, Chapel Hill, North Carolina, 27599, **Department of
Biostatistics, School of Public Health, University of Michigan, Ann Arbor, Michigan 48109,††Department of Community and Family Medicine, Dartmouth Medical School, Lebanon, New Hampshire 03756,‡‡Department of Biostatistics and Epidemiology, University of Pennsylvania, Philadelphia, Pennsylvania 19104, and§§Human Genetics Center, University of Texas, Houston, Texas 77225
ABSTRACTWe developed generalized functional linear models (GFLMs) to perform a meta-analysis of multiple case-control studies to evaluate the relationship of genetic data to dichotomous traits adjusting for covariates. Unlike the previously developed meta-analysis for sequence kernel association tests (MetaSKATs), which are based on mixed-effect models to make the contributions of major gene loci random, GFLMs arefixed models;i.e., genetic effects of multiple genetic variants arefixed. Based on GFLMs, we developed chi-squared-distributed Rao’s efficient score test and likelihood-ratio test (LRT) statistics to test for an association between a complex dichotomous trait and multiple genetic variants. We then performed extensive simulations to evaluate the empirical type I error rates and power performance of the proposed tests. The Rao’s efficient score test statistics of GFLMs are very conservative and have higher power than MetaSKATs when some causal variants are rare and some are common. When the causal variants are all rare [i.e., minor allele frequencies (MAF),0.03], the Rao’s efficient score test statistics have similar or slightly lower power than MetaSKATs. The LRT statistics generate accurate type I error rates for homogeneous genetic-effect models and may inflate type I error rates for heteroge-neous genetic-effect models owing to the large numbers of degrees of freedom and have similar or slightly higher power than the Rao’s efficient score test statistics. GFLMs were applied to analyze genetic data of 22 gene regions of type 2 diabetes data from a meta-analysis of eight European studies and detected significant association for 18 genes (P,3.1031026), tentative association for 2 genes (HHEXandHMGA2;P1025), and no association for 2 genes, while MetaSKATs detected none. In addition, the traditional additive-effect model detects association at gene HHEX. GFLMs and related tests can analyze rare or common variants or a combi-nation of the two and can be useful in whole-genome and whole-exome association studies.
KEYWORDSmeta-analysis; rare variants; common variants; association mapping; complex traits; functional data analysis
F
OR association studies of many complex traits, multiple studies may have been conducted that have collected the same phenotypic traits. For example, a large number of studies of type 2 diabetes (T2D) have been conducted to evaluate therelationship between single-nucleotide polymorphisms (SNPs) and T2D (Morris et al. 2012; Scott et al. 2012; Li
et al. 2014). The sample size of an individual study can be
small or moderate and may not always lead to a significant association signal at a genome-wide requirement. It is desir-able to combine multiple studies for a unified meta-analysis in order to reach rigorous significant threshold levels (Zeggini and Ioannidis 2009; Evangelou and Ioannidis 2013; Liuet al. 2014). By combining multiple studies together, one can get a sample with a large sample size, and it is more likely to pro-duce significant results. However, different studies may con-tain different genetic data or covariates, which make analysis Copyright © 2016 by the Genetics Society of America
doi: 10.1534/genetics.115.180869
Manuscript received July 18, 2015; accepted for publication December 9, 2015; published Early Online December 29, 2015.
Supporting information is available online at www.genetics.org/lookup/suppl/
doi:10.1534/genetics.115.180869/-/DC1
1Corresponding author: Biostatistics and Bioinformatics Branch, Eunice Kennedy Shriver
of the combined data difficult. It is important to develop sta-tistical methods that analyze the combined data of multiple studies.
To perform an association meta-analysis for complex traits, one may take two strategies: (1) single-genetic-variant-based approaches and (2) gene-based-variant-analysis approaches. The single-genetic-variant approaches use only one genetic variant at a time and are useful to analyze common variants (Zegginiet al.2008; Hindorffet al.2009; Stahlet al.2010). Gene-based association analysis uses multiple genetic vari-ants to detect an association. In recent years, there has been a great deal of interest in developing statistical methods and tests for gene-based association analysis of complex traits
(Hu et al. 2013; Liu et al. 2014). Gene-based analysis can
lead to higher power and improve multiple-comparison prob-lems compared to single-marker analysis because fewer tests are required. More important, gene-based analysis can be the only way to analyze rare variants that have minor allele fre-quencies (MAFs),0.01–0.05 because it could be powerless to use a single rare variant in an analysis.
Burden tests and kernel-based test methods are popular approaches to performing rare variant-gene-based association analyses. Burden tests collapse rare variants into a single variable to test for an association with a complex trait and to reduce the high dimensionality of genetic data (Li and Leal 2008; Madsen and Browning 2009; Han and Pan 2010; Morris and Zeggini 2010; Priceet al.2010; Nealeet al.2011). Kernel-based test methods are based on mixed-effect models in which the regression coefficients of multiple genetic vari-ants are random with means of zero and constant variance. The association is tested by testing a null hypothesis of zero variance by a sequence kernel association test (SKAT). The SKAT and its optimal unified test (SKAT-O) were found to have higher power than burden tests (Wuet al.2011; Lee
et al. 2012). By extending SKAT and SKAT-O to perform
meta-analyses, Leeet al.(2013) developed the meta-analysis for sequence kernel association test (MetaSKAT) and its op-timal unified test (MetaSKAT-O) to carry out meta-analyseis. The regression coefficients of genetic terms in the models of SKAT and MetaSKAT were assumed to be random because the number of genetic variants is usually large for modern genetic data. In population genetics, however, the genetic effects of major gene loci are usually assumed to befixed, while the contributions of polygenic loci are modeled as a random term (Fisher 1918). The high dimensionality of modern genetic data does not necessarily imply that traditional population genetics theory is not correct because the number of causal variants may not be large. Afixed model should befine to analyze the major gene locus data in most cases if the dimen-sion of the genetic data can be properly reduced.
By viewing genetic variant data as realizations of an un-derlying stochastic process, functional regression models were proposed to reduce the dimensionality and to perform a gene-based association analysis of quantitative, qualitative, and survival traits (Luoet al.2011, 2012, 2013; Fanet al.2013, 2014, 2015, 2016; Vsevolozhskayaet al. 2014; Zhanget al.
2014; Wang et al.2015). For quantitative traits, functional linear models lead to bothF- and chi-squared-distributed test statistics that are almost always more powerful than SKAT and SKAT-O (Luo et al.2012; Fanet al.2013, 2015; Wang
et al.2015). For dichotomous and survival traits, functional
regression models lead to test statistics that are more power-ful than SKAT and SKAT-O except in some cases where the causal variants are all rare (Luoet al.2011, 2013; Fanet al. 2014, 2016; Vsevolozhskayaet al.2014). Therefore, functional regression models are found to outperform other methods and potentially to be useful in gene-based association analy-sis of complex traits.
In our functional regression models, the genetic effects are treated as a function of the physical position, and the genetic-variant data are viewed as stochastic functions of the physical position, so any orders of linkage disequilibrium (LD) are taken care of in the models (Ross 1996). The regression co-efficients of genetic terms in the SKAT and MetaSKAT models do no depend on the physical position, while our genetic-effect function depends on the physical position and is actually a function of physical position. Hence, the func-tional regression models can fully use LD and physical position information. The functional regression models are a natural extension of traditional population genetics because we model the genetic effects of major gene loci as
fixed functions.
In this paper, generalized functional linear models (GFLMs) are developed for a meta-analysis of multiple studies. GFLMs can analyze rare or common variants or a combina-tion of the two. Both chi-squared-distributed Rao’s efficient score test statistics and likelihood-ratio test (LRT) statistics are introduced to test for an association between disease traits and multiple genetic variants. Extensive simulations are performed to evaluate the type I error rates and power performance of the GFLMs and tests. The proposed methods were applied to analyze T2D data from a meta-analysis of eight European studies.
Materials and Methods
Consider a meta-analysis withLcase-control studies in a ge-nomic region. For theℓth study, we assume that there arenℓ individuals who are sequenced in the genomic region atmℓ variants. We assume that the mℓ variants are located with ordered physical positions 0#tℓ1,⋯,tℓmℓ. To make the notation simpler, we normalized the region ½tℓ1;tℓmℓ to be [0, 1]. For the ith individual in theℓth study, letyℓi denote
his or her dichotomous trait (hereyℓi¼1 indicates that the
individual is an affected case of the disease of interest,yℓi¼0
indicates that the individual is a normal control individual), Gℓi¼ ½Xℓiðtℓ1Þ;. . .;XℓiðtℓmℓÞ9denotes his or her genotypes of themℓ variants, andZℓi¼ ðzℓi1;. . .;zℓicℓÞ9denotes his or her cℓ covariates. Hereafter in this paper, a prime denotes the transpose of a vector or matrix. For the genotypes, we assume thatXℓiðtℓjÞ(= 1, 2, 3) is the number of minor alleles of the
Traditional additive-effect models
By using logistic regression, an additive-effect model (AEM) can be used to analyze the relation between the disease traityℓiand
themℓvariants in theℓth study as (Cordell and Clayton 2002)
logitðpℓiÞ ¼aℓ0þZ9ℓiaℓþ
Xmℓ
j¼1
XℓiðtℓjÞbℓj;
ℓ¼1;2;. . .;L;i¼1;2;. . .;nℓ (1)
where pℓi¼Pðyℓi¼1Þ is the disease probability, aℓ0 is the
regression intercept, aℓ¼ ðaℓ1;. . .;aℓcℓÞ9 is a cℓ31 column vector of regression coefficients of covariates, andbℓjis the
additive genetic effect of variantjfor theℓth study. The num-ber of the parameters of the model (1) can be large, so it may not be powerful. Despite the potential drawbacks, the model (1) can be easily implemented by standard statistical soft-ware such as R. If the number of genetic variants is large, one may decompose the genotype matrix into the product of an orthogonal matrixQand a triangular matrixRvia Gram-Schmidt process to remove the redundancy to facilitate com-putation in applications,i.e., theQRdecomposition.
b-Smooth-only GFLMs
To model the relation between the disease traityℓiand themℓ variants, we propose the following functional logistic regres-sion model:
logitðpℓiÞ ¼aℓ0þZ9ℓiaℓþ
Xmℓ
j¼1
XℓiðtℓjÞbℓðtℓjÞ;
ℓ¼1;2;. . .;L;i¼1;2;. . .;nℓ (2)
wherebℓðtℓjÞis the genetic effect of the variant at positiontℓj,
and the other terms are similar to those in the AEM (1). Note that we haveLstudies, so the effect of a common covariate can be either the same or different across the studies: (1) heterogeneous: we treataℓas different for different studies, i.e.,aℓ;ℓ¼1;. . .;L;are all different; and (2) homogeneous: if a covariate is present in different studies, we model its re-gression coefficient by one common coefficient.
In the model (2),bℓðtℓjÞis introduced as the genetic effect
of the variant at positiontℓj. We assume thatbℓðtÞis a
contin-uous function of the physical position t. One may expand it by B-spline or Fourier or linear spline basis functions. Formally, let us expand the genetic-effect function bℓðtÞ by a series of Kb basis functionscðtÞ ¼ ½c1ðtÞ;. . .;cKbðtÞ9 asbℓðtÞ ¼ ½c1ðtÞ;. . .;cKbðtÞðbℓ1;. . .;bℓKbÞ9¼cðtÞ9bℓ, where
bℓ¼ ðbℓ1;. . .;bℓKbÞ9is a vector of coefficientsbℓ1;. . .;bℓKb. We consider two types of basis functions: (1) the B-spline basis ckðtÞ ¼BkðtÞ;k¼1;. . .;Kb and (2) the Fourier basis c1ðtÞ ¼1; c2rþ1ðtÞ ¼sinð2prtÞ, and c2rðtÞ ¼cosð2prtÞ;
r¼1;. . .;ðKb21Þ=2. Here, for Fourier basis,Kbis taken as
a positive odd integer (de Boor 2001; Ramsay and Silverman 2005; Ramsayet al.2009; Ferraty and Romain 2010; Horváth and Kokoszka 2012). ReplacingbℓðtℓjÞby the expansion, the
model (2) can be revised as
logitðpℓiÞ ¼aℓ0þZ9ℓiaℓþ
Pmℓ
j¼1
XℓiðtℓjÞ
h
c1ðtℓjÞ;. . .;cKbðtℓjÞ
i
( )
3bℓ1;. . .;bℓKb
9¼aℓ0þZ9ℓiaℓþWℓ9ibℓ (3)
where Wℓ9i¼
Pmℓ
j¼1XℓiðtℓjÞ½c1ðtℓjÞ;. . .;cKbðtℓjÞ. In the model (2) and its revised version (3), we use the raw genotype data Gℓi¼ ½Xℓiðtℓ1Þ;. . .;XℓiðtℓmℓÞ9directly in the analysis.
General GFLM
In this subsection we view theith individual’s genotype data as a genetic variant function (GVF)XℓiðtÞ; t2 ½0;1in
addi-tion to treating the genetic effects as funcaddi-tionsbℓðtÞ. To relate the GVF to the phenotypic traits adjusting for covariates, we consider the following functional logistic regression model:
logitðpℓiÞ ¼aℓ0þZ9ℓiaℓþ
Z 1
0
XℓiðtÞbℓðtÞdt;
ℓ¼1;2;. . .;L;i¼1;2;. . .;nℓ (4) wherebℓðtÞis the genetic effect of GVFXℓiðtÞat positiont, and
the other terms are similar to those in the b-smooth-only model (2). In this model, the integration termR01XℓiðtÞbℓðtÞdt
is used to replace the summation termPmℓ
j¼1XℓiðtℓjÞbℓðtℓjÞin the b-smooth-only model (2).
Estimation of GVF: LetfkðtÞ; k¼1;. . .;K;be a series ofK
basis functions, such as the B-spline basis and Fourier basis func-tions. Let Fdenote the mℓ 3K matrix containing the values
fkðtℓjÞ, wherej21;. . .;mℓ. DenotefðtÞ ¼ ½f1ðtÞ;. . .;fKðtÞ9.
Using the discrete realizationsGℓi¼ ½Xℓiðtℓ1Þ;. . .;XℓiðtℓmℓÞ9, we may estimate the GVF XℓiðtÞ using an ordinary linear square
smoother as follows (Ramsay and Silverman 2005, Chapter 4):
^
XℓiðtÞ ¼
Xℓiðtℓ1Þ;. . .;XℓiðtℓmℓÞ
FF9F21fðtÞ (5)
Revised GFLM: As in the b-smooth-only case, the genetic effect bℓðtÞ is expanded by a series of basis functions
bℓðtÞ ¼cðtÞ9bℓ. Replacing XℓiðtÞ in (4) by ^XℓiðtÞ in (5) and
bℓðtÞby the expansion, we have the following revised logistic regression model:
logitðpℓiÞ ¼aℓ0þZ9ℓiaℓþ 8 < : h
Xℓiðtℓ1Þ;. . .;XℓiðtℓmℓÞ
i
FhF9Fi21
3
Z1
0
fðtÞc9ðtÞdt
9 =
;bℓ
¼aℓ0þZ9ℓiaℓþWℓi9bℓ (6)
where Wℓ9i¼ ½Xℓiðtℓ1Þ;. . .;XℓiðtℓmℓÞF½F9F2
1R1
0fðtÞc9ðtÞdt.
In this revised regression model, one needs to calculate F½F9F21
Test statistics of association
We consider the revised regression models [(3) and (6)] as usual logistic regressions that model the genetic effect of GVFs adjusted for covariates. First, assume that the genetic effects among theL studies are heterogeneous. To test for an association between the genetic variants and the dis-ease trait, the null hypothesis isH0: bℓ¼ ðbℓ1;. . .;bℓKbÞ9¼0; ℓ¼1;. . .;L. We may test the null hypothesis by a chi-squared-distributed Rao’s efficient score statistic with a de-gree of freedom ofLKb. The Rao’s efficient score statistic is denoted by GFLM Het-Rao. An alternative approach is to use a LRT statistic to test for association, which is also chi-squared distributed withLKbdegrees of freedom and is denoted by
GFLM Het-LRT.
If the genetic effects are homogeneous, i.e., bℓ¼
ðbℓ1;. . .;bℓKbÞ9¼b¼ ðb1;. . .;bKbÞ9; ℓ¼1;. . .;L, we may test for association by testing a simplified null hypothesis H0: b¼ ðb1;. . .;bKbÞ9¼0. Again, one may use a chi-squared-distributed Rao’s efficient score statistic and a chi-squared-distributed LRT statistic to test the null hypothesis. Both the chi-squared-distributed Rao’s efficient score statistic and the LRT statistic have a degree of freedom ofKband
are denoted by GFLM Hom-Rao and GFLM Hom-LRT, respectively.
For the AEM (1), the null hypothesis is H0: bℓ¼
ðbℓ1;. . .;bℓmℓÞ9¼0; ℓ¼1;. . .;L, under an assumption of
heterogeneous genetic effect. The corresponding chi-squared-distributed Rao’s efficient score test and LRT sta-tistics are chi-squared distributed withPLℓ¼1mℓdegrees of freedom. The tests are denoted as AEM Rao and AEM Het-LRT, respecyively. Assume that each individual of theL stud-ies is sequenced at the same variants at 0#t1,⋯,tmand
so m1¼⋯¼mℓ¼m. In addition, assume that the genetic effects are homogeneous, i.e., bℓ¼ ðbℓ1;. . .;bℓmℓÞ9¼b¼
ðb1;⋯;bmÞ9. Then the AEM (1) is simplified as
logitðpℓiÞ ¼aℓ0þZ9ℓiaℓþ
Xm
j¼1
XℓiðtjÞbj;
ℓ¼1;2;. . .;L;i¼1;2;. . .;nℓ (7) The null hypothesis of no association between the genetic variants and the disease trait isH0: b¼ ðb1;. . .;bmÞ9¼0.
The corresponding Rao and LRT statistics are chi-squared distributed withmdegrees of freedom. The tests are denoted as AEM Hom-Rao and AEM Hom-LRT, respectively.
Parameters of functional data analysis
In the data analysis and simulations, we used a functional data analysis procedure in the statistical package R. We use two functions in library fda of R package as follows to create basis: basis = create.bspline.basis(norder = order, nbasis = bbasis) basis = create.fourier.basis(c(0,1), nbasis = fbasis)
Table 1 Association analysis of T2D status in eight European cohorts by heterogeneous Rao’s efficient score test statistics (Rao), Het-MetaSKAT-O, and Het-MetaSKAT
Gene
P-values of Het-Rao
P-values of Het-Meta Basis of both GVF andbℓðtÞ Basis ofb-smooth-only Additive effect
B-spline Fourier B-spline Fourier Model (1) SKAT SKAT-O
PCSK9 3:23310211a 4:60310211a 3:23310211a 4:60310211a 1025 0.792 0.059 APOB 1:13310222a 2:52310220a 1:13310222a 2:52310220a 6:49310215a 0.499 0.517 IGF2BP2 7:0631029a 3:10310211a 7:0631029a 3:10310211a 9:29310217a 0.531 0.503 CDKAL1 9:07310220a 9:01310222a 9:07310220a 9:01310222a 2:1131029a 0.961 0.800 JAZF1 8:03310229a 2:61310227a 8:03310229a 2:61310227a 1:91310212a 0.032 0.046 LPL 4:9231025 5:0931028a 4:9231025 5:0931028a 7:34310212a 0.590 0.795 CDKN2B 2:94310235a 9:98310228a 2:94310235a 9:98310228a 6:17310225a 0.554 0.410 CDC123 1:66310218a 6:98310218a 1:66310218a 6:98310218a 1:31310214a 0.039 0.072 IDE 1:47310221a 6:62310223a 1:47310221a 6:62310223a 3:66310216a 0.414 0.630 KIF11 1:57310223a 1:91310223a 1:57310223a 1:91310223a 1:68310221a 0.768 0.913 HHEX 3:4831025 2:9731025 5:1031026 2:9731025 2:9531026a 0.480 0.691
TCF7L2 7:51310211a 6:06310210a 7:51310211a 6:06310210a 1:0231024 0.021 0.042 KCNQ1 3:67310231a 4:94310229a 3:67310231a 4:94310229a 2:6431028a 0.572 0.797 MTNR1B 2:09310217a 2:27310215a 2:09310217a 2:27310215a 8:54310214a 0.295 0.456 HMGA2 1:6831025 1:9931024 1:6831025 1:9931024 6:1831022 0.699 0.887
TSPAN8 4:78310238a 9:39310238a 5:89310238a 1:48310237a 1:01310236a 0.747 0.923 HNF1A 1:71310216a 1:10310215a 1:71310216a 1:10310215a 3:56310226a 0.272 0.441 OASL 6:01310235a 1:06310228a 6:01310235a 1:06310228a 8:85310224a 0.530 0.416 FTO 1:26310225a 1:14310226a 1:26310225a 1:14310226a 1:17310221a 0.048 0.090
LDLR 0.373 0.477 0.373 0.477 0.427 0.233 0.400
APOE 2:07310231a 2:19310227a 2:07310231a 2:19310227a 7:19310230a 0.042 0.082 GIPR 5:9931023 9:5631023 5:9931023 9:5631023 0.013 0.808 0.303
The results of“Basis of both GVF andbℓðtÞ”were based on smoothing both GVF and genetic-effect functionsbℓðtÞof model 6, and the results of“Basis ofb-smooth-only”
were based on the smoothingbℓðtÞonly approach of model 3, and theP-values of Het-MetaSKAT and Het-MetaSKAT-O were based of the R package MetaSKAT. GVF,
genetic variant function.
The three parameters were taken asorder = 4,bbasis = 10,
fbasis = 11for the heterogeneous genetic-effect model and as
order = 4, bbasis = 12, fbasis = 13for the homogeneous
genetic-effect model in all data analyses and simulations. To make sure that the results are valid and stable, we tried a wide range of parameters: (1) 8#K¼Kb#13 for the
het-erogeneous genetic-effect model and (2) 10#K¼Kb#21
for the homogeneous genetic-effect model. The results are similar to each other (data not shown).
Data availability
Computer Program: The methods proposed in this paper are implemented by using the procedure of functional data analysis (fda) in the statistical package R. The R codes for data analysis and simulations are available fromhttp://www.nichd.nih.gov/ about/org/diphr/bbb/software/fan/Pages/default.aspx.
Results
Meta-analysis of T2D in eight European cohorts
The proposed methods were applied to analyze a set of studies investigating T2D that includes eight European cohorts: the FIN-D2D 2007 study (D2D2007), the Diabetes Genetic study (DIAGEN), the Finnish Diabetes Prevention Study (DPS), the Finland–United States Investigation of NIDDM Genetics study (FUSION Stage 2), the Nord-Trøndelag Health Study 2 (HUNT), the Metabolic Syndrome in Men study (METSIM),
and the Tromsø study (TROMSO). The sample sizes of cases and controls for each study are provided in Supporting In-formation,Table S1. For each cohort, 54,741 genetic variants are genotyped and are located in 97 genetic regions across the 22 autosomes. For our analysis, we used the literature on T2D as a reference for gene selection and found that 22 gene regions werefine mapped (Zegginiet al.2008; Voightet al. 2010; Morriset al.2012; Scottet al.2012; Liet al.2014; Liu
et al.2014). We used Builder Mar. 2006 (NCBI36/hg18) to
determine gene positions, and 5 kb was used to extend the gene region on each side of a gene. A summary of the 22 genes and the number of genetic variants in each gene region are given inTable S2.
Association analysis between T2D status and each of the 22 genes was performed by the proposed methods and MetaSKAT. Except for METSIM, age and sex were used as covariates. For METSIM, age was used as a covariate because no females were included in the study. A significance threshold of P,3.131026 was taken from Liuet al. (2014). If a
P-value is around 1025but larger than 3.131026, we call
it a“tentative significant association signal.”
Table 1 reports the results of association analysis of the eight European cohorts by heterogeneous Rao’s efficient score test (Het-Rao), Het-MetaSKAT-O, and Het-MetaSKAT, and Table 2 reports the results by homogeneous Rao’s effi -cient score test (Rao), MetaSKAT-O, and Hom-MetaSKAT. The results of Het-LRT and Hom-LRT are reported Table 2 Association analysis of T2D status in eight European cohorts by homogeneous Rao’s efficient score test statistics (Hom-Rao), Hom-MetaSKAT-O, and Hom-MetaSKAT
Gene
P-values of Hom-Rao
P-values of Hom-Meta Basis of both GVF andbℓðtÞ Basis ofb-smooth only Additive effect
B-spline Fourier B-spline Fourier Model (1) SKAT SKAT-O
PCSK9 0.079 0.034 0.181 0.229 0.780 0.063 0.025
APOB 0.035 0.081 0.012 0.021 0.873 0.807 0.623
IGF2BP2 0.017 4:4831023 1:1331023 2:3031024 0.041 0.417 0.368
CDKAL1 0.190 0.214 0.056 0.081 0.416 0.473 0.646
JAZF1 0.446 0.422 0.199 0.302 0.476 0.352 0.094
LPL 0.075 0.013 0.080 0.011 0.148 0.416 0.559
CDKN2B 0.001 5:6331025 6:0431023 0.015 0.147 0.325 0.430
CDC123 0.039 0.027 0.076 0.071 0.040 0.129 0.210
IDE 0.241 0.138 0.155 0.308 0.368 0.252 0.389
KIF11 0.040 0.036 0.065 0.187 0.864 0.667 0.802
HHEX 0.020 0.004 0.030 0.034 0.378 0.684 0.711
TCF7L2 2:67310214a 4:36310214a 1:94310216a 1:07310215a 8:1131027a 1:3731024 3:0331024
KCNQ1 0.061 0.143 0.106 0.142 0.103 0.420 0.601
MTNR1B 6:7031024 4:5531024 0.012 4:9031029a 0.357 0.523 0.641
HMGA2 0.757 0.911 0.671 0.903 0.598 0.880 1
TSPAN8 0.448 1:4731025 2:4031023 3:8431024 0.910 0.991 0.836
HNF1A 0.135 0.046 0.087 7:8331023 0.194 0.661 0.363
OASL 0.075 0.026 0.032 0.030 0.371 0.477 0.305
FTO 7:0231024 1:8331024 3:7031026 2:0731027a 0.283 0.291 0.428
LDLR 0.951 0.916 0.933 0.933 0.907 0.876 0.727
APOE 0.449 0.155 0.024 4:7731023 0.045 0.038 0.070
GIPR 0.058 0.038 0.037 0.128 0.034 0.306 0.250
The results of“Basis of both GVF andbℓðtÞ”were based on smoothing both GVF and genetic-effect functionsbℓðtÞof model 6, and the results of“Basis ofb-smooth-only”
were based on the smoothingbℓðtÞonly approach of model 3, and theP-values of Hom-MetaSKAT and Hom-MetaSKAT-O were based of the R package MetaSKAT. GVF,
genetic variant function.
in Table S3 and Table S4, respectively. At the significance threshold of P,3.131026, we observe associations for
17 genes,PCSK9,APOB,IGF2BP2,CDKAL1,JAZF1I CDKN2B,
CDC123, IDE, KIF11, TCF7L2, KCNQ1, MTNR1B, TSPAN8,
HNF1A,OASL, FTO, andAPOE, by both Rao and
Het-LRT in both the revised b-smooth-only GFLM (3) and the revised general GFLM (6) for both B-spline and Fourier basis functions in Table 1 andTable S3. For theLPLgene, a signif-icant association signal is observed by both Rao and Het-LRT in both the b-smooth-only GFLM (3) and the revised general GFLM (6) for Fourier basis functions, while B-spline basis functions lead to tentative association signals. Tentative association signals are observed for two genes, HHEX and
HMGA2, in Table 1 and Table S3, respectively. Only two
genes,LDLRandGIPR, show no association signal.
By both Hom-Rao and Hom-LRT in both the revised
b-smooth-only GFLM (3) and the revised general GFLM (6) for both B-spline and Fourier basis functions in Table 2 and
Table S4, association is observed for gene TCF7L2 at the significance threshold ofP,3.131026. By both Hom-Rao
and Hom-LRT in the b-smooth-only GFLM (3) for Fourier basis functions, significant association signals are observed for two genes,MTNR1BandFTO, in Table 2 andTable S4. Tentative association signals are observed for two genes,
CDKN2B andTSPAN8, by both Hom-Rao and Hom-LRT in
Table 2 andTable S4for Fourier basis functions in the revised general GFLM (6), respectively.
TheP-values of Hom-LRT inTable S4are very similar to those of Hom-Rao in Table 2, and theP-values of Het-LRT in
Table S3are slightly smaller than those of Het-Rao in Table 1. Hence, the LRT statistics can be slightly more powerful than the Rao’s efficient score test statistics. It is noteworthy that most association signals are detected by LRT and Het-Rao, but Hom-LRT and Hom-Rao only detect association sig-nals for three genes,TCF7L2,MTNR1B, andFTO, reflecting the presence of heterogeneity of the genetic effects.
In addition to the results of GFLMs 3 and 6, MetaSKAT, and MetaSKAT-O, Table 1, Table 2,Table S3, andTable S4report the results of traditional additive-effect models 1 and 7. Additive-effect models 1 and 7 detect most association sig-nals of GFLMs 3 and 6 in Table 1 and Table 2. In particular, the Het-Rao and Het-LRT of the AEM (1) detect association forHHEXin Table 1 andTable S3.
It is noteworthy that Het-MetaSKAT-O, Het-MetaSKAT, Hom-MetaSKAT-O, and Hom-MetaSKAT do not detect any
significant signals in any of the 22 genes. The 22 genes are from the literature on T2D, and each of them contains SNPs that are associated with T2D. Thus, significant association signals for T2D are expected for most of the 22 genes if a gene-based method is sensitive. However, MetaSKAT detected no associations for the 22 genes, although our GFLMs and AEM detect associations for 19 genes. Therefore, MetaSKAT is less sensitive than the proposed LRT and Rao’s efficient score test statistics for the T2D data in the European cohorts. InTable S5,Table S6,Table S7, andTable S8, we report the results of Rao’s efficient score tests by dividing the data between rare and common variants based on a cutoff of 0.03. It is worth noting that the 22 genes contain both rare and common iants and that the associations are mainly from common var-iants. SKAT and MetaSKAT are designed to analyze rare variants, while the GFLMs and the AEM can analyze rare or common variants or a combination of the two.
When we analyze the data sets separately for each study by the method proposed in Fanet al.(2014), significant associa-tion is only detected atTCF7L2in the study of Norway by Rao’s efficient score test and the LRT (data not shown). Thus, it is advantageous to perform a meta-analysis of multiple studies.
A simulation study
Simulations were performed to evaluate the performance of the proposed methods for two cases: (1) all causal variants are rare, and (2) some causal variants are rare and some are common. Three scenarios listed in Table 3 were considered for the simulations. Scenarios 1 and 2 used the European-like (EUR) sequence data, which are the same as those in Lee
et al. (2012). Scenario 3 used both the EUR and
African-American-like (AA) sequence data. The EUR sequence data were generated using COSI’s calibrated best-fit models, and the generated European haplotypes mimick CEPH Utah indi-viduals with ancestry from northern and western Europe in terms of site-frequency spectrum and LD pattern (Schaffner
et al. 2005, Figure 4; International HapMap Consortium
2007). Similarly, the AA sequence data mimick the Yoruba from Ibadan (YRI) (Nigeria in Africa) individuals with a 20:80 mixture of Europeans and Africans, together with pa-rameters calibrated to model realistic demographic history (including bottleneck, population expansion, and migration events). The EUR data included 10,000 chromosomes cover-ing 1-Mb regions, and the AA data included 45,000 chromo-somes covering 0.1-Mb regions.
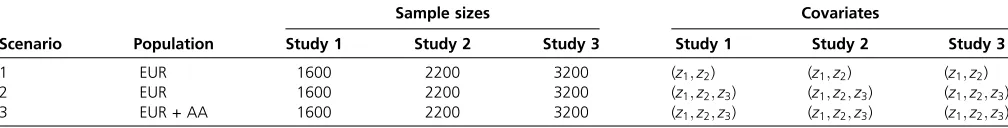
Table 3 Simulation study settings
Scenario Population
Sample sizes Covariates
Study 1 Study 2 Study 3 Study 1 Study 2 Study 3
1 EUR 1600 2200 3200 (z1;z2) (z1;z2) (z1;z2)
2 EUR 1600 2200 3200 (z1;z2;z3) (z1;z2;z3) (z1;z2;z3)
3 EUR + AA 1600 2200 3200 (z1;z2;z3) (z1;z2;z3) (z1;z2;z3)
Sample sizes are total sample sizes in each study, in which half are cases and the rest half are control individuals. Covariates represent covariates in each study. EUR refers to
the scenario where all three studies had EUR samples. EUR + AA refers to the scenario where studies 1 and 2 had EUR samples and study 3 had AA samples.z1is a binary
Type I error simulations:To evaluate the type I error rates of the proposed models and tests, we generated phenotype data sets by using the model
logitðpℓiÞ ¼a0þ0:5zℓi1þ0:5zℓi2; ℓ¼1;2;3 (8)
for scenario 1 in Table 3 and
logitðpℓiÞ ¼a0þ0:5zℓi1þ0:5zℓi2þ0:5zℓi3; ℓ¼1;2;3
(9)
for scenarios 2 and 3 in Table 3, wherezℓi1is a dichotomous
covariate taking values 0 and 1 with a probability of 0.5,zℓi2
andzℓi3are continuous covariates from standard normal
dis-tributions Nð0;1Þ, and a0¼ 24:60¼log½0:01=ð120:01Þ
was chosen to provide a disease prevalence of 0.01 under a null hypothesiszℓij¼0. To obtain genotype data, 3-kb
subre-gions were randomly selected in the 1-Mb resubre-gions of EUR and AA data. The ordered genotypes were these variants in the 3-kb subregions. Note that the trait values are not related to the genotypes, so the null hypothesis holds. We calculated empirical type I error rates for both Rao’s efficient score test and LRT statistics.
The sample sizes of the data sets were taken as 1600 (study 1), 2200 (study 2), and 3200 (study 3), respectively. For each study, half the sample consists of cases, and the remaining half consists of control individuals. The simulation settings are summarized in Table 3. For each sample-size combination, 106phenotype-genotype data sets were generated tofit the
proposed models and to calculate the test statistics and re-latedP-values. Then an empirical type I error rate was calcu-lated as the proportion of 106P-values that were smaller
than a given alevel (i.e., 0.05, 0.01 and 0.001, 0.0001, respectively).
Empirical power simulations: To evaluate the power per-formance of the proposed models and tests, we simulated data sets under the alternative hypothesis by randomly selecting 3-kb subregions to obtain causal variants for the disease traits as follows: once a 3-kb subregion was selected, a subset ofp causal variants located in the 3-kb subregion was then ran-domly selected to obtain ordered genotypes [gðt1Þ;. . .;gðtpÞ].
Then we generated the disease traits by
logitðpℓiÞ ¼a0þ0:5zℓi1þ0:5zℓi2þbℓi1gðt1Þ
þ⋯þbℓipg
tp
; ℓ¼1;2;3 (10)
for scenario 1 in Table 3 and by
logitðpℓiÞ ¼a0þ0:5zℓi1þ0:5zℓi2þ0:5zℓi3þbℓi1gðt1Þ þ⋯
þbℓipg
tp
;
ℓ¼1;2;3 (11)
for scenarios 2 and 3, where a0 and zℓij are the same as
in models 8 and 9, and b is as follows: we used
jbℓijj ¼cℓjlog10ðMAFjÞj=2, where MAFjis the MAF of thejth
variant. Three different settings were considered: 5, 10, and
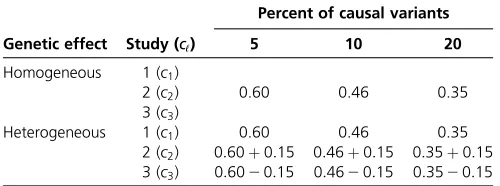
20% of variants in the 3-kb subregion are chosen as causal variants. When 5, 10, and 20% of the variants were causal, two parameter settings of genetic effects were considered for cℓ: (1) homogeneous and (2) heterogeneous (Table 4). In the homogeneous case, the genetic effects are the same for the three studies, i.e.,c1¼c2¼c3. In the heterogeneous case,
the genetic effects are different for the three studies, i.e., c2¼c1þ0:15 andc3¼c120:15. For each setting, 1000
data sets were simulated to calculate the empirical power as the proportion of P-values that are smaller than an
a¼0:0001 level.
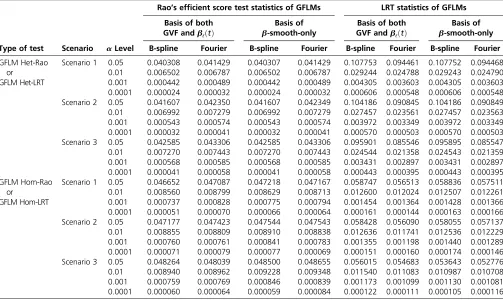
Type I error simulation results:The empirical type I error rates are reported in Table 5 and Table 6. In Table 5, only rare variants were used to generate genotype data, but none of them relates to the trait. In Table 6, all variants were used to generate genotype data. For the GFLMs Hom-Rao and Het-Rao, all empirical type I error rates are below the nominal
alevels for both B-spline and Fourier basis functions (columns 4–7 of Table 5 and Table 6). Therefore, the chi-squared-distributed Rao’s efficient score statistics are very conserva-tive and can be useful in whole-genome and whole-exome association studies.
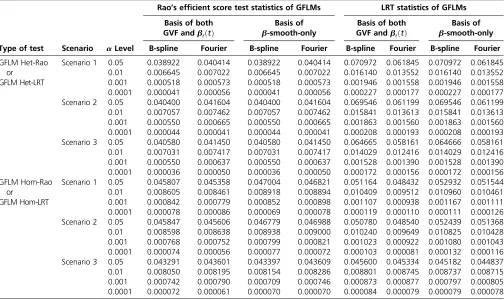
For the GFLM Hom-LRT, all empirical type I error rates are around the nominal alevels for both B-spline and Fourier basis functions when all variants were used to generate ge-notype data (bottom parts of columns 8–11 of Table 6). For the GFLM Het-LRT, the empirical type I error rates are slightly higher than the nominalalevels when all variants were used to generate genotype data (top parts of columns 8– 11 of Table 6), and the GFLM Het-LRT statistics can inflate type I error rates.
When only rare variants were used to generate genotype data, the empirical type I error rates are much higher than the nominalalevels for both B-spline and Fourier basis functions for GFLM Het-LRT statistics (top parts of columns 8–11 of Table 5). Relatively, the empirical type I error rates of GFLM Hom-LRT statistics are only slightly higher than the nominal
alevels for both B-spline and Fourier basis functions (bottom parts of columns 8–11 of Table 5).
In Fanet al.(2014), it was found that the Rao’s efficient score test statistics are very conservative when the sample is small or moderate from a single study (i.e., the sample ranges Table 4 Simulation parameter settings
Genetic effect Study (cℓ)
Percent of causal variants
5 10 20
Homogeneous 1 (c1)
2 (c2) 0.60 0.46 0.35
3 (c3)
Heterogeneous 1 (c1) 0.60 0.46 0.35
2 (c2) 0:60þ0:15 0:46þ0:15 0:35þ0:15 3 (c3) 0:6020:15 0:4620:15 0:3520:15
The constantscℓinbℓ¼cℓ=log10ðMAFÞof power simulations,ℓ¼1;2;3, are given
from 200 to 2000). Hence, the results of this paper are con-sistent with those of Fanet al.(2014) for the Rao’s efficient score test statistics. When the sample is smaller than or equal to 2000, Fanet al.(2014) found that the LRT statistics inflate the type I error rates. In this paper, we have a very big sample size of 7000 by combining three studies for a unified analysis, and the GFLM Hom-LRT controls the type I error rates cor-rectly, but the GFLM Het-LRT still may inflate the type I error rates.
In short, the chi-squared-distributed Rao’s efficient score test statistics of GFLMs Hom-Rao and Het-Rao are very con-servative. If the sample size is large, GFLM Hom-LRT statistics control the type I error rates well when all variants were used to generate genotype data and can slightly inflate the type I error rates when only rare variants were used to generate genotype data. The GFLM Het-LRT statistics may inflate the type I error rates, which may be due to the large degrees of freedom.
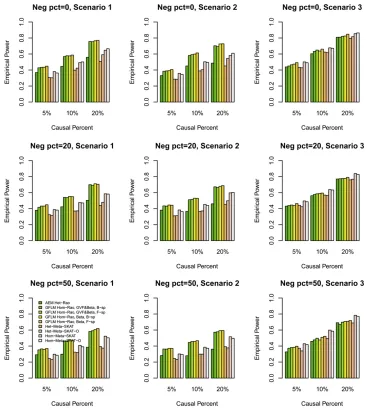
Statistical power results: We compared the power perfor-mance of the proposed tests with MetaSKAT based on the simulated COSI sequence data. The empirical power levels at thea¼0:0001 level are plotted in Figure 1, Figure 2, Figure 3, Figure 4,Figure S1,Figure S2,Figure S3, andFigure S4. In all theses figures,“GVF&Beta, B-sp”(or“GVF&Beta, F-sp”) means that both GVF and the genetic-effect function bðtÞ
were smoothed by B-spline (or Fourier) basis functions, and “Beta, B-sp”(or“Beta, F-sp”) means that only the genetic-effect functionbðtÞ was smoothed by B-spline (or Fourier) basis functions (i.e., b-smooth-only). Moreover, the results of Het-MetaSKAT, Het-MetaSKAT-O, Hom-MetaSKAT, and Hom-MetaSKAT-O using the R package MetaSKAT are report-ed for power comparison (Leeet al.2013).
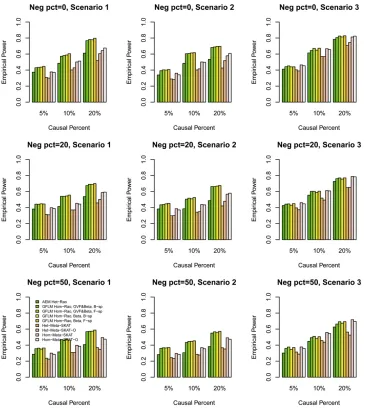
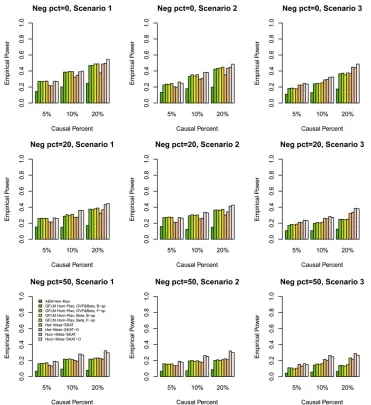
In Figure 1, Figure 2, Figure 3, and Figure 4, the results of GFLM Hom-Rao are reported, and the Rao’s efficient score test statistics are constructed using the homogeneous effect model. InFigure S1,Figure S2,Figure S3, andFigure S4, the results of GFLM Het-Rao are reported, and the Rao’s effi -cient score test statistics are constructed using the hetero-geneous effect model. Moreover, the results of AEM Het-Rao for the additive-effect model (1) are reported in eachfigure for a comparison. In Figure 1, Figure 2,Figure S1, and Fig-ure S2, the simulated data are generated under the assump-tion of homogeneous genetic effect, and in Figure 3, Figure 4,Figure S3, andFigure S4, the simulation data are gener-ated under the assumption of heterogeneous genetic effect (Table 4).
When some causal variants are rare and some are common, the GFLM Hom-Rao has higher power than MetaSKAT and MetaSKAT-O for scenarios 1 and 2 and has similar power as MetaSKAT and MetaSKAT-O for scenario 3 in Figure 1 and Figure 3. The GFLM Het-Rao also has higher or similar power Table 5 Empirical type I error rates of Rao’s efficient score test statistics and LRT statistics at differentalevels based on 106simulated data
sets when only rare variants were used to generate genotype data
Type of test Scenario aLevel
Rao’s efficient score test statistics of GFLMs LRT statistics of GFLMs
Basis of both GVF andbℓðtÞ
Basis of b-smooth-only
Basis of both GVF andbℓðtÞ
Basis of b-smooth-only B-spline Fourier B-spline Fourier B-spline Fourier B-spline Fourier
GFLM Het-Rao or
GFLM Het-LRT
Scenario 1 0.05 0.040308 0.041429 0.040307 0.041429 0.107753 0.094461 0.107752 0.094468 0.01 0.006502 0.006787 0.006502 0.006787 0.029244 0.024788 0.029243 0.024790 0.001 0.000442 0.000489 0.000442 0.000489 0.004305 0.003603 0.004305 0.003603 0.0001 0.000024 0.000032 0.000024 0.000032 0.000606 0.000548 0.000606 0.000548 Scenario 2 0.05 0.041607 0.042350 0.041607 0.042349 0.104186 0.090845 0.104186 0.090849 0.01 0.006992 0.007279 0.006992 0.007279 0.027457 0.023561 0.027457 0.023563 0.001 0.000543 0.000574 0.000543 0.000574 0.003972 0.003349 0.003972 0.003349 0.0001 0.000032 0.000041 0.000032 0.000041 0.000570 0.000503 0.000570 0.000503 Scenario 3 0.05 0.042585 0.043306 0.042585 0.043306 0.095901 0.085546 0.095895 0.085547 0.01 0.007270 0.007443 0.007270 0.007443 0.024544 0.021358 0.024543 0.021359 0.001 0.000568 0.000585 0.000568 0.000585 0.003431 0.002897 0.003431 0.002897 0.0001 0.000041 0.000058 0.000041 0.000058 0.000443 0.000395 0.000443 0.000395 GFLM Hom-Rao
or
GFLM Hom-LRT
Scenario 1 0.05 0.046652 0.047087 0.047218 0.047167 0.058747 0.056513 0.058836 0.057511 0.01 0.008560 0.008799 0.008629 0.008713 0.012600 0.012024 0.012507 0.012261 0.001 0.000737 0.000828 0.000775 0.000794 0.001454 0.001364 0.001428 0.001366 0.0001 0.000051 0.000070 0.000066 0.000064 0.000161 0.000144 0.000163 0.000166 Scenario 2 0.05 0.047177 0.047423 0.047544 0.047543 0.058428 0.056090 0.058055 0.057137 0.01 0.008855 0.008809 0.008910 0.008838 0.012636 0.011741 0.012536 0.012229 0.001 0.000760 0.000761 0.000841 0.000783 0.001355 0.001198 0.001440 0.001289 0.0001 0.000071 0.000079 0.000077 0.000069 0.000151 0.000160 0.000174 0.000146 Scenario 3 0.05 0.048264 0.048039 0.048500 0.048655 0.056015 0.054683 0.053643 0.052776 0.01 0.008940 0.008962 0.009228 0.009348 0.011540 0.011083 0.010987 0.010708 0.001 0.000759 0.000769 0.000846 0.000839 0.001173 0.001099 0.001130 0.001081 0.0001 0.000060 0.000064 0.000059 0.000084 0.000122 0.000111 0.000105 0.000116
The results of“Basis of both GVF andbℓðtÞ”were based on smoothing both the GVF and genetic-effect functionsbℓðtÞof model 6, and the results of“Basis ofb
as MetaSKAT and MetaSKAT-O in Figure S1andFigure S3. Therefore, the proposed Rao’s efficient score test statistics have good power performance when some causal variants are rare and some are common. By a comparison of power levels in Figure 1vs.Figure S1and Figure 3vs.Figure S3, the power levels of the GFLM Hom-Rao are generally higher than those of GFLM Het-Rao, which may be due to the large degrees of freedom of the GFLM Het-Rao. The AEM Het-Rao has slightly lower power levels than GFLM Hom-Rao and GFLM Het-Rao but performs well.
When the causal variants are all rare, the GFLM Hom-Rao has slightly lower or similar power levels as MetaSKAT and MetaSKAT-O in Figure 2, Figure 4,Figure S2, andFigure S4. Again, the power levels of the GFLM Hom-Rao in Figure 2 and Figure 4 are generally higher than the corresponding power levels of GFLM Het-Rao inFigure S2andFigure S4. The AEM Het-Rao has low power levels.
In each graph, we comparedfive Rao’s efficient score test statistics: one is based on the additive-effect model (1), two are based on B-spline basis functions, and two are based on Fourier basis functions. In the two Rao’s efficient score test statistics to use B-spline (or Fourier) basis functions, one is to smooth both the GVFs and the genetic-effect function bðtÞ, and the other is only to smooth the genetic-effect function bðtÞ(i.e.,b-smooth-only). The four Rao’s efficient score test
statistics of the GFLMs have similar power. The power levels ofb-smooth-only are almost identical to those of smoothing both the GVFs and genetic-effect function bðtÞ by B-spline basis (or Fourier basis). Thus, the tests do not strongly de-pend on whether the genotype data are smoothed or not. In addition, the Rao’s efficient score test statistics do not strongly depend on which basis functions are used. We also calculated the empirical power levels of the LRT statistics, which provide very similar empirical power levels as the Rao’s efficient score test statistics (data not shown).
Discussion
In this paper, GFLMs are developed to perform a meta-analysis of multiple case-control studies to connect genetic data to dichotomous traits adjusting for covariates. Based on the GFLMs, chi-squared-distributed Rao’s efficient score test and LRT statistics are introduced to test for an association between a complex trait and multiple genetic variants. Extensive simulations are performed to evaluate empirical type I error rates and the power performance of the proposed GFLMs and tests. We show that the proposed Rao’s efficient score test statistics are very conservative. The Rao’s efficient score test statistics have higher power than MetaSKAT when some causal variants are rare and some Table 6 Empirical type I error rates of Rao’s efficient score test statistics and LRT statistics at differentalevels based on 106simulated data
sets when all variants were used to generate genotype data
Type of test Scenario aLevel
Rao’s efficient score test statistics of GFLMs LRT statistics of GFLMs
Basis of both GVF andbℓðtÞ
Basis of b-smooth-only
Basis of both GVF andbℓðtÞ
Basis of b-smooth-only B-spline Fourier B-spline Fourier B-spline Fourier B-spline Fourier
GFLM Het-Rao or
GFLM Het-LRT
Scenario 1 0.05 0.038922 0.040414 0.038922 0.040414 0.070972 0.061845 0.070972 0.061845 0.01 0.006645 0.007022 0.006645 0.007022 0.016140 0.013552 0.016140 0.013552 0.001 0.000518 0.000573 0.000518 0.000573 0.001946 0.001558 0.001946 0.001558 0.0001 0.000041 0.000056 0.000041 0.000056 0.000227 0.000177 0.000227 0.000177 Scenario 2 0.05 0.040400 0.041604 0.040400 0.041604 0.069546 0.061199 0.069546 0.061199 0.01 0.007057 0.007462 0.007057 0.007462 0.015841 0.013613 0.015841 0.013613 0.001 0.000550 0.000665 0.000550 0.000665 0.001863 0.001560 0.001863 0.001560 0.0001 0.000044 0.000041 0.000044 0.000041 0.000208 0.000193 0.000208 0.000193 Scenario 3 0.05 0.040580 0.041450 0.040580 0.041450 0.064665 0.058161 0.064666 0.058161 0.01 0.007031 0.007417 0.007031 0.007417 0.014029 0.012416 0.014029 0.012416 0.001 0.000550 0.000637 0.000550 0.000637 0.001528 0.001390 0.001528 0.001390 0.0001 0.000036 0.000050 0.000036 0.000050 0.000172 0.000156 0.000172 0.000156 GFLM Hom-Rao
or
GFLM Hom-LRT
Scenario 1 0.05 0.045807 0.045358 0.047004 0.046821 0.051164 0.048432 0.052932 0.051544 0.01 0.008605 0.008461 0.008918 0.008894 0.010409 0.009512 0.010960 0.010461 0.001 0.000842 0.000779 0.000852 0.000898 0.001107 0.000938 0.001167 0.001111 0.0001 0.000078 0.000086 0.000069 0.000078 0.000119 0.000110 0.000111 0.000126 Scenario 2 0.05 0.045847 0.045606 0.046779 0.046988 0.050780 0.048540 0.052439 0.051368 0.01 0.008598 0.008638 0.008938 0.009000 0.010240 0.009649 0.010825 0.010428 0.001 0.000768 0.000752 0.000799 0.000821 0.001023 0.000922 0.001080 0.001043 0.0001 0.000074 0.000056 0.000077 0.000072 0.000103 0.000081 0.000132 0.000116 Scenario 3 0.05 0.043291 0.043601 0.043397 0.043609 0.045600 0.045334 0.045182 0.044837 0.01 0.008050 0.008195 0.008154 0.008286 0.008801 0.008745 0.008737 0.008715 0.001 0.000742 0.000790 0.000709 0.000746 0.000873 0.000877 0.000797 0.000805 0.0001 0.000072 0.000061 0.000070 0.000070 0.000084 0.000079 0.000079 0.000078
The results of“Basis of both GVF andbℓðtÞ”were based on smoothing both the GVF and genetic-effect functionsbℓðtÞof model 6, and the results of“Basis ofb
are common. When the causal variants are all rare (i.e., MAF,0.03), the Rao’s efficient score test statistics have sim-ilar or slightly lower power than MetaSKAT. For homogeneous genetic effect models, the GFLM Hom-LRT generates accurate type I error rates. For heterogeneous genetic models, the GFLM Het-LRT may inflate type I error rates owing to large degrees of freedom. The GFLMs and related test statistics can be useful in whole-genome and whole-exome association studies.
The GFLMs and AEM were applied to analyze the genetic data of 22 gene regions of T2D data from a meta-analysis of eight European studies and detected significant associations for 19 genes (P,3.131026), tentative association for 1
gene (P1025), and no association for 2 genes, while
Meta-SKAT detected none. Because the 22 genes are from the lit-erature on T2D showing that each of them contains SNPs that are associated with T2D, the association is confirmed by our
fixed models and related tests for the 19 genes, although MetaSKAT failed to confirm any of the associations. One may note that the European cohorts were analyzed by
Meta-SKAT in Leeet al.(2013), but no results were reported for the dichotomous traits of T2D.
Unlike other methods such as SKAT or MetaSKAT, which are based on mixed-effect models, GFLMs are fixed-effect models, and the genetic effects of multiple genetic variants are assumed to befixed. The formulation of theb -smooth-only model (2) is similar to that of SKAT and MetaSKAT. However, the assumptions are totally different. Specifically, the regression coefficientsbℓof genetic variant terms in the models of SKAT and MetaSKAT are random, while the ge-netic effectsbℓðtℓjÞin model 2 arefixed unknown functions.
Our GFLMs are a natural extension of traditional population genetics without a polygenic term because we consider the population data. By using functional data-analysis tech-niques, we develop procedures to estimate the genetic-effect functionsbℓðtÞ and introduce test statistics to test for an association.
contribution of major gene loci to be random, and then the mixed models of SKAT and MetaSKAT can be valid. In our power comparison, we found that the proposed Rao’s efficient score test statistics have similar or slightly lower power than Meta-SKAT when the causal variants are all rare. However, the pro-posed Rao’s efficient score test statistics have higher power than MetaSKAT when some causal variants are rare and some are common (in this case, it is likely that the effects of a few genetic variants of the major gene locus are large, sofi xed-effect models perform well). It is noteworthy that this paper deals with dichotomous traits. For quantitative traits, it was found that functional linear models lead to bothF- and chi-squared-distributed score test statistics that are more powerful than SKAT and MetaSKAT (Luoet al.2012; Fanet al.2013).
In the proposed models and tests, we do not make any assumptions about whether the genetic variants are rare or common variants or a combination of the two. The proposed models are veryflexible and can analyze rare or common variants or a combination of the two. We do assume that the number of genetic variants in a genetic region is large, which is true for
modern genetic data. When a large number of genetic variants are available in a genetic region, estimation of the GVF is accurate, which makes our GFLMs very reliable. In our simulation and data analysis, models 2 and 4 perform very close to each other.
In Fan et al. (2013, 2014), we investigated the perfor-mance of the mixed models by making the regression coeffi -cientsbof genetic-effect function random in the frameworks of our functional regression models. It was found that the mixed models perform well only when the causal genetic variants are all rare and the traits are dichotomous (for rare variants, we used an artificial cutoff of 0.03). For most dis-eases, the causal variants can be both rare and common. Because the proposed models are very flexible in analyzing rare or common variants, we focus onfixed-effect models in this paper. In our simulations, we treat the regression effect of covariates as heterogeneous. We also investigate the perfor-mance of the proposed models by treating the regression effect of covariates as homogeneous, and we find that the results are similar in terms of empirical power performance and type I error rates.
For small- and moderate-sample-size single studies when the sample sizes are smaller than or equal to 2000, the LRT statistics of GFLMs were found to inflate the type I error rates, while chi-squared-distributed Rao’s efficient score test statis-tics control type I error rates correctly (Fan et al. 2014). Hence, Rao’s efficient score test statistics were recommended for small- and moderate-sample-size single studies. In this paper, we show that Rao’s efficient score test statistics control the type I error rates correctly when the sample sizes of com-bined multiple studies are large. For homogeneous genetic-effect models, the LRT statistics were found to have correct type I error rates; for heterogeneous genetic-effect models, the LRT statistics inflated the type I error rates. Therefore, one needs to be cautious about using LRT statistics for di-chotomous traits. For quantitative traits, both the LRT and F-distributed statistics have correct type I error rates and good power performance for a sample with a sample size$ 1500 (Fanet al.2013).
The proposed method requires individual genotype data and is more powerful than MetaSKAT and MetaSKAT-O when genotype data are available from all studies. However, the
proposed method cannot meta-analyze summary statistics. If only summary statistics of GFLMs are available from different studies using Fanet al.(2014), it is still an open question as to how to use them for a meta-analysis.
Acknowledgments
Human Development, National Institutes of Health (R.F., Y.W., and C.-y.C.), by NIH grants EY024226 and R01-HG007358 (to W.C.), by the University of Pittsburgh (R.F. is an unpaid collaborator on grant R01-EY024226), by NIH grants R01-HG006292 and R01-HG006703 (to Y.L.), and by NIH grants LM-009012 and LM-010098 (to J.H.M).
Literature Cited
Cordell, H. J., and D. G. Clayton, 2002 A unified stepwise regres-sion procedure for evaluating the relative effects of polymor-phisms within a gene using case/control or family data: application to HLA in type 1 diabetes. Am. J. Hum. Genet. 70: 124–141.
de Boor, C., 2001 Applied Mathematical Sciences 27: A Practical Guide to Splines, Rev. Ed. Springer, New York.
Evangelou, E., and J. P. A. Ioannidis, 2013 Meta-analysis methods for genome-wide association studies and beyond. Nat. Rev. Genet. 14: 379–389.
Fan, R. Z., Y. F. Wang, J. L. Mills, A. F. Wilson, J. E. Bailey-Wilson et al., 2013 Functional linear models for association analysis of quantitative traits. Genet. Epidemiol. 37: 726–742.
Fan, R. Z., Y. F. Wang, J. L. Mills, T. C. Carter, I. Lobach et al., 2014 Generalized functional linear models for case-control as-sociation studies. Genet. Epidemiol. 38: 622–637.
Fan, R. Z., Y. F. Wang, M. Boehnke, W. Chen, Y. Li et al., 2015 Gene level meta-analysis of quantitative traits by func-tional linear models. Genetics 200: 1089–1104.
Fan, R. Z., Y. F. Wang, Y. Qi, Y. Ding, D. E. Weeks et al., 2016 Gene-based association analysis for censored traits via functional regressions. Genet. Epidemiol. (in press).
Ferraty, F., and Y. Romain, 2010 Oxford Handbook of Functional Data Analysis. Oxford University Press, New York.
Fisher, R. A., 1918 The correlation between relatives on the sup-position of Mendelian inheritance. Philos. Trans. R. Soc. Edinb. 52: 399–433.
Han, F., and W. A. Pan, 2010 Data-adaptive sum test for disease association with multiple common or rare variants. Hum. Hered. 70: 42–54.
Hindorff, L. A., P. Sethupathy, H. A. Junkins, E. M. Ramos, J. P. Mehtaet al., 2009 Potential etiologic and functional implications of genome-wide association loci for human diseases and traits. Proc. Natl. Acad. Sci. USA 106: 9362– 9367.
Horváth, L., and P. Kokoszka, 2012 Inference for Functional Data with Applications. Springer, New York.
Hu, Y. J., S. I. Berndt, S. Gustafsson, A. Ganna Genetic Investi-gation of Anthropometric Traits (GIANT) Consortiumet al., 2013 Meta-analysis of gene-level associations for rare var-iants based on single-variant statistics. Am. J. Hum. Genet. 93: 42–53.
International HapMap Consortium, 2007 A second generation hu-man haplotype map of over 3.1 million SNPs. Nature 449: 851–861.
Lee, S., M. J. Emond, M. J. Bamshad, K. C. Barnes, M. J. Rieder et al., 2012 Optimal unified approach for rare-variant associa-tion testing with applicaassocia-tion to small-sample case-control whole-exome sequencing studies. Am. J. Hum. Genet. 91: 224–237.
Lee, S., T. M. Teslovich, M. Boehnke, and X. Lin, 2013 General framework for meta-analysis of rare variants in sequencing as-sociation studies. Am. J. Hum. Genet. 93: 42–53.
Li, B., and S. M. Leal, 2008 Methods for detecting associations with rare variants for common diseases: application to analysis of sequence data. Am. J. Hum. Genet. 83: 311–321.
Li, S., B. Mukherjee, J. M. G. Taylor, K. M. Rice, X. Wen et al., 2014 The role of environmental heterogeneity in meta-analysis of gene-environment interactions with quantitative traits. Genet. Epidemiol. 38: 416–429.
Liu, D. J., G. M. Peloso, X. Zhan, O. L. Holmen, M. Zawistowski et al., 2014 Meta-analysis of gene-level tests for rare variant association. Nat. Genet. 46: 200–204.
Luo, L., E. Boerwinkle, and M. Xiong, 2011 Association studies for next-generation sequencing. Genome Res. 21: 1099–1108. Luo, L., Y. Zhu, and M. Xiong, 2012 Quantitative trait locus
anal-ysis for next-generation sequencing with the functional linear models. J. Med. Genet. 49: 513–524.
Luo, L., Y. Zhu, and M. Xiong, 2013 Smoothed functional princi-pal component analysis for testing association of the entire al-lelic spectrum of genetic variation. Eur. J. Hum. Genet. 21: 217– 224.
Madsen, B. E., and S. R. Browning, 2009 A groupwise association test for rare mutations using a weighted sum statistic. PLoS Genet. 5: e1000384.
Morris, A. P., and E. Zeggini, 2010 An evaluation of statistical approaches to rare variant analysis in genetic association stud-ies. Genet. Epidemiol. 34: 188–193.
Morris, A. P., B. F. Voight, T. M. Teslovich, T. Ferreira, A. V. Segre et al., 2012 Large-scale association analysis provides insights into the genetic architecture and pathophysiology of type 2 di-abetes. Nat. Genet. 44: 981–990.
Neale, B. M., M. A. Rivas, B. F. Voight, D. Altshuler, B. Devlinet al., 2011 Testing for an unusual distribution of rare variants. PLoS Genet. 7: e1001322.
Price, A. L., G. V. Kryukov, P. I. W. de Bakker, S. M. Purcell, J. Staples et al., 2010 Pooled association tests for rare variants in exon-resequencing studies. Am. J. Hum. Genet. 86: 832–838. Ramsay, J. O., and B. W. Silverman, 2005 Functional Data
Anal-ysis, Ed. 2. Springer, New York.
Ramsay, J. O., G. Hooker, and S. Graves, 2009 Functional Data Analysis with R and Matlab. Springer, New York.
Ross, S. M., 1996 Stochastic Processes, Ed. 2. Wiley, New York. Schaffner, S. F., C. Foo, S. Gabriel, D. Reich, M. J. Daly et al.,
2005 Calibrating a coalescent simulation of human genome sequence variation. Genome Res. 15: 1576–1583.
Scott, R. A., V. Lagou, R. P. Welch, E. Wheeler, M. E. Montasser et al., 2012 Large-scale association analyses identify new loci influencing glycemic traits and provide insight into the under-lying biological pathways. Nat. Genet. 44: 991–1005.
Stahl, E. A., S. Raychaudhuri, E. F. Remmers, G. Xie, S. Eyreet al., 2010 Genome-wide association study meta-analysis identifies seven new rheumatoid arthritis risk loci. Nat. Genet. 42: 508–514. Voight, B. F., L. J. Scott, V. Steinthorsdottir, A. P. Morris, C. Dina et al., 2010 Twelve type 2 diabetes susceptibility loci identified through large-scale association analysis. Nat. Genet. 42: 579–589. Vsevolozhskaya, O. A., D. V. Zaykin, M. C. Greenwood, C. Wei, and Q. Lu, 2014 Functional analysis of variance for association studies. PLoS One 9: e105074.
Wang, Y. F., A. Y. Liu, J. L. Mills, M. Boehnke, A. F. Wilsonet al., 2015 Pleiotropy analysis of quantitative traits at gene level by multivariate functional linear models. Genet. Epidemiol. 39: 259–275.
Wu, M. C., S. Lee, T. Cai, Y. Li, M. Boehnke et al., 2011 Rare-variant association testing for sequencing data with the se-quence kernel association test. Am. J. Hum. Genet. 89: 82–93. Zeggini, E., and J. P. A. Ioannidis, 2009 Meta-analysis in
genome-wide association studies. Pharmacogenomics 10: 191–201. Zeggini, E., L. J. Scott, R. Saxena, B. F. Voight, J. L. Marchiniet al.,
2008 Meta-analysis of genome-wide association data and large-scale replication identifies additional susceptibility loci for type 2 diabetes. Nat. Genet. 40: 638–645.
Zhang, F., E. Boerwinkle, and M. Xiong, 2014 Epistasis analysis for quantitative traits by functional regression models. Genome Res. 24: 989–998.
GENETICS
Supporting Information
www.genetics.org/lookup/suppl/doi:10.1534/genetics.115.180869/-/DC1
Meta-analysis of Complex Diseases at Gene Level
with Generalized Functional Linear Models
Ruzong Fan, Yifan Wang, Chi-yang Chiu, Wei Chen, Haobo Ren, Yun Li, Michael Boehnke, Christopher I. Amos, Jason H Moore, and Momiao Xiong