ABSTRACT
NAGAPPAN, MEIYAPPAN. A Framework for Analyzing Software System Log Files. (Under the direction of Mladen A. Vouk.)
Ability to perform large scale data analytics is fueling collection of a variety of data streams from complex production systems, like the provenance of data, performance statistics, and user statistics, in order to analyze them for specific purposes. Log files are a typical example of such a data stream. Logs are often a record of the execution activities in production systems where the data recorded is intentionally chosen by the developer as useful information. Analyzing log files is an important activity in software engineering, and now in cloud engineering. The data from the log files can be analyzed to guide product related decisions. For example logs can be used to find ordinary and security related problems, define operational profiles, and even pro-actively prevent issues (in support of fault tolerance).
It is the premise of this work that current log analysis methods are too ad hoc and do not scale well enough to be effective in the domain of large logs (such as those we might expect in a computational cloud system). The more complex the system, the more complex and voluminous its logs are. In this dissertation we investigate, identify and develop components needed for an adaptable end-to-end framework for the analysis of logs. The framework needs to take into consideration that different users look for different kinds of information in the same log files. Required are adaptable techniques and algorithms for efficient and accurate log data collection, log abstraction and log transformations. The techniques or algorithms that are used in each component of the framework will vary according to the application, its logging mechanisms and the information that the stake holder needs to make decisions.
Some of the questions of interest are:
What information is required by the developers to make the decisions they want to, and which analysis technique can build that information? To what form can the logs be transformed, so that we can get this information (required in the previous question) efficiently and accurately? How to abstract the semi structured log lines to log events so that the above transformations can be made efficiently and accurately? How can we collect a rich set of data in the log files to begin with so that we can provide better results to the developers?
We discuss a concrete instantiation of the framework (i.e. specific solutions for each com-ponent) and explain the context in which it is used. Throughout the dissertation we have used the log files from the cloud computing infrastructure at North Carolina State University, called the ‘Virtual Computing Laboratory’ (VCL) (see Appendix A for more details).
identifying the most frequent and least frequent set of events (operational profile) by using two different analysis techniques.
Our approach involves transforming the log files using either suffix array data structure or a weighted directed cyclic graph data structure. The current state of the art in building operational profiles from log files offers only semi automated or manual approaches. Using these two transformations, we were able to get the actual usage frequency of VCL use cases, in a automated, linearly scaling approach.
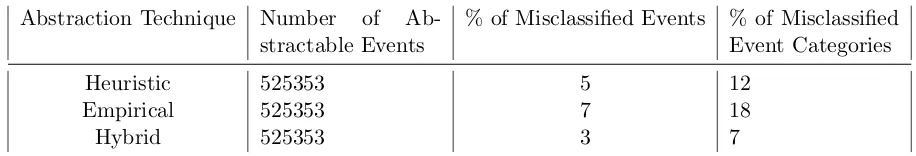
In order to build these transformations we had to abstract the semi structured log messages to specific log events. The current state of the art in abstracting semi structured logs involves either using regular expressions, which takes a long time, but provides accurate results, or using heuristic approaches that are much faster but provided poorer accuracy. We propose an empirical approach, in addition to the heuristic approach, to maintain the speed but improve the accuracy. We were able to reduce the inaccuracies in abstraction by half (down from 5% to 3%,) as compared to the pure heuristic based approaches, when we used a hybrid approach. In the case of large logs, this can represent a considerable improvement. For example, in the VCL case this improved the abstraction accuracy of about 16,000 events in a daily log file.
©Copyright 2011 by Meiyappan Nagappan
A Framework for Analyzing Software System Log Files
by
Meiyappan Nagappan
A dissertation submitted to the Graduate Faculty of North Carolina State University
in partial fulfillment of the requirements for the Degree of
Doctor of Philosophy
Computer Science
Raleigh, North Carolina
2011
APPROVED BY:
Laurie Williams Matthias Stallmann
DEDICATION
To the people whose works have inspired me along the way to be a better person, Mohandas Karamchand Gandhi,
George Denis Patrick Carlin, Shivaji Rao Gaekwad, and
BIOGRAPHY
ACKNOWLEDGEMENTS
This dissertation would not have been possible without the help of a lot of people with whom I have had the good fortune to interact with. I would like to take this opportunity to thank them:
• Appa and Amma (my parents), for constantly encouraging me in all of my endeavors. Thank you for providing me with the best at every stage in my life!
• Dr.Vouk (my academic parent) for advising me on not only this dissertation topic, but also on guiding me to identify and do good research.
• Dr.Shoshani, Dr. Wu, and Dr.Sim of Lawrence Berkeley National Labs got me interested in this field of research. For that and their invaluable advice and help during the initial stages of this research, I thank them.
• Everybody at the SDM center for supporting me on this research.
• Dr. Robinson, Andrew Cordes, Will Snipes, Patrick Francis, Dr. Augustine, and Dr.Acharya at ABB Research and Dr.Murphy, Dr.Nori, and Dr.Zimmermann at Microsoft Research, for giving me some fresh ideas in this research topic.
• Aaron Peeler, Andy Kurth, Josh Thompson and the rest of the VCL team at NCSU for providing me with the log files necessary for this research as well as helping me out with all things VCL related.
• Dr. Williams, for her support throughout my time at NCSU and for being a wonderful person to work with.
• Dr.Stallmann and Dr.Devetsikiotis for agreeing to be my committee members and keeping me on track.
• Dr.Xie, Dr.Thuente, Dr.Samatova, Dr.Reeves, Dr.Honeycutt, Dr.Hill, Dr.Heber, and Dr.Bitzer, for their insightful discussions on both research and career paths.
• The wonderful staff in the CSC department, namely, Ms.Allen, Ms. Coates, Ms.Cook, Mr.Fullmer, Mr.Hartis, Ms.Honeycutt, Ms.Hunt, Ms.Page, Ms.Peaslee, Mr.Sleeth, and Ms.Watkins for making every administrative activity so smooth and easy.
• Lucas for being the Senior Researcher of our lab by answering any research related ques-tions we had and being constructively critical of my work and for making very hard puzzles for us to figure out where we were headed to for lunch.
• Andy for being the ideal student and constantly setting the milestones for me.
• Aaron, Ben and Prasanth for the many insightful discussions I have had with them.
• Ayla, Dright, Gurleen, Jeff, Jeremy, Jessica, Jiang, Kristy, Kunal, Lauren, Mark, Paul, Pierre, Ramya, Raza, Roselyne, Sarah, Stephen, Suresh, and Yonghee, for all the research and non research discussions we have had in and out of the lab.
• All the 326 students who I TA’ed. They graduated before me, took up great jobs and constantly reminded me that you don’t have to be a graduate student to succeed.
• M. Kothandaraman, Harifa Begum, and Sankari Srinivasan, my teachers in primary and high school, for making math and computer science cool and easy to learn.
• This research was funded in part by the DOE grants DE-FC02-ER25809, and DE-AC02-05CH11231.
I would also like to take this opportunity thank my friends (outside the Software Engineer-ing Research community) who made sure that I never missed home
• Roommates: Srini, Shalaka, Sayantan, Sami, Ravi, Pratheek, Pakshi, Pachu, Kat, Dee, Akshay, Adi.
• Neighbors: Vinod, Swanand, Suresh, Sid, Rajeev, Pradeep, Krish, Karthik, Jay, Dinesh, Apu, Abhi.
• Two Cents of Hope: Vinod, Subbu, Chetan, Vinay, Pushpa, Mithun, Shruti, Kiran, Sowmya, Kishore, Rachitha, Suraj Kasi, Sanath, Priyanka, Tanu, Naren, Naga, Krishna, Logu, Sunil, Ranjith, Viren, Kamal, Suraj, Ramya, Kiran, Arjun, Narayan, Vishwesh, Veda, Vikram, Raveesh, Kirik and everyone else that I missed.
• STARS: Mark, Lucy, Kamar, Jen, Jasmine, Anne, Don, Veronica and other STARS mem-bers.
• Undergrad: Udayshankar, Ram, Rajesh, Pratap, Koushik, Dhiku, Shruti, Mithra.
I would like to thank Sowmya and Pradeep who were my mom and dad’s representatives here in Raleigh making sure I was doing OK. I would also like to thank Sekar and Suja for being wonderful hosts, when I was stranded in Berkeley. Likewise I would like to thank Akshay and Amrita for being wonderful hosts while I was at Cambridge. I would also like to thank Chidambaram, Priya and their two kids for all the help they have extended to me in Raleigh. A lot of family and friends, namely Ashok, Jaya, Nachu, Radha, Palani and Divya, have hosted me in their homes over the last 5 years and made me feel very welcome in a new city. I would like to take this opportunity to thank them too.
I would like to thank Anna, Meena Akka, Nacha, and Rachana who regularly fed me “great home cooked” food.
I would also like to thank Prem and Divya who made me feel a part of their family. I can’t thank you enough for how welcome you have made me feel.
I would also like to thank Aiyya(my grandpa) for all the (snail mail) letters that you have written over the last 5 years. Every letter I got from you made my day better than it already was.
TABLE OF CONTENTS
List of Tables . . . ix
List of Figures . . . x
Chapter 1 Introduction . . . 1
1.1 Framework - Log Collection . . . 3
1.2 Framework - Log Abstraction . . . 4
1.3 Framework - Log Transformations . . . 5
1.3.1 Suffix Array . . . 6
1.3.2 Log Visualization . . . 6
1.4 Framework - Analysis Techniques . . . 7
Chapter 2 Related Work . . . 9
2.1 Log Collection . . . 9
2.2 Log Abstraction . . . 10
2.2.1 Regular Expression Based Abstraction . . . 11
2.2.2 Clustering Based Abstraction . . . 12
2.2.3 Heuristic based Abstraction . . . 12
2.3 Deriving Operational Profiles . . . 13
2.3.1 Manual Operational Profiling . . . 13
2.3.2 Commercial Pattern Recognition Tools . . . 14
2.3.3 Compression Algorithm Based Operational Profiling . . . 15
2.3.4 Clustering Based Operational Profiling . . . 15
2.3.5 Log Visualization . . . 15
Chapter 3 Log Collection using Adaptive Logging . . . 17
3.1 Introduction . . . 17
3.1.1 Contributions . . . 18
3.2 Our Approach . . . 18
3.2.1 Logging Information from the Source Code . . . 19
3.2.2 Decision Engine . . . 20
3.2.3 Adaptive Logging by Inspection . . . 21
3.3 Experiments and Results . . . 22
3.4 Complexity Analysis . . . 25
3.5 Conclusion . . . 26
Chapter 4 Log Abstraction using Empirical Frequency Analysis . . . 27
4.1 Introduction . . . 27
4.1.1 Contributions . . . 28
4.2 Our Approach . . . 28
4.3 Results and Discussion . . . 30
4.5 Conclusion . . . 37
Chapter 5 Operational Profiling Using Suffix Arrays . . . 38
5.1 Introduction . . . 38
5.1.1 Contributions . . . 39
5.2 Suffix Arrays . . . 40
5.3 Our Approach . . . 41
5.3.1 Log Abstraction . . . 41
5.3.2 Construct SA and LCP . . . 43
5.3.3 Find Patterns . . . 43
5.4 Algorithm Analysis . . . 45
5.4.1 Complexity Analysis . . . 45
5.4.2 Correctness . . . 47
5.5 Results . . . 48
5.5.1 VCL Logs . . . 49
5.5.2 Discussion . . . 51
5.6 Conclusion . . . 52
Chapter 6 Operational Profiling using Weighted Directed Graphs . . . 54
6.1 Introduction . . . 54
6.1.1 Contributions . . . 55
6.2 Our Approach . . . 56
6.2.1 Example . . . 57
6.2.2 Operational Profiling . . . 59
6.3 Results and Discussion . . . 60
6.4 Complexity Analysis . . . 64
6.5 Conclusion . . . 66
Chapter 7 Conclusions and Future Work . . . 67
References. . . 69
Appendix . . . 73
Appendix A Virtual Computing Laboratory . . . 74
A.0.1 VCL Management Node Log Format . . . 75
LIST OF TABLES
Table 1.1 Analysis Techniques and Corresponding Users . . . 7
Table 3.1 Event Statistics of the 9 VCL log Files . . . 23
Table 3.2 Adaptive Logging Simulation Results . . . 25
Table 4.1 Frequency table of the words after Data Summary Step . . . 29
Table 4.2 Frequency of the words in the log line ‘Start processing for Jen user’ after Frequency Lookup Step . . . 30
Table 4.3 Log Files used in the Analysis . . . 31
Table 4.4 Accuracy of Heuristic Abstraction Technique . . . 32
Table 4.5 Accuracy of Empirical Abstraction Technique . . . 33
Table 4.6 Accuracy of Two Step Hybrid Abstraction Technique . . . 33
Table 4.7 Summary of Heuristic, Empirical, and Hybrid Approaches . . . 34
Table 5.1 Example: SA of the text ”abracadabra” and the LCP . . . 40
Table 5.2 VCL Log Data. Total number of events covered is 5,500,000. . . 49
Table 5.3 The Operational Profile Collected from VCL Logs . . . 50
LIST OF FIGURES
Figure 1.1 A Framework for Analyzing Log Files . . . 3
Figure 3.1 Adaptive logging using a Prediction Engine . . . 21
Figure 5.1 Main steps in our approach . . . 42
Figure 5.2 Operational Profile from LCP and SA . . . 44
Figure 5.3 Examples of Log Entries from VCL . . . 48
Figure 5.4 Execution Time vs. Number of events in VCL log. ¯k is shown next to each data point. . . 50
Figure 6.1 Weighted Directed Graph of the Log File . . . 58
Figure 6.2 Results (Use Case 1) from Operational Profiling the VCL system by build-ing the WDG of its Log File . . . 61
Figure 6.3 Results (Use Case 2) from Operational Profiling the VCL system by build-ing the WDG of its Log File . . . 62
Figure 6.4 Results (Use Case 3) from Operational Profiling the VCL system by build-ing the WDG of its Log File . . . 63
Figure 6.5 Results (Use Case 4) from Operational Profiling the VCL system by build-ing the WDG of its Log File . . . 65
Figure A.1 Cloud Computing Architecture . . . 75
Figure A.2 VCL Architecture . . . 75
Figure A.3 Partial Structure of VCLd (or MN) Log Record . . . 76
Chapter 1
Introduction
Modern software-based systems collect information about their activity and history in logs. The information in the logs can then be used to analyze system’s activities. Information can come from single files, collections of files, databases, or streams of data from sensors, network interfaces, and continuous monitoring devices and software solutions. The term ‘to log’ is analogous to making entries in a logbook and may involve recording of only a portion of the data deemed needed or useful. The information in the logs typically consists of timestamps, descriptions of events or actions, system state information and/or error information. Each log record or entry may also contain user information, and application information. Logs are most often collected for the purpose of system monitoring, system debugging, identifying security and privacy violations and fault diagnostics. Examples of latter are: fault diagnosis, fault detection by monitoring [7, 18], fault isolation [26], fault prediction [37], operational profiling [19, 33] etc. Numerous tools and techniques are available to carry out log analytics [17]. The potential applications are constantly increasing as noted by Oliner and Stearley [35].
The goals of this research are
• To better understand large-scale logging processes (provenance, meta-data), and identify the various steps required to analyze log files to provide useful information to developers and decision makers.
• Build an adaptable end-to-end framework for facilitation of log data collection, mining and analysis.
• Explore and provide a set of solutions (tools, techniques, and algorithms) for each com-ponent/subsystem of the framework.
• Discuss other solutions available in the literature and perform comparative analysis with the solution proposed in this dissertation.
A significant amount of activity needs to precede successful data mining of log files. This includes log data collection, log abstraction (or reduction of information to more canonical or generic structures and concepts), and formatting of the data for use by analytics engines. Currently, most of these activities are specific to a particular system or application, and often they are conducted in a very ad hoc manner.
We propose to decompose the principal log management and analysis task groups and build a log analysis framework, (see Fig. 1.1) into which individual tools and techniques from each of these phases can be plugged into and allowed to interact through common application interfaces. Of course, the concept of collection or abstraction or analysis of log files is not a new one. Sophisticated analytics - simple abstraction: In the literature there are numerous log analysis techniques, each one with their own abstraction approach [33, 37, 45]. While the analyzes techniques tend to be highly sophisticated, the abstraction processes are usually very simple. Unfortunately, often simple abstraction techniques may not work beyond the specific application they have been designed for. Sophisticated abstraction - simplistic analytics: On the other end of the spectrum are tools like Spunk [7], and Swatch [18] that have highly sophisticated algorithms to extract and abstract the information from the log files, but the analytics they offer are simplistic. In addition to developing new and more efficient algorithms for each component, we intend to document the best combination of new and existing tools for each component of our framework for a specific software engineering decision. In this dissertation, as an example and case study, we specifically discuss the Operational Profiling of the VCL system from its log files.
Figure 1.1: A Framework for Analyzing Log Files
we need to collect information in the log file intelligently. Hence the first component of our framework is the ‘log collection’ subsystem. Then we need to abstract the log message (a semi structured string), to its corresponding event type. That is, identify that two or more instances of an event in the log file are recognized and coded to the same event type in the code. Abstracting log messages to event types reduces the noise in the log file. Thus the second component of the framework is the ‘log abstraction’ component. Now that we have abstracted the messages to events, we transform the sequence of events in the log file to a suitable data structure for analysis. In our case we transform the log file to either a ‘suffix array’ data structure or a ‘weighted directed cyclic graph’ data structure so that we can extract the operational profile of VCL.
The following subsections give a brief introduction to each component of the framework in Fig 1.1.
1.1
Framework - Log Collection
collecting more or less log lines, when the same piece of code is executed. We call this adaptive logging and it is discussed in Chapter 3.
Related research goals are:
• To develop an adaptive logging technique that collects information in the log files based on the context of the execution.
• To perform an evaluation of our adaptive logging technique using simulations and data from real logs.
• To evaluate the performance of our approach.
1.2
Framework - Log Abstraction
The second component in our framework is the log abstraction subsystem. This is where we have tools and techniques to abstract the data in the given log file to a common format or event type. The motivation for log abstraction is that, often a log file contains a lot of information that comes from dynamic run time changes. Some examples are IP-addresses, port numbers, process identifiers etc. Also in this category are timestamp fields, static message type fields, and variable parameter fields. While that information, of course, is useful it also makes it very diverse. It is possible to make the log structure more canonical by abstracting some of the specificity and variability. The presence of the variable parameter fields makes it difficult to reason about the data in an automatic fashion. So construction of a higher level conceptual data element may be helpful. An example in the network traffic space is ’flows’. A TCP flow log consists of source and destination IP numbers, port numbers, time stamps, direction, payload size, etc. Talking about such flows may be more useful for identification of security issues than talking about individual IP numbers or port numbers.
Data mining algorithms perform poorly if there is too much noise. Therefore, tools and techniques may be required to smooth the ‘noise’ and abstract each line in a log file to a unique message type. One can recognize two types of ‘noise’. The first one is variable parameter information mentioned above. The second type is a sequence of events that always happens together (e.g., a “flow” always has source followed by destination). For analysis, such event-based clusters can be more useful and more efficient, than individual events, as the log files can often have a great deal of information.
frequently occurring set of events. These algorithms are used to smooth the data, i.e., reduce the ‘noise’ in the log files. This component of the framework translates each log message to a unique message type so that different analysis algorithms can operate on it.
In this dissertation we observed that, Vaarandi [41] and Jiang et al [22] come to the same conclusions about the properties of messages in each log line. We agree with their conclusions and exploit these properties to abstract free form log lines. The key property we exploit is that if a particular event occurs in multiple places in a log file with different values for its parameter field, then the static parts of the log line, i.e the words in the message type field will occur many times whereas the variable values will occur fewer times as compared to the static words.
Related research goals are:
• To take an extensive look at the research related to log file abstraction to identify the assumptions behind each of those solutions. We intend to clearly define the circumstances under which our solution would out-perform other solutions, for example in the case of semi-structured logs with no access to source code.
• To propose a new solution to abstract semi structured log files in linear time, by exploiting the frequency of occurrence property in log files.
• To derive the time complexity of the algorithm.
• To calculate the accuracy of our solution in comparison with other solutions.
1.3
Framework - Log Transformations
Once the log lines in the log files are abstracted to log events, we transform them to a specific data structure that would make the analysis of this data more efficient and accurate. In this dissertation we transform the events to a suffix Array and a weighted directed graph data structure.
Related research goals are:
• To find a solution that determines the occurrence probability of sequences of events - high occurrence probability events and low occurrence probability events. Most other solutions provide only the probability of the most frequently occurring events [19].
• To build an automated solution that does not require users to tune any parameters.
• To estimate the performance and derive the complexity of our approach.
In the following two subsections we briefly discuss the two transformations we perform in this dissertation research.
1.3.1 Suffix Array
In Chapter 5 we discuss how we built the Suffix Array (SA) and Longest Common Prefix (LCP) array of the abstracted log file. Using these data structures we are able to very efficiently calculate the frequency of every sequence of event patterns. Theoretical analysis of the space and time complexity of our algorithm shows an almost linear scaling. We experimentally evaluated this claim using VCL logs. We conducted an interview with the VCL Program Manager to evaluate the accuracy and utility of the technique. Some of the sequence of events that our algorithm produced (in the most frequently occurring sequences category) was expected to be frequently occurring sequences. However to the surprise of the manager some other tasks featured in the top ten frequent sequences were not. They were able to optimize the system based on our results. Our algorithm also picked out the least frequently occurring events. The program manager used these results to test system scheduling algorithms further.
1.3.2 Log Visualization
In Chapter 6 we discuss how we transformed the sequence of events in flat log files to a graph. Every line in the log file is first abstracted to a static message type and a variable parameter type. In our graph each unique event is a node i.e., each static message type will be represented as a node. A directed edge exists from one node to another if the latter occurs immediately after the former in the log file. The edge is labeled with the parameter value. If we don’t consider the parameter value then an unlabeled but directed edge will exist from one node to another. We also keep track of the number of times an edge between two nodes is created as a weight on the edge. In reality we don’t create an edge if is already exists, we just increment its weight. We used the adjacency matrix to represent the resulting graph. The transformation can be done in O(N log(M)) time, where M = No:of unique events, andN = No:of log lines. In a given applicationM is a constant, albeit a large one.
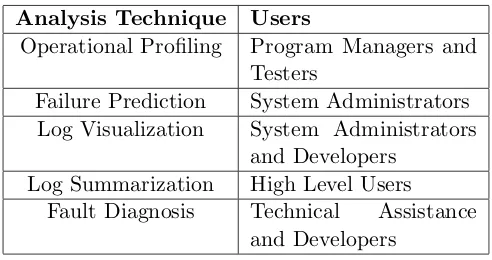
Table 1.1: Analysis Techniques and Corresponding Users
Analysis Technique Users
Operational Profiling Program Managers and Testers
Failure Prediction System Administrators Log Visualization System Administrators
and Developers Log Summarization High Level Users
Fault Diagnosis Technical Assistance and Developers
graph. For this we convert the graph we have in the data structure into a file in dot format1, which can be used to create a very visually intuitive graph.
1.4
Framework - Analysis Techniques
In their research Hamou-Lhadj and Lethbridge [17], present a variety of trace exploration tools and techniques that are used to analyze the information in the log files. Different users have different needs, so we first define the classes of users. They are i) high level users of a system who generally do not look into a log file, ii) system administrators who look into the log file to find a workaround for the failure that the high level users have faced, iii) the technical assistance people or developers who want to find the root cause of a problem to either provide a solution for the system administrators or fix the bug in the source code. Table 1.1 gives examples of the analysis techniques, and the kinds of users that would need it.
In this dissertation we look into how we can build an operational profile from the log files. The operational profile provides the developers with information on decisions regarding, regression testing, performance improvement, feature selection etc.
Organization of the Dissertation
In Chapter 2 we discuss the other research projects that are related to the various components of our research. In Chapter 3, we discuss the log collection component of our framework and the technique we used for intelligent logging. In Chapter 4 we discuss the technique we used in the log abstraction component of the framework. In Chapter 5, we explain the suffix array based operational profiling technique and in Chapter 6 we discuss the weighted directed cyclic
1
Chapter 2
Related Work
2.1
Log Collection
Existing systems like the VCL or Apache servers have their own multi-level logging system. The log4j [5] logging service is used to log messages in Apache. The levels of logging can be changed without modifying the application binary. This is the way logging in VCL [10] also works [38]. But in these systems, the level of logging has to be set before the application is started or deployed. The level cannot be changed at run time. We use the tagging that is used in these techniques to differentiate the different levels of the log messages. But we allow for change in the levels of logging at run time dynamically.
The transaction logs in SQL Server 2000 [9] employ a different kind of adaptive logging. These logs are used to keep track of a transaction, so that it can be reverted if required. The transaction logs need not be of a persistent nature. Hence in this solution, they divide the physical log file into virtual log blocks. They employ a cyclic rotation method and truncate the virtual logs as and when the transaction logs are no longer required. In systems like VCL [10] that employ a log rotation policy, the logs are backed up before they are overwritten. But here the logs are not backed up as they don’t need them after a transaction has been completed.
recomputed during replay itself. So the only log messages they collect are the messages that would take a significant amount of time to recompute. These are ones that would most likely create a domino effect. They define a domino effect as one that would push back the execution of the program to a state well beyond the last checkpoint. Thus by logging these domino effect inducing log messages they can avoid the possible time loss. The remaining messages are recomputed from these messages by re-execution. So in their algorithm they try to detect such domino effect inducing log messages and save them to a file. In their experiments they were able to reduce the number of messages to just 1-10% of the original log message count. But there solution of reducing log messages would work only on message passing programs and not on all applications. Also we cannot dynamically increase the amount of logs collected. They just inteeliegntly avoid logging most of the information. In our approach we try to provide a generic solution that can scale up and scale down the amount of logs collected.
The research by Brecher and Rudolf [12] and Du, Zhao and Le [14] on adaptive logging and dynamic logging respectively should not be confused with our research event though the names are similar. We express clearly that these research works are not related so as to avoid confusion. We include them none the less, to let the readers know that the same terms could be used in different contexts.
In their work, Brecher and Rudolf [12] collect logs from the monitoring and collision avoid-ance systems of machine tools. They use these logs to monitor characteristics of these tools in order to adapt the correction models of the collision avoidance systems. Du, Zhao, and Le [14], in their paper, propose a dynamic logging approach for a DBMS on a flash memory. Since there is no seek delay in a flash memory, they contend that the log file need not be a long sequential file. Hence the log and data file need not be physically located in different locations, i.e., they can be co-located. Hence they dynamically allocate log sectors when the data access is frequent. In both these research topics they do not dynamically change the level of logging in a application at run time like we do in our research.
2.2
Log Abstraction
2.2.1 Regular Expression Based Abstraction
Xu et al. [45] in their research on mining console logs for problem detection used a novel technique for the abstraction of the log files. Each unique event type was assigned a unique ID and each line in the log file was abstracted to one of those IDs. Each event type in the set was a regular expression. For example
starting: xact (.*) is (.*) 1
where the “(.*)” is the parameter and the fixed string, “starting: xact” is the message type. This regular expression is assigned a unique ID. A set of these regular expressions are extracted from the source code. Then each line in the log file is compared against each of the regular expressions to find the best match. The ID corresponding to the best match is assigned to this line. Since it is a regular expression they are also able to extract the value of the variable parameter fields in the log lines. These regular expressions are built from the source code. They search the source code for all the calls to the function that prints the message in the log files. This search is done using any standard text editor. The calls to this logging function contain the static message usually withing quotes and have variables for the parameter fields. By replacing the variables with the string “(.*)”, they are able to build the regular expressions. The drawbacks of this solution are that we first need access to the source code. If the people carrying out the analysis are different from the people who develop the application that is logging this information then they may not have access to the source code. Even when we access to the source code there are other issues. In their application Xu et al. had the number of messages under a hundred [45]. But in our prior research [33], where we used a similar abstraction, the number of unique messages were close to 2,000. When there are so many of them spread across multiple files, then it takes a considerable amount of time and manual inspection to build this set of regular expressions. The other issue is that if the message to be printed in the log file is constructed outside the call to the logging function, then we will need to examine the abstract syntax trees to get the regular expressions. Also in some cases the message in the log file is not from the source code of the application. One example is when the source code executes a command on the machine on which the application is executing and prints the output of this command to log file. This log line cannot be abstracted to any of the regular expressions. But if any of the above issues are not present in the log file that we are abstracting, then this solution is the most accurate one.
1
2.2.2 Clustering Based Abstraction
Vaarandi [41] proposes a clustering algorithm for finding patterns in log files. His tool is called the Simple Log file Clustering Tool (SLCT). This algorithm is very similar to apriori algorithms for mining frequent item sets. The modifications made to a typical clustering algorithm for finding frequent item sets, are based on the observations he made about log file data. Firstly only a few words in the log file occur very frequently. Secondly there was a high correlation among these high frequency words. This was because of the fact that each line on the log file is formatted according to the message type and parameter information for that event. This is the same reasoning as in the Xu et al. [45] approach. The message is part of a function call. In his approach Vaarandi does three passes over the log file. The first is to build a data summary, i.e. the frequency count of each word in the log file according to its position in each line. In the second step he builds cluster candidates by choosing log line with words that occur more than the threshold, specified by the user. What is to be noted is that the frequency of a word may be higher in certain positions but may not be so in another position in the log line. In the third step we choose the clusters from these candidates that occur at a frequency higher than the user specified threshold. Each of these candidates are a regular expression. The words in each candidate that have a frequency lower than the threshold are considered as the variable part and hence replaced by “(.*)”.
In their research on identifying failure causes, Mariani and Pastore [26], utilize the SLCT to abstract the log lines to log events. But the SLCT was not designed to detect the regular expressions to abstract all lines in a log file. It was designed to detect frequently occurring patterns. A pattern is considered frequently occurring if its frequency is greater than a user specified threshold. All log lines that don’t satisfy this condition are stored in the outliers file. Hence even some log lines that repeat a few times but are still less than the threshold won’t be considered as a pattern. The goal of that research was to find frequently occurring patterns and not log abstraction. In his paper [41] Vaarandi used thresholds of 50%, 25%, 10 %, 5% and 1%. None of these would either abstract all log lines to an event type or produce regular expressions for abstraction. But if mining frequently occuring patterns is the goal, then this solution performs better than the other ones as it is application and log file independant.
2.2.3 Heuristic based Abstraction
bins. All log lines in each bin have the same number of static words and same number of parameter fields. Then in the categorize step they go through each bin and compare the anonymized log lines and group all the lines that are exactly the same. Since the variable parts of the line are replaced with a common variable, a simple string comparison would group the log lines. Finally in the reconcile step they go through the groups and combine groups that are different by just one word. This way they are able to group log lines that have a parameter that was not anonymized.
This is a very efficient technique that makes use of the properties of messages in log files for abstraction. But the assumptions are that the logs have enough structure to be able to find the parameters using heuristics. But not all log files have that kind of a rigid structure. The key hurdle when trying to abstract log files is that we don’t know what the parameters are in each line of the log file. If we did know, then this technique like the Xu et al. [45], would provide highly accurate results. If log files have some structure to it then highly accurate abstraction can be done. Both Xu et al’s [45] and Jiang et al’s [22] approach would provide very accurate results when the assumptions under which they operate hold true. When the log files are of a free form and we don’t know where the parameters occur and we don’t have access to the source code, then only an approximate abstraction solution can be achieved. A clustering algorithm like the SLCT [41] would be such a solution. But as mentioned before, SLCT was not designed to abstract log lines.
2.3
Deriving Operational Profiles
2.3.1 Manual Operational Profiling
Operational profiles are traditionally created by a combination of system engineers, high-level designers, test engineers, product planners and marketing people [28]. They derive the oper-ational profile by manually quantifying the usage of each element in the system, in a manner as close as possible to expected customer usage. However the operational profile calculated from the expected usage differs from that based on the actual usage [19], [28]. The latter is likely to lead to better reliability estimates of the system during field operation. Therefore, it is advantageous to use, in the second and higher releases of a product, operational testing profiles that are closer to the actual operational behavior of the product.
Getting the operational profile based on actual usage is not a simple matter [44]. Code profiling and trace analysis are some of the available techniques.
down the system [21]. Trace analysis tools and techniques perform a very similar task. They explore traces from program execution dynamically for a variety of purposes like software opti-mization. In their survey, Hamou-Lhadj and Lethbridge, discuss the strengths and weaknesses of eight trace exploration tools [17]. They state that the object oriented systems have driven the increase in the number of such tools as polymorphism and dynamic binding greatly limit the use of static analysis. They conclude with the need for a common framework for trace exploration tools and techniques.
Execution logs, code profiles and execution traces are a record of the usage of a system. But code profiles and execution traces could generate information that is orders of magnitude bigger as they may include every function call and branch statement. Since this could affect the performance of the software system, they are often not found in production systems. The execution logs on the other hand are more flexible. It collects only that information which a developer wants. Hence even production systems have logs. These logs can be used to build operational profiles that are based on actual usage of the production system by the user.
2.3.2 Commercial Pattern Recognition Tools
The usefulness of analyzing log files has been long recognized. Tools like SEC [40], Splunk [7], and Swatch [18], are used to monitor log files. SEC is an event correlation tool, Splunk is a log management tool, and Swatch is a log monitoring tool. All the three of them and other similar log analysis tools can only monitor the logs for a particular event or sequence of events. Most of them perform a regular expression match. What is common in them is that the event(s) need to be known in advance. Once known, they can analyze the event(s) in the log file and get the frequency of them to build operational profiles. But we need the expertise of the developers to come up with the event or sequence of events. The developer has to think of all possible cases for a particular action and all the actions for which we need the frequency. Using SEC, Splunk, and Swatch we can only find out the usage probability of the sequences we search for. We cannot find the most frequently used part of the system, unless the developer thought of it earlier. This technique helps verify the developers prediction, but does not itself calculate the operational profile. However these tools can be used to extract the event identifiers from the log files to be used by other automated operational profilers for finding repeated sequence of events.
2.3.3 Compression Algorithm Based Operational Profiling
Hassan et al. use a log compression approach to identify patterns and their densities in the log files. In their approach they exploit the fact that a file with more repetition in it will be compressed more by a tool like gzip. They split the log file into equal sized periods, and compress each of them. They plot the compression ratio as a log signal to find the period with the greater density. This period is likely to have more repetitions. An engineer of the system then identifies the pattern that is repeating and writes filtering rules for it. Therefore it only aids the human in identifying patterns, thus making it a semi-automatic approach which cannot avoid human intervention. The log file is filtered of this pattern and then all the steps are repeated again. In this approach we can only detect the top few sequences and their relative densities, and it takes 2-3 hours to just come up those.
2.3.4 Clustering Based Operational Profiling
Operational profiles are often derived using clustering algorithms [27], [28], [29] which have non linear time complexities. Vaarandi’s tool called Simple Log File Clustering Tool (SLCT) [41] uses a novel clustering algorithm to mine for patterns in log files. The tool has very low execution times that vary from 7-11 minutes for a log file of size 1 GB. He exploits log file properties such as (a) Most words in a log file occur only a few times, and (b) Frequently occurring words have a high correlation. The clustering algorithm itself has three steps, viz. building data summary, building cluster candidates, and selecting clusters from this set. The performance of this clustering algorithm proposed by is highly sensitive to a user-specified parameter called support threshold, which makes the algorithm hard to use by other users. Our algorithm on the other hand does not require the user to tune any parameters. Also the SLCT algorithm finds only single line patterns, i.e. the count of a particular log line only unlike our algorithm that can find patterns that extend across multiple lines.
2.3.5 Log Visualization
Chapter 3
Log Collection using Adaptive
Logging
3.1
Introduction
In his paper [41], Vaarandi uses log files from applications like Linux mail server, Internet banking server, and file and print server. Each of these systems can produce hundreds of MBs of log data, with millions of events in them.
Most applications running on cloud computers are threaded to accommodate multi-user capabilities. The nodes of the cloud may be located in multiple data centers. All these features of the applications in cloud computing environments, leads to large and complex log files. This is due to the exponentially growing (in terms of size and complexity) information set that is being collected in log files, especially in these cloud environments. In our case study we studied the logs from the cloud environment at North Carolina State University called Virtual Computing Lab(VCL) [10]. We examined the log files, identified areas for improvement and provided solutions for optimizations.
more or less log lines, when the same piece of code is executed. The adaptive logging approach proposed in this chapter is such a technique.
Note that the technique used in this case study is suitable for collecting information if generated by software systems that are run on dedicated servers and accessed by multiple simultaneous users. Log files from most server side software systems are very large. The cloud computing [10] log files we analyzed collect more than 450,000 events each day and can grow log file size by more than 56 MB per day.
3.1.1 Contributions
• We performed a case study to see what information was being logged, and what informa-tion was being used by the developers.
• We developed an adaptive logging technique that collects information in the log files based on the context of the execution.
• We performed a simulation of our adaptive logging technique using real logs we collected to evaluate our approach. We present the results and observations of our approach in this chapter.
3.2
Our Approach
The huge size of the log files affects the performance of machine learning and data mining algorithms. Algorithms with a time complexity O(n2) are often avoided as they will have to operate on millions of events. But if we need the events associated with an error reported in a log file, we will also have to accept the logging of such events when there is no error. If we were going to reduce the size of the log file by collecting less data, then there is a loss of information. The data mining algorithms will not be able to accurately analyze the system, using the log files, due to the lack of data. The more the training data these algorithms have, the better the analysis. Hence they will need as much data as possible.
Thus the developers have to come to a compromise. Either they get a superfluous amount of data that improves accuracy but affects performance, or they get limited data from the logs that can easily be analyzed but the accuracy of these results may be questionable. There is a huge scope for improvement if we intelligently log information.
approach is that a decision engine will decide whether we need to collect more information or not. Thus the developers can train the decision engine to collect more information in the log files when they need it and filter the information coming to the log file when they don’t need extra information. Thus they already collect the ‘normal’ or at least base line information, but get a more detailed log trace when the situation demands. A trained prediction model or a mere inspection based model could be used in the decision engine to determine when to store to disk more than the ‘normal’ information.
3.2.1 Logging Information from the Source Code
The information in the log file is printed from calls to the logging method in the source code of the application. Hence if we want more information from a particular piece of code during a specific instance of its execution, then we need to add the extra calls to the logging method with the extra information in the source code. But then we do not want this information do be printed to the log file every time this piece of code is executed. Therefore we tag the log message in these extra calls as ‘debug’ log lines. To make it uniform we tag the lines already present in the source code as ‘normal’ log lines. The rationale behind this differentiated tagging is that we will log messages tagged as ‘normal’ at all times. The log lines tagged as ‘debug’ will be saved onto disk only during specific instance of the execution as determined by the developers ahead of time. Thus the logs collected from a particular piece of code in ‘debug’ mode is the super set of the logs collected in the ‘normal’ mode.
In most systems this type of logging already exists as a multi mode logging scheme. Note that in these systems the control of what is to be logged is determined before the system starts up. This is usually controlled by a flag that is set during the start up. The system itself controls how much information has to be logged. Hence the granularity cannot be changed at run time. Even if they can be edited at run time, the response is usually not immediate and hence the information we wanted to be logged is missed. Therefore we either get a lot of information at all times when it is in the ‘debug’ mode or limited information all the time in the ‘normal’ mode. In our approach we change the control over filtering of this information from the system to an external decision engine. Through this we can control the granularity of the information at run time.
3.2.2 Decision Engine
The decision engine can be any algorithm or technique ranging from a simple prediction model like the logistic regression model to a very complex one like a Hidden Markov Model or a data mining technique or merely an inspection based technique. This model/technique in the engine will have to be trained first to decide when to collect more information and when to collect the normal amount of information. For this we need a log file with labeled data. The labeling is done according to the developers needs. For example, the developers may need more information when a failure occurs. It could be that the developers want information when the performance of the system slows down. The developers decide if a particular event in the training log file is going to lead to a situation where they may need more data or not. The decision engine will then decide according to the data provided in the training phase.
Since we filter out information based on the decision engine’s decision, we need to make sure that we choose a model/technique and its parameters such that the false negative rate of the decision engine is extremely low. This can be at the cost of having a poor false positive rate, but the better the false positive rate the more efficient the collection becomes. This is because there usually is no harm done if we collect extra information in a situation where we don’t need it, so long as it is not excessive, but it will be unacceptable if we fail to log information when it is required to be logged i.e. a false negative.
If we choose to use a prediction model or data mining technique then the model might need to be retrained under certain circumstances. If the operational profile of the system considerably changes, then the prediction may be affected. Also if the application undergoes significant change, like in a new release, then the events leading up to a failure may significantly differ. Under such circumstances the model will have to be retrained to identify and predict the failures. One of the ways to identify when retraining is required, besides the knowledge of the changes stated above, is discussed below.
We experimented first with a conservative prediction model that is tuned to get more false negatives than false positives. Thus a rise in false positives indicates that the prediction model is not performing as it was intended to. In a real implementation we cannot measure the false positive rate. Therefore if the size of the log file gets bigger and bigger even though it contains a similar number of actions, in this case reservations, and a similar number of failures, it is an indication that the false positive rate is increasing. Thus this would be a good time to analyze the reasons for the changes in the log file and take the necessary retraining steps.
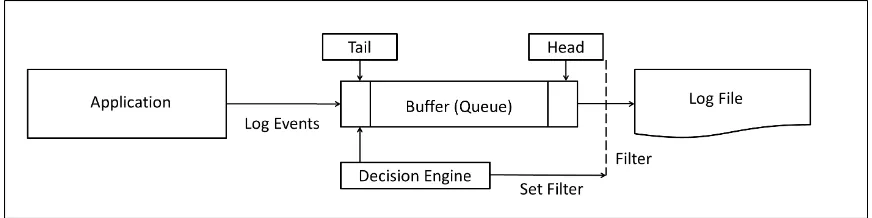
Figure 3.1: Adaptive logging using a Prediction Engine
prediction based model for the decision engine we used a simple inspection technique in the decision engine. Details of this technique are explained in the following subsection.
3.2.3 Adaptive Logging by Inspection
Our adaptive logging technique is illustrated in Fig. 3.1.
The method/function that the application calls for logging information to file is edited to collect an extra parameter along with the log message. This parameter is used to tag the log event as to weather it has to be collected at all times or only at specific times. Thus the default set of events that have to be collected at all times would be tagged as ‘normal’ and the events that have to be collected only during, say a failure, would be tagged as ‘debug’. Note that the failure event itself would be tagged as ‘normal’ because we would definitely not like to miss that event in the log file.
This logging method/function, instead of writing the output to the log file will send it to a buffer that is in memory. The decision engine would inspect the tail of the buffer where the log events enter the buffer. At the head or other end of the buffer, is filter which if open would log all messages (both ‘normal’ and ‘debug’ level events) in the log file and if closed would log only the ‘normal’ messages.
We build a database of special events to look out for in the decision engine. It inspects the last event or the tail of the buffer. By this time, then buffer has events till its head which have happened before in time with respect to this event at the tail. As long as the decision engine does not match the event at the tail of the buffer with an event in its database, it keeps the filter closed in the head end. Only the ‘normal’ level events are saved in the log file. If the decision engine matches the event at the tail with a event in its database, then then opens up the filter at the head end to save the ‘debug’ level messages as well as ‘normal’ level messages in the buffer.
would have no false negatives. There would also be no false positives since there is no prediction, but only an actual comparison against a database of special events.
The results and discussions follow in the next section.
Table 3.1: Event Statistics of the 9 VCL log Files
Log File Name
No:of Log Lines
Total Num-ber of reser-vations
Avg Events per Reser-vation
No:of failed Reserva-tions
Avg Events per Failed Reservation
Max Events in Failed Reservation
Percent In-spected
vcld.log.1 834471 314 1703 10 585 1047 3
vcld.log.2 838622 255 2078 4 991 1950 2
vcld.log.3 731731 168 2759 4 1587 4179 2
vcld.log.4 710157 234 1917 5 575 1442 2
vcld.log.5 785108 306 1684 9 616 1027 3
vcld.log.6 767965 210 2318 7 773 1031 3
vcld.log.7 791334 253 1982 13 742 1041 5
vcld.log.8 870357 287 1902 2 675 931 1
vcld.log.9 830892 206 2538 3 818 1414 1
We evaluated our approach on the logs from VCL. Since we were not able to edit the logging scheme in the production version of the VCL system, we performed a simulation on logs collected from the VCL system. For this simulation we used the 9 log files collected in ‘debug’ mode. We labeled the data in the log files with the tags ‘normal’ or ‘debug’ so that the decision engine would know which events to filter out and which events to retain. In order to implement our approach we first needed to know what events to add in the database of the decision engine, and what was the optimal size of the buffer that we needed.
We conducted interviews with the developers of VCL to identify the situations where they wanted more information in the log file. Another objective of this interview was to identify the events that signified these specific situations. From our interviews we identified that the developers wanted all the information about the reservations that ended up in a ‘failure’ state in the VCL management nodes. These failures could be identified by the events with messages ‘CRITICAL’ and ‘WARNING’. The VCL developers want more information only when a fault occurs. Thus the database in the decision engine has these two events. From the last column of Table 3.1 we observe that these events corresponded to about 2% of the log file on an average. Hence with a more efficient logging approach we would be able to collect more information about this 2% and a basic amount of information otherwise.
The buffer we used was a ‘Queue’ data structure. To determine the size of the buffer we performed a sensitivity analysis on the log files from VCL to determine how many events were logged per reservation in the debug mode and found the average for a successful reservation. We report the average values for the 9 log files, for which we did this analysis in Table 3.1.
We also report the average and maximum number of events for reservations that failed in Table 3.1. We can see that for log file vcld.log.3, the maximum number of events in a failed reservation was 4179, which was the highest among the 9 log files. The average number of events in the failed reservations was 818, and the average maximum value was 1562. Hence we chose the buffer size to be higher than the average maximum, namely 2000.
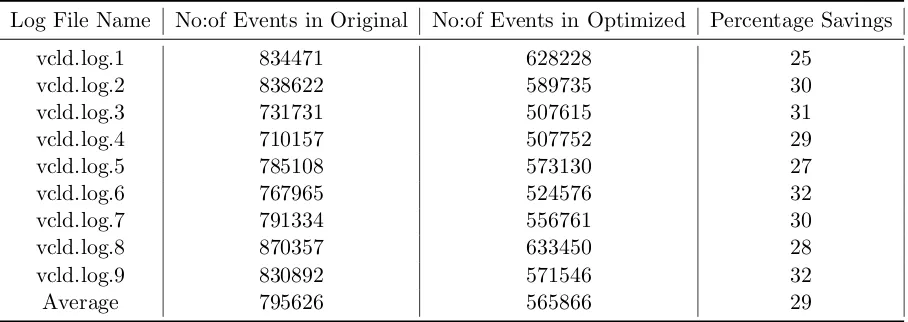
The decision engine inspected the tail of the queue and compared it against the events in our database. We used a hash map to implement the database. At the head of the queue depending on what label the event has, and whether the filter was open or closed the events were logged in the file. The results of the simulation with the number of events in the original log file, and the number of events in the optimized log file are reported. Table 3.2 has the results from the simulation carried out on the 9 log files. We also report the percentage savings per file in Table 3.2.
Table 3.2: Adaptive Logging Simulation Results
Log File Name No:of Events in Original No:of Events in Optimized Percentage Savings
vcld.log.1 834471 628228 25
vcld.log.2 838622 589735 30
vcld.log.3 731731 507615 31
vcld.log.4 710157 507752 29
vcld.log.5 785108 573130 27
vcld.log.6 767965 524576 32
vcld.log.7 791334 556761 30
vcld.log.8 870357 633450 28
vcld.log.9 830892 571546 32
Average 795626 565866 29
The critical issue is to avoid a situation when there is a fault in the system, and we fail to collect information relevant to the fault due to a small buffer size. But at the same time a large buffer will be expensive to maintain. So we have to strike a delicate balance where the buffer size if optimal. This can be done by doing a sensitivity analysis on the logs of the required application before deciding the buffer size. What we are looking for in this sensitivity analysis is the number of events before a specific event we want recorded in the log file.
The decision engine is a key component of our approach. Any model requires information to make the decision. That information is typically found in the buffer. Depending on how much information needs to be recorded and how much information is required for making the decision we need to adjust the buffer size.
3.4
Complexity Analysis
There are four operations in this approach:
1. Pushing the event into the buffer from the application.
2. Inspecting the event at the tail of the buffer.
3. Editing the status of the filter if required.
4. Poping the event from the head of the buffer into the file after checking the status of the filter.
The push and pop operations in steps 1 and 4 are hence done in constant time. We implement the database of events to look out for in a hash map since the number of these events are fixed for every application and typically very small (two events in VCL). Hence to look up if the current event in the tail is in the table would require a look up in the hash map which is done in constant time. Hence step 2 can also be in constant time. Editing the status of the filter in step 3 and checking the status of the filter in step 4 are assign and conditional operations respectively. hence these too can be done in constant time.
From the above analysis, all the four steps takes a constant amount of time. Thus for each event the time taken is a constant. Hence to collect data for theN events logged by the application this approach would take anO(N) time. Thus the time complexity of our approach is linear.
The number of events logged in file is smaller than the number of events logged by the application. hence the number of events in file is < N. The buffer size and hash map size is constant for an application, albeit the buffer size may be a large constant. Hence the space complexity of our approach is linear orO(N) as well.
3.5
Conclusion
Chapter 4
Log Abstraction using Empirical
Frequency Analysis
4.1
Introduction
Software systems collect information about their activity in log files. The term ‘to log’ comes from making entries in a logbook to keep track of activities completed. The information in the log files, called logs, consists of the start or end of events or actions of the software system, state information and error information. Each log line typically contains date and time information, user information, application information, and event information. Logs are often collected for system monitoring, system debugging and fault diagnosis. Numerous log file analysis tools and techniques are available to carry out a variety of analyses. Insights of varying degrees are achieved by log file analysis. These include but are not limited to, fault detection by monitoring, fault isolation [26], operational profiling [33] etc. Tools like Splunk [7], and Swatch [18], are used to monitor log files. Splunk is a log management tool, and Swatch is a log monitoring tool.
The users of log files either manually look for a specific piece of information in the log file or apply an analysis algorithm to mine information from it. In the latter case the accuracy of the results produced are highly dependent on the variability present in log files. Each line in a log file is a combination of a static message type and variable parameter information. For eg.
Request data from 127.0.0.1 to 127.0.0.2
static field from the dynamically changing parameter field is called log file abstraction. Thus in the above example we would separate the log line into two fields:
Message Type: Request data from * to *.
Parameter Fields: 127.0.0.1, 127.0.0.2
Log file analysis techniques like operational profiling [33], fault isolation [26], system problem detection [45] etc, operate on the abstracted log files. In each of the above techniques, each log line in the log file is abstracted to a corresponding integer ID. Then the analysis is carried on the set of integers. In most of the techniques the abstraction itself is done by regular expressions. The abstraction techniques usually are used to build these regular expressions. The result of abstraction techniques are a set of regular expressions and corresponding IDs. The log lines in the log files can then be matched to these regular expressions and the ID for the best match is used for each line in the log file.
4.1.1 Contributions
1. A study of the existing abstraction techniques and their advantages and disadvantages.
2. Our abstraction algorithm which tries to address the issues of the other algorithms.
3. The evaluation of our algorithm.
4.2
Our Approach
Vaarandi [41] and Jiang et al. [22] come to the same conclusions about the properties of messages in each line of a log file: “Only a small fraction of the words occur frequently”. This is the key property that we exploit. Thus the basis for our approach is that if a particular event occurs in multiple places in a log file with different values for its parameter field, then the static parts of the log line, i.e the words in the message type field will occur many times whereas the variable values will occur fewer times as compared to the static words. We will use the following example to illustrate this.
Start processing for Jen user
Start processing for Tom user
Start processing for Henry user
Start processing for Tom user
Start processing for Peter user
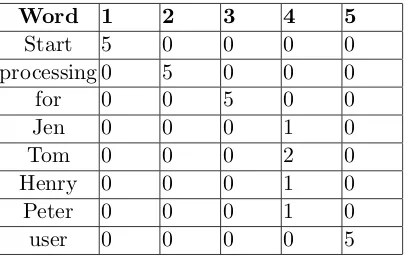
Table 4.1: Frequency table of the words after Data Summary Step
Word 1 2 3 4 5
Start 5 0 0 0 0
processing 0 5 0 0 0
for 0 0 5 0 0
Jen 0 0 0 1 0
Tom 0 0 0 2 0
Henry 0 0 0 1 0
Peter 0 0 0 1 0
user 0 0 0 0 5
words. From this we can make the inference that the message that created these lines in the log file would be of the following format: ‘Start processing for $username user’. This is indeed the statement that created this log message. The words that belong to the constant message type field occur more often than the words in the variable parameter field. We exploit this property to abstract log lines to event types. For this we carry out two passes over the log file.
In the first pass we build a data summary of the words in the log file. We build a frequency table that has the number of times a particular word occurs in a particular position in the log line. Hence the rows in the table are the words, and the columns are the positions in each log line. In Table 4.1 we show a part of what the frequency table would look like in the above example after we parse through the 5 lines. Filling the values in this table can be done in time O(N), where N is the number of words in the log file. We take one line at a time and split it into individual words. Then we look up if we have a row for that word in the table. If not we create one. Then we go to this row and increment the value in the column that corresponds to the position of the word in this log line. Looking up the word can be done in practically constant time (theoretically not constant) by using a hashing function. In the hashing function each word maps to an integer which corresponds to the row in the frequency table, where we increment the frequency of that word. The position of the word in the log line indicates the column in that row where this increment has to happen. At the end of the first pass we would have completed building this table.
Table 4.2: Frequency of the words in the log line ‘Start processing for Jen user’ after Frequency Lookup Step
Start processing for Jen user
5 5 5 1 5
abstracting the log line ‘Start processing for Jen user’, this second pass would translate to the values in Table 4.2. A similar translation is done for each of the log lines.
Then in the third pass, for each of the log lines we calculate the average of the frequencies we extracted for the words in the second pass. If the individual frequency of a word in that position in a log line is greater than the average of the frequencies of the words in that line then it is a constant word, else it is a variable parameter. In our example, when we are abstracting the log line ‘Start processing for Jen user’, the average from Table 4.2, is 4.2. Hence the words with frequencies above 4.2 is a constant word and those below it would be a variable parameter. We would replace the variable parameters with the character ‘*’. In this case the words ‘Start’, ‘processing’, ‘for’ and ‘user’ will be constant words since they have a frequency of 5 which is greater than 4.2. But the word ‘Jen’ will be classified as a variable parameter since it has a frequency of 1 which is less than 4.2. Hence the log line ‘Start processing for Jen user’ is abstracted to ‘Start processing for * user’. Hence we have successfully extracted the variable parameter field from the constant message type field. In the case of usernames with two or three words, it might affect the frequency of the word ‘user’ in the example. But in log files we have noticed that there are enough of those (two or three word usernames) log lines too. Hence they too are abstracted the same way to the same message type as well.
In SLCT the author tries to find clusters across log lines [41]. What differentiates our approach from SLCT is that we look for clusters within a log line. Thus to identify the event types in the log file we clustered the frequencies of the words instead of clustering the words themselves.
4.3
Results and Discussion
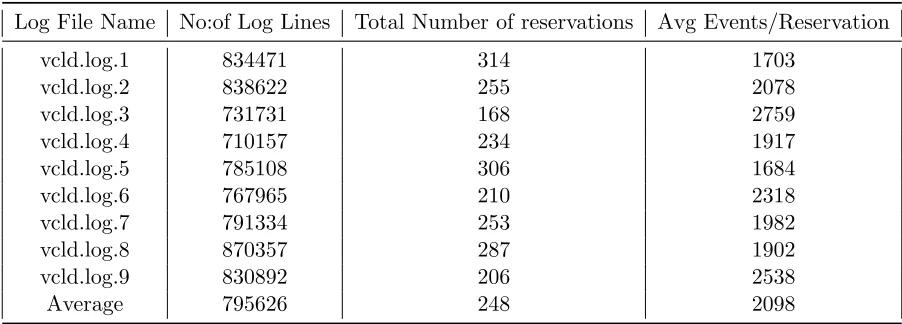
We implemented our approach and tested it on 9 log files from the Virtual Computing Lab [10], a cloud computing management application at North Carolina State University. Table 4.3 gives some basic information about the log files we used in the analysis. We can see the number of log lines in the file, number of reservations and the average events per reservation. The log lines in the VCL log had the following fields (each separated by the ‘|’ symbol):
Table 4.3: Log Files used in the Analysis
Log File Name No:of Log Lines Total Number of reservations Avg Events/Reservation
vcld.log.1 834471 314 1703
vcld.log.2 838622 255 2078
vcld.log.3 731731 168 2759
vcld.log.4 710157 234 1917
vcld.log.5 785108 306 1684
vcld.log.6 767965 210 2318
vcld.log.7 791334 253 1982
vcld.log.8 870357 287 1902
vcld.log.9 830892 206 2538
Average 795626 248 2098
• Process ID
• Request and Reservation ID
• Module Name
• Function name and line number from source code (that acted as an Event ID)
• Message
Note that each log line does not have these 6 fields. There are some log lines that are overhead information. We are interested only about the log lines that have all these 6 fields. By using a tokenizer that splits the log line, using the separator symbol (‘|0), we can get these
fields and drop the log lines that do not have the 6 fields.
The string in the message field was written to the log file in that particular log line by a particular line of code from the executing application. This line of code and the function in which it is present acts an Event ID. As stated in the previous sections each event in the source code is instantiated as a (possibly) different message in the log file. We want to extract this message in the log file to a unique event in the source code. In this particular set of log files since we have the Event ID information, we need not perform the abstraction of the message to the event. But this Event ID information is not available in all log files. In our case study we use the Event ID information to see how well the abstraction techniques perform.
We applied three abstraction techniques on the messages in the log files, namely
1. Heuristics based abstraction technique by Jiang et al. [22]