BATENY, FATEMEH. Fluid Absorption and Release of Nonwovens and their Response to
Compression. (Under the direction of Dr. Eunkyoung Shim and Dr. Behnam Pourdeyhimi).
Fluid handling is a key property in one of the major nonwoven applications in absorbent
product such as wipes, hygiene products, and baby diapers. These products are subjected to
various levels of compression in real-use. The aim of this study was to investigate the liquid
absorption and release properties of nonwovens to establish the absorption structure-property
relationship at various compression levels. A comprehensive methodology, considering
various flow directions, was employed to establish the relationship by decoupling the effect
of structural parameters and material properties in two phases of this study respectively. In
the first phase, the mechanism of absorption by pore structure was investigated through
considering various fiber cross-sectional size and shape, as well as heterogeneous layered
structures having a pore size reduction and expansion. In the second phase, the mechanism of
absorption by fiber and consequent swelling was evaluated in view of fluid diffusion into the
rayon fibers in samples having different percentages of PET fiber (non-absorbent) and rayon
fiber (absorbent). The analysis of absorption and release properties through the entire
by
Fatemeh Bateny
A dissertation submitted to the Graduate Faculty of
North Carolina State University
in partial fulfillment of the
requirements for the degree of
Doctor of Philosophy
Fiber and Polymer Science
Raleigh, North Carolina
2015
APPROVED BY:
_______________________________
_______________________________
Dr. Eunkyoung Shim
Dr. Behnam Pourdeyhimi
Committee Co-Chair Committee Co-Chair
_______________________________
_______________________________
DEDICATION
BIOGRAPHY
ACKNOWLEDGMENTS
First and foremost, I want to express my deepest gratitude to Dr. Eunkyoung Shim for the
invaluable lessons in life and science during the past three years. She gave me a confidence,
which I had never experienced before. I couldn’t ask for a better mentor and advisor. I would
also like to extend a special thank you to Dr. Behnam Pourdeyhimi for his continuous
support and guidance, in my research and in life. I will move forward with the knowledge he
bestowed upon me. Thank you to Dr. Benoit Maze for all his invaluable guidance on this
project. His profound suggestions helped me a lot for preparation of this research. Also
thanks to my industrial advisors for their helpful recommendation and the Nonwovens
Institute and its member for their financial support.
I would like to thank all of the people who helped me with my research, especially the
nonwoven Institute staffs, Bruce Anderson for his patient and continues support on building
the experimental testing system, Compression GATS, Amy Minton, John Fry, Sherwood
Wallace, Jimei Wang, and Sharon Wright.
TABLE OF CONTENTS
LIST OF TABLES ... VIII
LIST OF FIGURES ... IX
1
INTRODUCTION ... 1
1.1
RESEARCH
OBJECTIVES
AND
APPROACHES ... 2
1.2
ORGANIZATION
OF
DISSERTATION ... 4
REFERENCES ... 6
2
LITERATURE REVIEW ... 7
2.1
FLUID
ABSORPTION
BASICS
OF
NONWOVEN
FABRICS ... 7
2.1.1
Liquid absorption in the porous structure ... 8
2.2
NONWOVEN
ABSORPTION ... 44
2.2.1
Parameters affecting nonwoven absorption behavior ... 48
2.2.2
Absorbency behavior of nonwovens ... 56
2.2.3
Compression of nonwovens and its impact on absorption... 79
REFERENCES ... 88
3
EFFECT OF BINDER FIBERS AND STRUCTURAL PARAMETERS ON
COMPRESSION AND RECOVERY BEHAVIOR OF THROUGH-AIR BONDED
NONWOVEN FABRICS ... 102
3.1
INTRODUCTION ... 102
3.2
MATERIAL
AND
EXPERIMENTAL ... 106
3.2.1
Description of samples ... 106
3.2.2
Basic web properties ... 107
3.2.3
Compression test procedure ... 108
3.3
RESULTS
AND
DISCUSSION ... 113
3.3.1
The effect of fiber cross-sectional size on compressional behavior ... 113
3.3.2
The effect of fiber cross-sectional shape on compressional behavior ... 120
3.4
CONCLUSION ... 128
REFERENCES ... 129
4
INVESTIGATION OF EFFECT OF STRUCTURAL PARAMETERS ON
ABSORPTION AND RELEASE PROPERTIES OF NONWOVENS- PART I: FIBER SIZE
STUDY ... 132
4.1
INTRODUCTION ... 132
4.2.1
Description of samples ... 135
4.2.2
Basic web properties ... 136
4.2.3
Pore size measurement - porometry technique ... 136
4.2.4
Pore size measurement of compressed samples- porosimetry technique ... 136
4.2.5
Through-plane absorbency testing under compression... 137
4.2.6
In-plane wicking measurement ... 139
4.2.7
Vertical wicking measurement ... 140
4.2.8
Evaluation of liquid holding capacity under compression ... 141
4.2.9
Theoretical determination of maximum absorption capacity of nonwovens .... 143
4.3
RESULTS
AND
DISCUSSION ... 144
4.3.1
Thickness and solid volume fraction ... 144
4.3.2
Pore diameter ... 144
4.3.3
Absorption properties... 146
4.3.4
Release properties ... 168
4.4
CONCLUSION ... 172
REFERENCES ... 173
5
INVESTIGATION OF EFFECT OF STRUCTURAL PARAMETERS ON
ABSORPTION AND RELEASE PROPERTIES OF NONWOVENS UNDER
COMPRESSION- PART II: FIBER CROSS-SECTIONAL SHAPE STUDY ... 180
5.1
INTRODUCTION ... 180
5.2
MATERIAL
AND
EXPERIMENTAL ... 182
5.2.1
Description of the samples ... 182
5.2.2
Basic web properties ... 183
5.2.3
Pore size measurements- porometry technique ... 184
5.2.4
Pore size measurement of compressed samples- porosimetry technique ... 184
5.2.5
Experimental technique for absorption and release properties ... 184
5.3
RESULTS
AND
DISCUSSION ... 185
5.3.1
Thickness and solid volume fraction ... 185
5.3.2
Pore diameter ... 185
5.3.3
Absorption properties... 192
5.3.4
Release properties ... 206
5.4
CONCLUSION ... 211
REFERENCES ... 213
6
INVESTIGATION OF EFFECT OF STRUCTURAL PARAMETERS ON
ABSORPTION PROPERTIES OF NONWOVENS UNDER COMPRESSION- PART III:
HETEROGENEOUS LAYERED STRUCTURE STUDY ... 216
6.1
INTRODUCTION ... 216
6.2
MATERIAL
AND
EXPERIMENTAL ... 217
6.2.1
Description of the samples ... 217
6.2.3
Compression testing procedure ... 219
6.2.4
Experimental technique for absorption testing under compression ... 220
6.2.5
Theoretical determination of maximum absorption capacity of nonwovens .... 222
6.3
RESULTS
AND
DISCUSSION ... 223
6.3.1
Thickness and solid volume fraction ... 223
6.3.2
Compression properties ... 224
6.3.3
Absorption properties... 229
6.4
CONCLUSION ... 241
REFERENCES ... 242
7
INVESTIGATION OF EFFECT OF FIBER ABSORBENCY ON ABSORPTION AND
RELEASE PROPERTIES OF NONWOVENS UNDER COMPRESSION ... 245
7.1
INTRODUCTION ... 245
7.2
MATERIAL
AND
EXPERIMENTAL ... 249
7.2.1
Description of the samples ... 249
7.2.2
Basic web properties ... 250
7.2.3
Pore size measurement ... 250
7.2.4
Compression properties measurement ... 250
7.2.5
Swelling characteristics ... 251
7.2.6
Experimental technique for absorption and release properties ... 251
7.3
RESULTS
AND
DISCUSSION ... 252
7.3.1
Basic web characteristics ... 252
7.3.2
Pore diameter ... 253
7.3.3
Compression properties ... 254
7.3.4
Swelling properties ... 259
7.3.5
Absorption... 260
7.3.6
Release properties ... 275
7.4
CONCLUSION ... 282
REFERENCES ... 284
8
CONCLUSIONS AND RECOMMENDATIONS ... 288
8.1
CONCLUSIONS... 288
LIST OF TABLES
Table 2.1: surface energies of different fibers (Gupta with Hyun Suk Whang 2000; Gupta and
Whang 1999) ... 17
Table 3.1: details of various Through-air bonded fabric ... 107
Table 3.2: details of various Through-air bonded fabric ... 107
Table 4.1: sample details... 135
Table 4.2: structural characteristics of nonwoven samples ... 144
Table 4.3: liquid penetration rate and distance in vertical test-various fiber sizes ... 167
Table 5.1: sample details... 182
Table 5.2: basic web characteristics ... 185
Table 5.3: the pore size distribution of nonwovens containing round, pentalobal, and 4DG
fiber cross-sections at no compression and under 20%, 30%, and 40% compression... 191
Table 5.4: the liquid front rate and distance for various fiber cross-sectional shape- vertical
wicking test ... 206
Table 6.1: sample details... 218
Table 6.2: structural characteristics of separate layers ... 223
Table 7.1: samples characteristics ... 249
LIST OF FIGURES
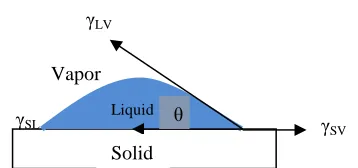
Figure 2.1: liquid drop resting on the solid surface ... 10
Figure 2.2: a small droplet in equilibrium over a horizontal surface:(a) and (b) partial wetting,
while wetting being stronger in (b), (C) complete wetting (θ=0) (de Gennes 1985) ... 12
Figure 2.3: schematic of capillary filled with the liquid (wicking) (Pan and Zhong 2006) ... 20
Figure 2.4: schematic of (Right) positive capillary pressure for a wetting liquid (Left)
negative capillary pressure for a non-wetting liquid ... 22
Figure 2.5: liquid infiltration through an inclined capillary tube (M. Landeryou, Eames, and
Cottenden 2005) ... 27
Figure 2.6: numerical results of rise of water in glass capillaries of different radii versus time
(Hamraoui and Nylander 2002) ... 29
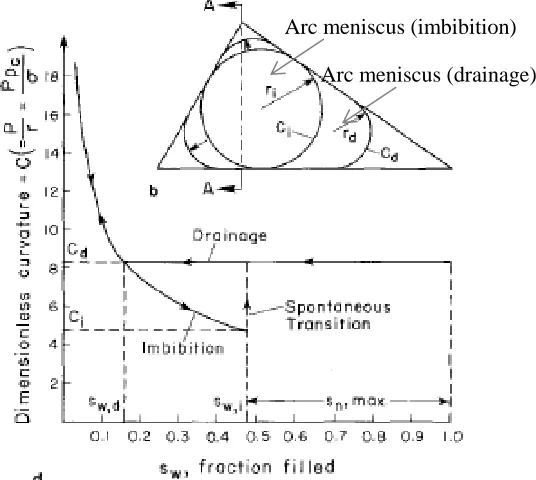
Figure 2.7: imbibition and drainage of triangular tube- curvature vs saturation for a triangular
tube (Mason and Morrow 1991) ... 31
Figure 2.8: schematic diagram of expansion-contraction and contraction-expansion
capillaries (Young 2004)... 33
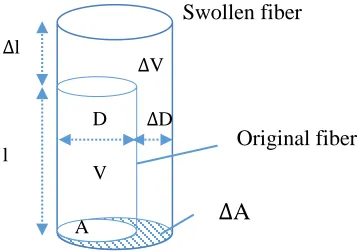
Figure 2.9: changes in fiber dimensions due to swelling (Morton, Hearle, 2008) ... 40
Figure 2.10: different kinds of pores: (a) closed pore (b) through pore (c) blind pore ... 50
Figure 2.11: tortuosity ... 51
Figure 2.12: vertical wicking test... 57
Figure 2.13: downward vertical wicking test (Konopka 2001) ... 59
Figure 2.14: GATS (the plastic tube which connect the reservoir to the porous plate not
shown)(Konopka 2001) ... 61
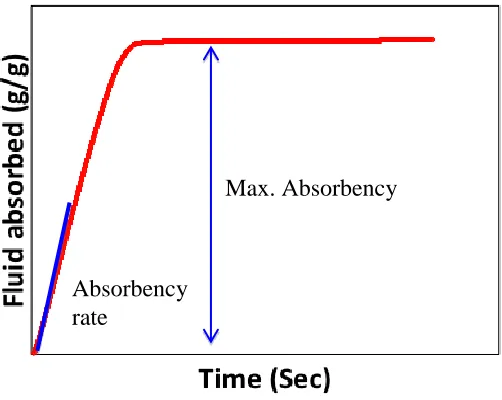
Figure 2.15: typical GATS curve ... 62
Figure 2.16: (a) principal of capillary flow porometry (b) pore diameter measured by flow
porometry (A. Jena and Gupta 2003) ... 65
Figure 2.17: (Left) basic arrangement for liquid Porosimetry (right) prototype output for a
liquid extrusion experiment (Bernard Miller and Tyomkin 1994) ... 66
Figure 2.18: (left) plot of total absorption capacity against packing density (right) plot of the
rate of absorption against packing density for different fiber diameter (Das, Pradhan, and
Pourdeyhimi 2012)... 78
Figure 2.19: effect of compression on the geometric pore size distribution of the fibrous
structure (S. Jaganathan et al. 2009). ... 84
Figure 3.1: schematic of the compression procedure on Instron ... 109
Figure 3.2: typical compression test results, compression and recovery curve ... 110
Figure 3.3: distance between two contact points in a fiber mass ... 112
Figure 3.4: compressive pressure versus compression percentages for various fiber sizes and
binder percentages ... 114
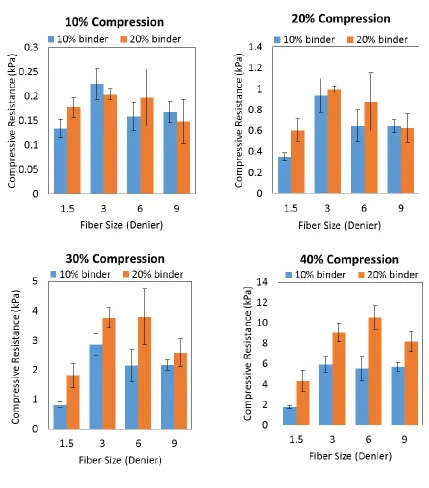
Figure 3.5: the compressive resistance in order to reach to various compression percentages
for samples containing various fiber sizes and binder percentages ... 116
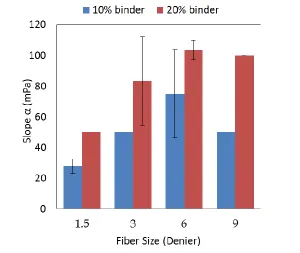
Figure 3.7: calculated slope α in order to determine the resistance to compression based on
van Wyks model ... 118
Figure 3.8: energy loss measurements in varying fiber diameter and binder percentages ... 119
Figure 3.9: recoverability measurements in varying fiber diameter and binder percentages 120
Figure 3.10: compression pressure vs. compression percent, different fiber cross-section at
various binder percentages ... 122
Figure 3.11: compressive resistance for different fiber cross-sections at various compression
levels ... 124
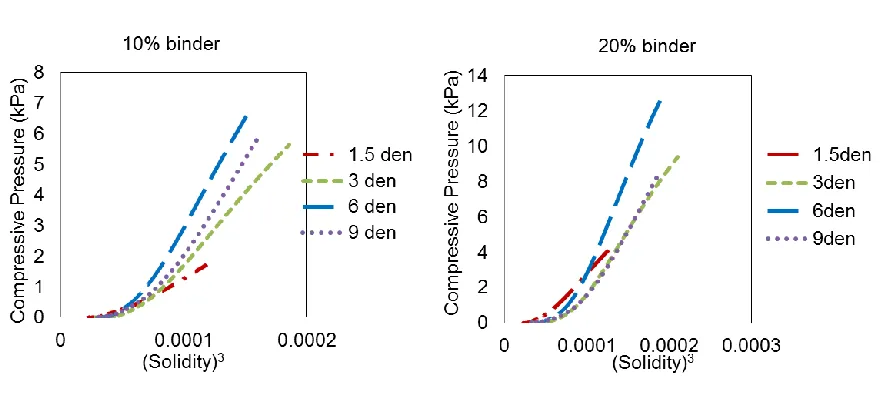
Figure 3.12: compressive pressure vs. cube solidity in different fiber cross-sections ... 125
Figure 3.13: calculated slope α based on van Wyk equation. ... 126
Figure 3.14: percentage of energy loss in samples of various fiber cross-section and binder
percentages ... 127
Figure 3.15: recoverability measurements in varying fiber cross-section and binder
percentage ... 127
Figure 4.1: modified NWI GATS (compression GATS) ... 138
Figure 4.2: typical GATS curve ... 139
Figure 4.3: schematic of the Teflon plate for the in-plane wicking testing system ... 140
Figure 4.4: desorbency testing set up under compression based on GATS ... 141
Figure 4.5: desorbency testing system under compression based on Basket test ... 142
Figure 4.6: experimental result for pore diameter for 90%PET-10%Co-PET... 145
Figure 4.7: the experimental result for pore diameter for 80%PET-20%Co-PET ... 146
Figure 4.8: the GATS results for different fiber diameter- 90% PET-10% Co-PET- at various
compression levels ... 148
Figure 4.9: the GATS results for different fiber diameter- 80% PET-20% Co-PET- at various
compression levels ... 149
Figure 4.10: the maximum absorption results for different fiber diameters measured via
different methods- (a) 90% PET-10% Co-PET (b) 80% PET-20% Co-PET ... 150
Figure 4.11: the GATS maximum absorption results for different fiber diameter under
different compression level- (a) 1.5 denier (b) 3 denier (c) 6 denier (d) 9 denier ... 152
Figure 4.12: maximum absorbency (Theory, GATS) versus solidity (a) 10% binder (b) 20%
binder- solid line shows the theoretical results and dots show the experimental result ... 154
Figure 4.13: through-plane absorbency rate at various fiber sizes and binder percentages . 156
Figure 4.14: through-plane absorbency rate for various fiber sizes and binder percentages
according to their mean flow pore sizes- line shows the theoretical results built on left
vertical axis, and dots show the experimental result built on right vertical axis ... 158
Figure 4.15: absorbency rate for (a) 1.5 Denier (b) 3 Denier (c) 6 Denier and (d) 9Denier
structures @ 0,10,20,30, and 40 % compression levels ... 160
Figure 4.16: median pore size measured by compression Porosimetry technique for samples
of 6 denier fibers at varied compression level ... 162
Figure 4.18: in-plane absorbency rate of samples- Fiber size effect ... 164
Figure 4.19: in-plane absorbency rate of samples vs. mean flow pore size- Fiber size effect
... 165
Figure 4.20: vertical wicking test results for various fiber sizes for the samples containing
20% binder fibers ... 167
Figure 4.21: the vertical wicking experiments after 42 hours ... 167
Figure 4.22: liquid holding capacity of the samples with different fiber sizes at
no-compression (Left) 90% PET-10% Co-PET (Right) 80%PET-20% Co-PET ... 169
Figure 4.23: liquid holding capacity of the samples with different fiber sizes-compression
effect (Left) 90% PET, 10% Co-PET (Right) 80% PET, 20% Co-PET ... 170
Figure 4.24: liquid retention capacity of samples of various fiber sizes, containing 10%
binder fibers at varying solidity levels ... 171
Figure 4.25: liquid retention capacity of samples of various fiber sizes, containing 20%
binder fibers at varying solidity levels ... 171
Figure 5.1: schematic of various fiber cross-sectional shape (a) round (b) pentalobal (c) 4DG
... 183
Figure 5.2: the porometer results for various fiber cross-sectional shape (a) 10% binder (b)
20% binder ... 187
Figure 5.3: the median pore diameter measured by porosimetry technique at varied
Figure 5.14: the GATS in-plane absorbency rate for various fiber cross-sectional shape and
binder percentages ... 204
Figure 5.15: vertical wicking result, liquid front distance vs. time for various fiber
cross-sectional shapes of nonwoven samples containing 90% PET-10% Co-PET fiber ... 205
Figure 5.16: liquid holding capacity of samples with different fiber cross-section and binder
percentages ... 207
Figure 6.1: the schematic of the compression procedure on Instron ... 220
Figure 6.2: the modified NWI GATS (Compression GATS) ... 221
Figure 6.3: typical GATS curve ... 222
Figure 6.4: typical curves of compression pressure vs. compression percentages during
loading and unloading (a) 3den, 3den/6den, 6den (b) 3den, 3den/9den, 9den (c) 3den,
3den/15den, 15den ... 225
Figure 6.5: compressive resistance at 40% compression and slope alpha according to van
Wyk equation for (a) 3den, 3den/6den, 6den (b) 3den, 3den/9den, 9den (c) 3den, 3den/15den,
15 den ... 226
Figure 6.6: thickness recoverability for homogenous and heterogeneous layered nonwoven
samples (a) 3den, 3den/den, 6den (b) 3den, 3den/9den, 9den (c) 3den, 3den/15den, 15den 228
Figure 6.7: typical GATS curve for homogeneous layered structures (a) 3den (b) 6den (c)
9den (d) 15 den ... 230
Figure 6.8: typical GATS curve for the nonwoven structures having a pore size expansion (a)
3den/6den (b) 3den/9den (c) 3den/15den ... 232
Figure 6.9: typical GATS curve for the nonwoven structures having a pore size reduction (a)
6den/3den (b) 9den/3den (c) 15den/3den ... 233
Figure 6.10: absorbency vs. solidity for homogenous layered nonwovens (control samples)
... 235
Figure 6.11: absorbency vs. solidity for heterogeneous layered structures having pore size
reduction ... 236
Figure 6.12: absorbency vs. solidity for heterogeneous layered structures having pore size
expansion ... 237
Figure 6.13: absorbency rate at different compression levels for homogeneous layered
structures (control samples) ... 238
Figure 6.14: absorbency rate at different compression levels for heterogeneous layered
structure having pore size expansion (the results for the control samples of 3 denier fibers is
given) ... 239
Figure 6.15: absorbency rate for structures having pore size reduction at different
compression levels (a) 6den/3den, 6den (b) 9den/3den, 3den (c) 15den/3den, 3den ... 240
Figure 7.1: mean flow pore diameter of the samples with different rayon percentages ... 254
Figure 7.2: compression pressure vs. compression percent, different rayon fiber percentages
(legend show the rayon fiber percentages) ... 255
Figure 7.5: calculated slope α based on van Wyk equation ... 258
Figure 7.6: recoverability measurements in varying rayon fiber percentages ... 259
Figure 7.7: cross-sectional images of trilobal rayon fibers (left) dry (right)
wet-instantaneously ... 260
Figure 7.8: typical GATS absorbency curve for samples containing various fractions of rayon
fiber at different levels of compression ... 262
Figure 7.9: the GATS maximum absorption results under different compression levels for
samples containing various rayon fiber percentages ... 264
Figure 7.10: maximum absorbency (theory, GATS) versus solidity for the samples containing
various rayon percentages- solid lines shows the theoretical results and dots show the
experimental result ... 266
Figure 7.11: absorbency with 0.1% triton solution (non-swelling liquid) and n-octane
(swelling liquid) ... 267
Figure7.12: through plane absorbency rate of samples containing different rayon fiber
1
INTRODUCTION
Nonwoven fabrics are a specific type of porous structure composed of fibers that bonded together by
mechanical, thermal or chemical means. Nonwovens are used in a broad range of applications
including wipes, medical applications such as gowns, masks, etc., hygiene products, filters,
geotextiles, composites, and other durable and disposable products. One of the key applications of
nonwovens is in absorbent materials which consist of a wide range of products including baby wipes
and diapers, personal hygiene, tampons, adult incontinent pads, paper towels, tissues and sponges,
and industrial wipes. Fluid handling is a key functionality of these products. The nonwoven fabrics
need to be engineered to meet the requirement of liquid absorption depending on their particular
application. In order to develop innovative product based on a scientific approach, understanding of
the relation between fabric structure and liquid absorption is required (Mao and Russell 2003). This
indicates the necessity of the in-depth scientific study of absorbency phenomena in nonwoven fabrics
(Chatterjee and Gupta 2002a) .
Major contributors to absorption and release behavior of nonwovens are geometrical aspects of the
structure and the material properties, along with finish. With a given liquid, the porous structure plays
an important role on the absorption properties of nonwovens. The pore size of the nonwoven structure
is affected by fiber geometry including both of the size and shape of fiber, nonwoven structure which
can be solidity or packing density and fiber orientations, and finally by the external factors such as
compression. The fluid absorption of nonwoven materials is complex because of their complicated
pore structure as well as the deformation of pore structure either due to the compression applied
during the application or dimensional changes resulted from liquid absorption. Although the study of
liquid absorption in porous media is a relatively mature topic, the effect of nonwoven structural
Moreover, little attention has been paid to the interaction of fluid absorption and the porous structural
changes due to compression.
Absorbency is defined as a phenomenon that deals with the absorption of liquids by porous media of
nonwoven fabrics. Liquid absorption is a spontaneous flow of liquid into a porous structure, which is
driven by capillary forces. The absorption mechanism has been studied as a flow through a
configuration of capillary tubes using standard capillary flow equation since a century ago. Many
classical theories have been frequently applied on liquid flow in porous structures through a simple
capillary flow model to study their liquid absorption behavior, but with limited success. The highly
complex design and intricate pore geometry of nonwoven fabrics is a major limitation of application
of the classical theories on them. Although, the limitations of these models for analysis of more
complicated porous structure have motivated researchers to take into account different geometrical
factors (Cai et al. 2014; Young 2004; Shou, Ye, Fan, and Fu 2014; Shou, Ye, Fan, Fu, et al. 2014;
Mao 2009a; Staples and Shaffer 2002; Figliuzzi and Buie 2013). The studies have shown that the
physical and mechanical properties of fibers, as well as the structural and compressional
characteristics of fabrics play an important role in the ability of the textile fiber assemblies to wick
and hold fluid. A deep scientific understanding of the role these factors play in absorbency will
significantly influence on innovative designing and more functionally effective products of
future(Chatterjee and Gupta 2002a).
1.1
RESEARCH OBJECTIVES AND APPROACHES
Nowadays, the share of nonwovens market in absorbent products increases day by day, and as a
consequence the industry leaders pay more attention to the absorbent properties of the products in
made then the liquid flow can be modeled as a function of the compression pressure and from there
the absorbent product can be made such that the absorbency behavior is engineered to meet a specific
purpose. The first requirement for this is to measure the absorbency behavior of nonwovens fabric
under compression. There are some experimental and numerical works in the field of fibrous porous
materials such as nonwoven fabrics where they concerned with fluid absorption with no attention to
the fluid release. Moreover, they lack any sort of control over the experimental conditions.
On the other hand, the release properties of nonwovens play a very important role in the functionality
of many absorbent product including wipe, and hygiene products. To the knowledge of the writer,
there is no study in this field.
Accordingly, objectives of this study are 1) to understand fluid absorption and release behavior of
nonwovens and the effect of compression on these behaviors, 2) to develop techniques and protocols
to evaluate the fluid absorption and release behavior under varied compression profiles, and 3) to
evaluate the effects of fiber geometry and fiber absorbency on fabric pore structures and fluid
absorption and release behavior on compression.
To meet the objectives of this research, this study will focus on absorbency and release behavior of
nonwovens at different compression levels. For this purpose, developing the methodology and
techniques is the first goal that should be met. In order to decouple the effect of structural parameters
and fiber properties on the absorption properties of nonwovens, this study is divided in two phases.
The effect of structural parameters and fiber absorbency properties are being evaluated in two phases
of the project respectively. Two of the main factors, which define the fiber geometry include fiber
size and fiber cross-section. Our initial goal is to realize the effect of fiber geometry on the pore
absorption, as well as their compression behavior. Then the effect of heterogeneity is evaluated in
layered structures with non-uniform pore size along the flow direction.
Therefore experiments for the study of individual variables, which most govern the porous structure,
are designed with all other well controlled. Through air bonding and binders were used in order to
control solidity and keep it constant among our samples. On the other hand in order to control the
compressibility of the structures, 2 different percentages of binder were used. The resiliency of the
fabric is one of the factors plays an important role on determination of porous structure. Material
properties also influences on the absorbency behavior, therefore in the second phase, the samples
containing different percentages of absorbent fibers were produced and the effect of fiber absorbency
is discussed.
1.2
ORGANIZATION OF DISSERTATION
Chapter 2 of this dissertation is a review of literature. It discusses the fundamental of fluid absorption
including mechanisms of absorption both by the pore and by the fibers. Moreover the absorbency
behavior is discussed in terms of nonwovens and the influencing parameters of nonwovens. It is
continued by the characterization techniques of pore structure of nonwovens and their absorbency
behavior. Finally it talks over the compressional behavior of nonwovens and its importance on the
absorption behavior of nonwovens.
Chapter 3 of this dissertation argues how various fiber cross-sectional sizes and shapes, and binder
fiber percentages influence on the resistance to compression and recovery behavior of nonwovens.
Furthermore, the results are analyzed according to van Wyk compression theory as well.
Chapter 4 of this dissertation discusses the first part of the effect of structural parameters on
cross-sectional size. The absorption properties were measured at different flow directions. With the
knowledge that the fiber size controls the pore size of the nonwovens at a given solidity, the
absorption and release results were analyzed based on the solidity (porosity) and pore size of the
samples at various compression levels.
Chapter 5 of this dissertation continues the study on the effect of structural parameters on absorption
and release properties under compression by considering the effect of fiber cross-sectional shapes.
Different geometries of pores are generated with various fiber cross-sectional shapes including round,
pentalobal, and 4DG fibers. How these different pore geometry influences on absorbency behaviors
of nonwovens is disputed in this chapter. The pore characteristics were measured for various fiber
shapes at different compression levels.
Chapter 6 of this dissertation is the last part of the structural parameters effect study. In this chapter,
the effect of heterogeneity of the nonwovens along the flow direction is discussed. For this purpose
the layered structures were made considering both the pore size reduction and expansion.
Furthermore, the compression and recovery properties of these samples are argued.
Chapter 7 of this dissertation is an investigation of the fiber absorbency effect. The absorbency
behavior is compared for the samples containing various percentages of PET fibers (non-absorbent
fiber) and rayon fiber (absorbent fibers). The rayon fiber swelling and its influence on the pore
REFERENCES
Cai, Jianchao, Edmund Perfect, Chu-Lin Cheng, and Xiangyun Hu. 2014. “Generalized Modeling of
Spontaneous Imbibition Based on Hagen–Poiseuille Flow in Tortuous Capillaries with
Variably Shaped Apertures.” Langmuir 30 (18): 5142–51. doi:10.1021/la5007204.
Chatterjee, P. K., and B. S. Gupta. 2002. Absorbent Technology. Amsterdam; Oxford: Elsevier
Science. http://www.sciencedirect.com/science/book/9780444500007.
Figliuzzi, B., and C. R. Buie. 2013. “Rise in Optimized Capillary Channels.” Journal of Fluid
Mechanics 731 (September): 142–61. doi:10.1017/jfm.2013.373.
Mao, N. 2009. “Unsteady-State Liquid Transport in Engineered Nonwoven Fabrics Having Patterned
Structure.” Textile Research Journal 79 (15): 1358–63. doi:10.1177/0040517509342312.
Mao, N., and S. J. Russell. 2003. “Anisotropic Liquid Absorption in Homogeneous Two-Dimensional
Nonwoven Structures.” Journal of Applied Physics 94 (6): 4135. doi:10.1063/1.1598627.
Shou, Dahua, Lin Ye, Jintu Fan, and Kunkun Fu. 2014. “Optimal Design of Porous Structures for the
Fastest Liquid Absorption.” Langmuir 30 (1): 149–55. doi:10.1021/la4034063.
Shou, Dahua, Lin Ye, Jintu Fan, Kunkun Fu, Maofei Mei, Hongjian Wang, and Qing Chen. 2014.
“Geometry-Induced Asymmetric Capillary Flow.” Langmuir 30 (19): 5448–54.
doi:10.1021/la500479e.
Staples, Thomas L, and Donna G Shaffer. 2002. “Wicking Flow in Irregular Capillaries.” Colloids
and Surfaces A: Physicochemical and Engineering Aspects 204 (1-3): 239–50.
doi:10.1016/S0927-7757(01)01138-4.
Young, Wen-Bin. 2004. “Analysis of Capillary Flows in Non-Uniform Cross-Sectional Capillaries.”
Colloids and Surfaces A: Physicochemical and Engineering Aspects 234 (1-3): 123–28.
2
LITERATURE REVIEW
2.1
FLUID ABSORPTION BASICS OF NONWOVEN FABRICS
Nonwovens are the assemblies of short staple fibers or infinitely long continuous filaments, which are
bonded together through mechanical, thermal or chemical process. For sake of brevity a detail
account is not given here, readers could refer to (Batra and Pourdeyhimi 2012) for technologies and
methods used to produce nonwoven fabric. The nonwovens can be highly dense and strong and on the
other hand they can be porous and compressible (Pourdeyhimi, Maze, and Tafreshi 2006). Since
nonwovens are capable of forming a stable structure even at very high porosity, they are being used in
many functional end-uses.
Nonwoven have been used in lots of different applications including air filters, wipes, insulations,
barrier fabrics, surgical masks, cosmetic products, and hygiene products such as diapers. One of the
main applications of the nonwoven is in absorbent products. In case of absorbent product the ability
to absorb the liquid very fast and also holding large quantity of the liquid are very important.
Absorption phenomenon in absorbent product is a multiphase flow where the air is replaced by the
invading liquid. When an absorbent product is in contact with the fluid, the fluid can be wicked by
pore inside the structure or it can be absorbed by the fiber itself. In the following sections, the
literatures are reviewed to cover the theoretical background of absorption phenomenon, also two
different phenomena of absorption by pore and absorption by fiber.
2.1.1
Liquid absorption in the porous structure
Absorption phenomena are the spontaneous physical imbibition of a liquid in contact with a solid.
The absorption can occur by either of two different modes. In the first mode, the pores include those
in the macroscopic length scale either related to a continuous porous media or a porous media in the
form of closely adjacent particles. These pores are filled with the gas or vapor at ambient pressure and
liquid enter the pores by bulk convection. This phenomenon is referred to as capillary absorption or
wicking. In the other mode, the porous media involve the molecular dimension voids where the liquid
enters by diffusion process. This process happens when the macroscopically continuous solid has a
molecular structure of a cross-linked network and the molecules have sufficient affinity to cause the
liquid to diffuse inward them and expand the network gradually. This generally is referred to
diffusion and is accompanied by swelling phenomena(Chatterjee and Gupta 2002a). In the next
section, first I will discuss the absorptions by pores and then I will explain the phenomena of
absorption by fibers or diffusion.
2.1.1.1
Mechanism of absorption by pore
A porous material consists of different states of matter and the non-solid phase called as pores or void
(Bear 1988). Since some of the pores are interconnected, they form an open path to others and they
called open pores, while the other pores are surrounded by solid phase in the way that non-solid state
cannot escape and they called closed pores. Moreover, there are dead end pores, which are open to
one side of porous media, but they end inside the structure. Depending on the invasion direction, the
liquid may enter these pores however cannot flow through the porous structure.
Two main processes in describing the liquid uptake and transport into the materials include wetting
phenomena is spontaneous transport of liquid into the porous structure by capillary force. The liquid
is able to wick into a fabric and being transported by the porous structure only if it at least partially
wets the fibers (Kissa 1996; Patnaik et al. 2006; Pan and Zhong 2006). In order to wicking be
practically significant, the interfacial areas in the system should be large in comparison with the bulk
volume. It means that the ratio of solid-liquid interfacial areas is large compared to the liquid bulk
volume (Chatterjee and Gupta 2002b). The two phenomena of wetting and wicking will be discussed
in the following section.
2.1.1.1.1
Wetting
Wetting is a very important and complicated phenomenon, which influences many manufacturing
processes, as well as the functionality of end use materials. Wetting phenomena is even further
complicated in case on fibrous materials. The wetting of a solid surface is resulted from its contact
with a specified liquid under specific conditions (Patnaik et al. 2006).
Considering the molecules of a liquid, the molecules in the bulk of liquid have an equal attractive
force in all directions. However, molecules in the surface of the liquid experience an imbalance of
force, with the net force directed towards the interior or the bulk liquid. This causes that the
molecules in this dynamic surface layer always has a tendency to move towards the interior.
Consequently there is a free energy at the surface of the liquid. This energy is called "surface free
energy" of the liquid and it tends to keep the liquid surface area in a minimum and so it prevents from
the advancement of the liquid over the solid surface. In the interaction of the liquid with a solid
surface, if the solid surface has a sufficient surface energy, which overcomes the free surface energy
of the liquid, the liquid can wet the solid completely. Surface free energy is also termed as surface
tension and is quantifies as force per unit length with unit of mN/m or dynes/cm(Patnaik et al. 2006).
and the specific surface free energy are dimensionally and mathematically identical, however the
specific surface energy is more general and it can be used for solids as well as liquid surfaces and
interface. The driving force in any closed systems comes from the tendency for minimizing the free
energy of the system, F. To spontaneously change the system configuration in a capillarity system, it
is required that the dF of the whole system be negative and not just for the phase interfaces
(Chatterjee and Gupta 2002b).
Considering the liquid resting on a solid surface, there are various contact interactions as it is shown
in the figure 2.1 between solid, liquid and vapor.
The forces involved in this situation are given by the Young-Dupre equation as it is shown in the
equation (2.1).
𝛾𝑆𝑉− 𝛾𝑆𝐿 = 𝛾𝐿𝑉 𝑐𝑜𝑠 𝜃 (2.1)
γ is the interfacial tension that exists between the contacting surfaces and S, L and V stand for solid,
liquid, and vapor and θ is the equilibrium contact angle. This equation is widely used in explaining
wetting and wicking, although the equation is valid only for a drop resting at equilibrium on a
smooth, homogeneous, impermeable, and nondeformable surface. The young equation appears as a
force balance derivation, and consequently it leaves the quantities of the terms 𝛾𝑆𝑉, and 𝛾𝑆𝐿 undefined
Vapor
γSV
γLV
γSL
Liquid
Solid θ
operationally and almost impossible to measure. It is the motivation behind some study to define the
young equation with a thermodynamic meaning (Adam 1964; Adamson and Ling 1964). According
to Young-Dupre equation, the contact angle provides the relation between the adhesion of the liquid
to the solid, and its cohesion to itself (Adam 1964).
The wetting phenomena in non-ideal surfaces such as nonwoven surfaces are complicated because of
surface roughness and other factors. The contact angle, θ, as it is shown in the figure1 is the angle
between the tangent to the liquid-vapor interface and the solid-liquid interface and consequently it
depends on three interfacial tensions γSV, γSL, and γLV. When the interfacial energy of the solid in
contact with vapor (γSV) is higher than the interfacial energy between the solid and the liquid (γSL), the
solid- air interface is replaced by the solid-liquid interface. In this situation, θ must be between 0° and
90°. If γSV is smaller than γSL, the contact angle will be between 90° and 180°. In the other word, if the
adhesion of the liquid to the solid is less than the self-cohesion of the liquid to itself, a contact angle
takes place between the liquid and solid. Larger the contact angle, lower is the adhesion between the
solid and liquid. Otherwise, if the adhesion is equal to or greater than the cohesion, the contact angle
is zero and the liquid spread over the surface of the solid and is said to wet the solid. Therefore two
different equilibrium regimes may be found including partial wetting with a finite contact angle θ, or
In the other way, for a given system of liquid, solid, and air contact, it may be shown that (Richards
1931).
𝛾𝐿𝑉+ 𝛾𝑆𝑉− 𝛾𝑆𝐿 = 𝑊 = 𝛾𝐿𝑉(1 + 𝑐𝑜𝑠 𝜃) (2.2)
Where γLV, γSV, and γSL are the surface densities of free energy for the air-liquid, air-solid and
liquid-solid respectively, θ is the contact angle between liquid-solid interface, and W is the work necessary
to separate unit area of liquid from solid. If W < 2γLV, θ may vary anywhere between 0° and 180°.
If, However, W ≥ 2γLV then θ is zero and the liquid will spread over the solid surface. It means that
the liquid wet the solid (Richards 1931).
Zisman introduced an empirical criterion for the wetting of solid substrate. The critical surface
tension for each solid substrate (γc) determines the wetting situation of a solid with a given liquid.
There is partial wetting when the liquid surface tension γ > γc and total wetting when γ < γc (Zisman
1964).
Spreading is the flow of liquid at least two molecular layers thick over a solid. In spreading the
solid-liquid and solid-liquid-vapor interfaces increase, while the solid-vapor interface decreases. In
non-equilibrium situation, we have the spreading coefficient, which is defined based on the interfacial
energies as below:
𝑆 = 𝛾𝑆𝑂− 𝛾𝑆𝐿− 𝛾 (2.3)
θ
θ
(a)
(b)
(c)
Where 𝛾𝑆𝑂 is a solid/vapor interfacial energy associated with a dry solid surface, while 𝛾𝑆𝑉 is the
solid/ vapor interfacial energy in a moist surface. For spreading to be spontaneous, the spreading
coefficient has to be positive (Patnaik et al. 2006; de Gennes 1985).
The Physical contact angle is the physically measurable angle between the liquid-air interface and the
solid-liquid interface in a static liquid-solid-vapor system. In this definition, it does not matter
whether or not the system is in stable thermodynamic equilibrium. The equilibrium contact angle,
however, is defined in terms of the interfacial free energies at three-phase line boundary by Young’s
equation. The physical contact angle and equilibrium contact angle are not necessarily equal. With
special manipulation, the physical contact angle might show a higher or a lower value. The highest
achievable static value of physical contact angle is called the advancing contact angle and the lowest
static value is called the receding contact angle (Minor et al. 1959).
A serious practical problem associated with the concept of contact angle is the fact of existence of
hysteresis between advancing and receding contact angles. The advancing contact angle is measured
when the fluid intruding the capillary and displacing another fluid. The displaced fluid is usually
understood to be the vacuum; in contrast the receding one is measured through the same fluid while it
is being displaced. Therefore the contact angle measurement is very difficult (Dullien 1991). Gupta
and Whang showed while the receding value is governed mostly by the chemical make-up of
materials, the advancing is influenced by other factors such as the physical and morphological
structures, properties such as molecular orientation, crystallinity, and surface texture or roughness
(Gupta and Whang 1999). According to Adamson, the three types of causes of contact angle
hysteresis are contamination of either liquid or solid, surface roughness, and surface immobility on a
macromolecular scale. The immobility, for example, happens where the liquid contains a surfactant
Either the liquid or solid movement by some external factors results in the changes in static
arrangement of an equilibrium liquid-solid contact angle. This phenomenon is very critical especially
in the situation where the dynamic wetting behavior of system is important for instance in coating
process. Researchers showed that the dynamic contact angles are strong functions of the apparent
viscosity of the liquid at the particular wetting speed whether the liquid is Newtonian or
non-Newtonian.
Surface wetting characteristics of fibers include the cosine of contact angle, the work of adhesion, and
the surface energy. All of these characteristics are related as we observed in the previous discussion,
but they describe various behaviors. Surface energy is the inherent ability of a material to interact
with other materials and the contact angle is the result of such interactions. Employing two different
liquids, one polar and one non-polar liquid in order to determine the surface energy of the materials, it
is possible to determine the polar contribution and dispersive contribution of surface energy of the
solid. In the fluid absorption properties, the contact angle plays a very important role and the cosine
of contact angle represents the wettability of a materials and also it is used in predicting the capillary
forces and imbibition rate of a fluid as we discuss them later (Gupta with Hyun Suk Whang 2000).
The contact angle can be obtained via different methods (a) from a direct photograph (b) from the
reflection (or deflection) of rays by the liquid prism (c) by knowing the interfacial energies, especially
for small contact angles (d) from the rise of liquid column in a fine capillary. We will discuss the
latter techniques in the section 2.1.1.1.2 (de Gennes 1985).
There are different methods available for measuring the contact angle in fibers. The static contact
angle can be measured by direct observation of the physical contact angle on the fiber through optical
microscopy. But the value obtained from this method is not satisfactory for fibers due to the
determination of dynamic contact angle is through wilhelmy principle. The Wilhelmy dynamic
procedure is considered to be the most effective and useful way of assessing this property (Gupta with
Hyun Suk Whang 2000). In this method, the vertical component of advancing and receding attractive
forces across an interface between a liquid surface and a partially immersed solid is calculated.
According to the Wilhelmy formula, the pull, F, exerted on a solid rod inserted into a mass of liquid is
expressed as
F = 𝑝𝛾 𝑐𝑜𝑠 𝜃 (2.4)
Where p is the perimeter of the solid rod along the three-phase boundary line, 𝛾 is the liquid surface
tension, and 𝜃 is the contact angle of the system. The validity of this equation is questioned in some
authorities (Minor et al. 1959).
However it is difficult to conduct this method on staple fibers because they are short, fine, or crimped
(Gupta with Hyun Suk Whang 2000). Moreover a challenging part for conducting this method is the
calculation of perimeter of the fiber at the three-phase contact line. This is a problem mainly in the
situation that the liquid does not wet the fiber completely.
Whang and Gupta studied the wetting forces for cotton, rayon Galaxy, and regular rayon through
wilhelmy testing method. They used the sinkers in order to assure that fibers are straight, rigid, and
vertically oriented during immersion (Gupta with Hyun Suk Whang 2000). Therefore the force
measured by the microbalance is
𝐹 = 𝑚𝑔 + 𝐹𝑤− 𝐹𝑏𝑠− 𝐹𝑏𝑓± 𝐹𝑣 (2.5)
𝐹𝑤= 𝑃𝛾𝐿𝑉𝑐𝑜𝑠 𝜃 (2.6)
Where mg is the combined weight of the sample and sinker; Fw the actual wetting force, Fbs the
buoyancy force of the sinker, Fbf the buoyancy force of the sample, and Fv is the viscous frictional
advancing and positive sign for the receding mode. Usually the weight of the sample and sinker is
tared out at the beginning of the test. Also the viscose frictional force and buoyancy force of the fiber
are negligible compared to wetting force. The Sinker buoyancy force can be calculated from the
dimension of the sinker and the density of the liquid. They also measured the perimeter of the fibers
through image analysis of SEM micrographs of fiber cross-sections. The result showed the wetting
forces vary among different fibers with Galaxy rayon fiber having the largest, regular rayon the
lowest, and cotton an intermediate value. On the other hand, the fluctuations vary in reverse order.
They are maximum for regular rayon and minimum for Galaxy. The fluctuations in the wetting force
represent the random or systematic surface irregularities (Bendure 1973). It was also observed that
Galaxy fiber with trilobal cross-section having the lowest and rayon fibers the largest contact angle.
The cosine of contact angle reflects the relative abilities of these fibers to attract and imbibe fluid by
capillary action. This was in agreement with their separate study showing the webs made of Galaxy
and cotton had much higher rates of water absorption than a web of regular rayon with the same
structures. The lowest hysteresis between the receding and advancing contact angle was observed in
case of Galaxy fibers. The Galaxy fibers is spun from a standard viscose solution employing standard
spinning conditions, the only exception is that the spinneret holes are trilobal rather circular, and
compared to regular rayon has higher purity, smoother, and more homogenous surface (Wilkes and
Bartholomew 1995). This is why less hysteresis and fluctuation is observed in Galaxy fibers. They
also discussed the difference in cross-sectional morphology of Galaxy fibers having the longitudinal
ridges along the surface of the trilobal fiber as another factor results in a lower hysteresis. The ridges
imbibe the fluid ahead of the fluid-fiber interface, and it makes the situations of the advancing and
receding mode more comparable. They also measured the polar and dispersive surface energy of
dispersive contributions to the surface tension. In case of hydrophilic materials such as cellulosic
fivers, polar contribution accounts for larger portions of the total energies.
Table 2.1: surface energies of different fibers (Gupta with Hyun Suk Whang 2000; Gupta and Whang 1999)
Fiber Advancing contact angles in Water
Surface energy, mN/m
Polar Dispersion Total
Cotton 34.0 41.6 19.3 60.9
Galaxy (Rayon with trilobal cross-section)
21.5 51.7 16.4 68.1
Regular Rayon 55.5 24.4 21.7 46.1
Cellulose acetate 54.8 17.4 35.04 52.4
Polyester 79.2 4.1 37.74 41.88
Polypropylene 98.5 1.8 21.2 22.99
In another research (Gupta and Whang 1999), Gupta and Whang studied the surface wetting
behaviors of polyester, polypropylene, and cellulose acetate fibers in several different sizes and
cross-sectional shapes. They observed that among these fibers, the cellulose acetate has the lowest and
polypropylene the highest value of the contact angles. These differences are largely due to the
differences that existed in the chemical structures of the fibers. Cellulose acetate fibers, among the
three, have the highest value of the wettability index because of the molecular structure of the fiber.
The cellulose acetate fiber is only partially acetylated by replacing some of the hydroxyl groups by
comparatively inert acetyl (CH3.COO-) and still had hydroxyl groups. Moreover the better wettability
property of polyester fibers over polypropylene is because of the presence of more polar ester groups.
Polypropylene is strictly a hydrocarbon material and lacked such groups. The values of total surface
energy, as well as polar and dispersive contribution of the surface energy for these fibers is given in
table 2.1. The surface energy is highest in cellulose acetate fiber, polyester fibers, and polypropylene
fibers respectively. Also it is seen that the polar fraction of polypropylene fibers, and polyester fibers
contact angle for a low surface tension fluid which wet out a fiber is not always valid. For instance
use of hexadecane as the fluid on cellulose acetate did not support this assumption and led to the
underestimation of the perimeter values.
2.1.1.1.2
Wicking
Spontaneous flow of a liquid in a porous structure is called wicking, which is driven by capillary
pressure, and partially wetting is a prerequisite for wicking. It was seen in the previous section that
the initial wetting process, in which a liquid spread over a dry porous medium, is involved with the
adhesive forces due to their influence on the contact angle. But after the medium is wetted the
adhesive force does not influence on producing a motion of the liquid. They just hold the adsorbed
thin layer in contact with the solid surface and the liquid outside the adsorbed layer is free to move
under the action of unbalanced forces (Richards 1931).
According to the fiber-liquid interactions, the wicking processes can be divided into four categories:
capillary penetration only; simultaneous capillary penetration and diffusion of the liquid into the
interior of the fibers; capillary penetration and adsorption of a surfactant on fibers; and simultaneous
capillary penetration, diffusion of the liquid into the interior of the fibers, and adsorption of surfactant
on fibers. Wicking can be taken place from an infinite liquid reservoir and wicking from a finite or
limited reservoir (Pan, Gibson, and Textile Institute (Manchester) 2006).
The term capillarity initially used to describe the action of liquids in fine tubes. However it is
nowadays used in connection with a wide variety of phenomena including the flow of liquids through
porous media. It was indicated that the capillary conduction of liquids through porous media is
similar to the flow of liquids through pipes or fine tubes to the extent that the flow may be described
in terms of the pressure gradient in the liquid and gravity (Richards 1931). Therefore, capillary
phenomenon is resulted from the forces acting in the boundary surfaces of liquid, and the origins of
these forces are in the cohesive and adhesive attractions, which are applied between molecules. One
of the most prevalent cases of capillary action takes place when one surface of the liquid is in contact
with air. In the case of contact between the liquid and solid such as liquid flow in porous media, the
free energies of these surfaces also play an important role.
Capillary pressure relates the pressures in the two fluid phases. In a single capillary tube, the capillary
pressure is defined as the pressure increment between the concave side and the convex side of a
meniscus (Dullien 1991). Pressure in the capillary flow of a porous medium is determined by the
tension and the curvature of the air-water interface. The difference in the pressure across the concave,
P1, and the pressure in the convex side,P2, of the curvature of a liquid-vapor interface is caused by the
liquid surface tension, , and is given in the Young-Laplace equation as below:
𝑃1− 𝑃2 = 𝛾 (𝑟1
1+
1 𝑟2) (2.7)
In which r1, and r2 are the principal radii of curvature of the surface.
Liquid surface free energy decreases due to the curvature of meniscus in the narrow boundaries of the
pores (Since shrinking decreases the surface energy), the tendency of do so must be balanced by a
pressure difference across the liquid-air interface ΔP such that the work against this pressure
difference is just equal to the work done in forming the additional amount of surface in the curvature
of meniscus (Adamson 1997).
Applying this definition into the liquid movement into a pore structure, the capillary pressure means
the differential pressure across the liquid-air interface due to the meniscus curvature in the narrow
confines of the pores (Chatterjee and Gupta 2002b). For a capillary with a circular cross section
where the two principal radii of the curvature (r1 and r2) are equal, the Laplace equation (given in
applied to simple capillary tubes. Moreover in this equation the radius of curvature is converted to
capillary pore radius through the geometrical relationship between these two as shown in figure 2.3
𝑝 =2𝛾 𝑐𝑜𝑠 𝜃𝑟
𝑐 (2.8) 𝑟𝑐: The capillary (pore) radius
𝛾: The surface tension of the advancing liquid
𝜃: The contact angle at the liquid-solid-air interface
As it was mentioned in the previous discussion, contact angle is a material property. Consequently
according to Laplace equation, the magnitude of the capillary pressure is related to the material
properties through contact angle and also to the structure through capillary radius that is the pore
radius in the nonwoven structure. Equation 2.6 indicates that lower the pore radius, higher the
magnitude of the capillary pressure is. Thus, considering the capillary pressure as a driving force for
rc
R
θ
h
wicking phenomena, it means that for a given liquid and a specific nonwoven material, the wicking
phenomena occurs more spontaneously in the structure with smaller pore diameter.
Minor III, et al. studied the behavior of different liquids on parallel array of the two fibers for a
thorough understanding of the wicking process. They observed that the liquid did not wick in a
system of higher contact angle until the fibers were spaced enough close to each other. From a
thermodynamic point of view, wicking occurs when the changes in the free energy of the system, dF,
relative to the changes in the distance traveled by the liquid front, ds, in the direction away from the
liquid reservoir is negative. The free energy changes can be described through the equation 2.9
𝑑𝐹
𝑑𝑠=
𝑑
𝑑𝑠(𝐴𝑟𝑒𝑎 𝐿𝑉). 𝛾𝐿𝑉+ 𝑑
𝑑𝑠(𝐴𝑟𝑒𝑎 𝑆𝐿). 𝑘2 (2.9)
Where LV is the interfacial free energy of liquid-air interface and k2 is the difference between the
interfacial free energy of solid-liquid interface, SL, and solid-air interface, SV . In the system, where
the contact angle is less than 90°, k2 is negative and only in these system dF/ds can be negative and
the wicking can occur. In a close spacing between the two parallel fibers, the d (Area LV)/ds decrease
while d (Area SL)/ds remain constant. In this situation, wicking takes place (Minor et al. 1959).
The capillary pressure equation is also defined and derived by the internal wetting force (Fwi) in the
capillary area (πri 2
)
𝑝 = 𝐹𝑤𝑖
𝜋𝑟𝑖2=
2𝜋𝑟𝑖𝛾 𝑐𝑜𝑠 𝜃
𝜋𝑟𝑖2 =
2𝛾 𝑐𝑜𝑠 𝜃 𝑟𝑖 (2.10)
Capillary forces can be measured with a microbalance through vertically connecting a capillary to the
microbalance (Hsieh 1995).
When the capillary rise is stopped, the capillary pressure must be equal to the hydrostatic drop in the
column of liquid in the capillary due to the gravity.
Where 𝜌 and 𝜌𝜈 are the densities of the liquid and the vapor. The maximum height reached by the
liquid is expressed as Jurin’s equation and it is given as below:
ℎ𝑒𝑞 =2𝛾 𝑐𝑜𝑠 𝜃
𝑟𝜌𝑔 (2.12)
In this system, in case of having a contact angle lower than 90° or positive cos , the capillary
pressure is higher than zero and spontaneous intrusion of fluid into the pore structure occurs. On the
other hand for contact angle higher than 90° or negative cos , the capillary pressure is negative and
fluid cannot intrude spontaneously (Figure 2.4). Visualizing the porous medium as an assemblage of
capillaries, the combined pressure in all capillaries will give rise to the capillary pressure.
2.1.1.1.3
Liquid penetration through Porous materials
The Capillary flow might happen in two different modes in the porous mediums. The “wetting”
process is the process in which the wetting phase displaces the non-wetting phase. This process is also
called “spontaneous imbibition”. If the capillary pressure is defined as the difference between the
pressure of non-wetting phase and wetting phase, the capillary pressure must be decreased in a
wetting process. It means the pressure on the non-wetting phase is gradually decreased. In this case,
the wetting fluid will penetrate into the capillary (displacing the non-wetting phase) until the locally
widest pore cross-section, with the greatest pore radius is reached. At this point, the capillary pressure
is a local minimum and the capillary pressure is less than the minimum capillary pressure in the
θ
θ
narrower portion of pore with the smaller pore radius. Therefore the intrusion of the wetting phase
happens in a non-equilibrium manner in the narrower portion of pores. The non-equilibrium
penetration of the wetting phase continues until the meniscus reach the next wider pore cross-section.
At this point in order to continue penetration, it is required to reduce the pressure applied on the
non-wetting phase further. On the other hand, “Drainage” is the process in which the non-non-wetting phase
displaces the wetting phase. This process also called as “desaturation” or “de-wetting”. The throat
pore is defined as the local minimum pore radius. In drainage process, the non-wetting fluid will
penetrate into the capillary (displacing the wetting phase) until the pore throat is reached. At that
point the capillary pressure must be increased further to overcome the equilibrium value at the pore
throat. Since the capillary pressure at the pore throat exceed the equilibrium value in the expanding
portion of pores with larger pore radius. When the capillary pressure is enough to displace the
non-wetting phase in pore throat, the displacement of the non-wetting phase happens in the expanding portion
of the pores in a non-equilibrium penetration manner. This non-equilibrium penetration continues
until the meniscus reached the next narrower pore throat. At this point, it is required to increase the
pressure applied on the non-wetting phase further in order to penetration of non-wetting phase
continues (Dullien 1979). The non-wetting phase in these definitions is non-wetting only relative to
the certain other fluids, which had greater wettability with the solid surface preferentially.
One of the limitations of the capillary pressure concept is the existence of the phenomenon of
hysteresis. In other word, the capillary pressure curves are different for drainage and imbibition
process. The instability of interface configuration is one reason for the hysteresis (Scheidegger 1974).
In the liquid absorption on nonwovens, basically it is assumed that the air at atmospheric pressure is
the non-wetting fluid and the nonwoven as an assemblage of the pores is connected with a
formed in the connecting area of porous medium with the wetting fluid. There will be a pressure drop
in the wetting fluid between the concave side of the meniscus and the convex side where the air is at
atmospheric pressure. The meniscus will advance spontaneously to the convex side. This process is
called “free spontaneous” or “uncontrolled” imbibition.
There are some limitations in the application of Laplace equation into nonwoven structures in order to
determine the capillary pressure. Some of the aspects which make a nonwoven structure a complex
structure and cause some limitation to the application of Laplace equation to the nonwoven structures
include different sizes of pores, interconnectivity of pores in three-dimensional network, and tortuous
path of liquid inside the porous media.
The wicking dynamics or the kinetics of wicking is very important in absorption behavior of fibrous
materials. In the following, we are going to discuss it.
The Hagen-Poiseuille law for laminar flow through pipes can be employed for an idealized tube
structure. This law states that the volumetric flow rate is proportional to the pressure drop gradient
along the tube.
𝑞 = (𝑟𝑐2
8𝜂)
𝛥𝑝 𝐿 (2.13)
Where 𝛥𝑝 in the net driving pressure or pressure drop across L, rc the capillary radius, L the wetted
length of tube, 𝜂 the fluid viscosity, and q the volume flux. As the Hagen-Poiseuille law is applied to
capillary rise, L would be the height of rise and 𝛥𝑝 would be p-ρgL for upward flow where p is the
capillary pressure given by Laplace equation, ρ is the liquid specific gravity, and g is gravitational
acceleration.
There are different ways that the fluid flow in the porous media can be viewed. The porous media can
channel diameter of the conduit. Moreover, the porous media can be looked at as an assemblage of
submerged objects and the drag resistance will be studied.
In one approach, the liquid flow into a porous material is described by Lucas-Washburn equation
(Chen et al. 2009). Lucas-Washburn equation (equation 2.14) is the equation that deals with the
wicking or the rate of liquid penetration into the capillaries when they are under capillary pressure
and flow happens from a saturated reservoir. This equation is resulted from applying the
Hagen-Poiseuille law to the capillary diffusion and determines the variation of liquid height as a function of
time in a one direction. Therefore, rate of liquid penetration into a horizontal capillary and under the
capillary pressure is defined as:
𝑑𝑙
𝑑𝑡=
𝑟 𝜂
𝛾
4𝑙𝑐𝑜𝑠 𝜃 (2.14)
In case of vertical wicking where the flow is resisted by gravity, the rate of liquid penetration is
defined as
𝑑𝑙
𝑑𝑡=
𝑟2
8𝜂𝑙(
2𝛾 𝑐𝑜𝑠 𝜃
𝑟 − 𝜌𝑔𝑙) (2.15)
Where 𝑙 is Height of liquid at time t, 𝑟 the capillary (pore) radius, 𝛾 the surface tension of liquid, 𝜂
the viscosity of the liquid and 𝜃 is the contact angle between liquid and fiber.
It shows that the rate of liquid penetration, when it is only under its own capillary pressure is directly
proportional to the pore radius, to the cosine of contact angle (wettability index), to the ratio of the
surface tension to the viscosity of the liquid and on the other hand inversely proportional to the
capillary rise or the length already filled by the liquid (Washburn 1921). It is noteworthy to mention
that the flow is resisted also by a viscose shear stress exerted by the capillary wall.
By integrating the equation 2.14, Washburn suggested the correlation between the penetration