HIGHLIGHTED ARTICLE
| MULTIPARENTAL POPULATIONS
Increased Power To Dissect Adaptive Traits in Global
Sorghum Diversity Using a Nested Association
Mapping Population
Sophie Bouchet,*,1Marcus O. Olatoye,* Sandeep R. Marla,* Ramasamy Perumal,*,†Tesfaye Tesso,* Jianming Yu,‡Mitch Tuinstra,§and Geoffrey P. Morris*,2 *Department of Agronomy, Kansas State University, Manhattan, Kansas 66506,†Agricultural Research Center, Kansas State University, Hays, Kansas 67601,‡Department of Agronomy, Iowa State University, Ames, Iowa 50011, and§Department of Agronomy, Purdue University, West Lafayette, Indiana 47907 ORCID ID: 0000-0002-3067-3359 (G.P.M.)
ABSTRACT Adaptation of domesticated species to diverse agroclimatic regions has led to abundant trait diversity. However, the resulting population structure and genetic heterogeneity confounds association mapping of adaptive traits. To address this challenge in sorghum [Sorghum bicolor(L.) Moench]—a widely adapted cereal crop—we developed a nested association mapping (NAM) pop-ulation using 10 diverse global lines crossed with an elite reference line RTx430. We characterized the poppop-ulation of 2214 recombinant inbred lines at 90,000 SNPs using genotyping-by-sequencing. The population captures 70% of known global SNP variation in sorghum, and 57,411 recombination events. Notably, recombination events were four- to fivefold enriched in coding sequences and 59 untranslated regions of genes. To test the power of the NAM population for trait dissection, we conducted joint linkage mapping for two major adaptive traits, flowering time and plant height. We precisely mapped several known genes for these two traits, and identified several additional QTL. Considering all SNPs simultaneously, genetic variation accounted for 65% offlowering time variance and 75% of plant height variance. Further, we directly compared NAM to genome-wide association mapping (using panels of the same size) and found that flowering time and plant height QTL were more consistently identified with the NAM population. Finally, for simulated QTL under strong selection in diversity panels, the power of QTL detection was up to three times greater for NAMvs.association mapping with a diverse panel. Thesefindings validate the NAM resource for trait mapping in sorghum, and demonstrate the value of NAM for dissection of adaptive traits.
KEYWORDSquantitative trait loci; adaptation; linkage mapping; genome-wide association studies; population structure; multiparental populations; MPP
M
ANY of the world’s major crop species have adapted to diverse agroclimatic regions, resulting in abundant natural variation for trait dissection and crop improvement (Vavilov 2009; Meyer and Purugganan 2013; Olsen and Wendel 2013). Genetic dissection of quantitative traits in crop species provides valuable insights into plant biology(Nordborg and Weigel 2008; Olsen and Wendel 2013), and facilitates breeding of improved varieties (Bernardo 2010; Cooperet al.2014). To date most known quantitative trait loci (QTL) for crop adaptive traits were identified using linkage mapping with biparental recombinant inbred line (RIL) fami-lies (Mickelbartet al.2015). However, biparental mapping is constrained by a lack of allelic diversity, which limits the char-acterization of genetic architecture, and a lack of recombination events, which limits the resolution of mapping (Myles et al. 2009). Genome-wide association studies (GWAS) capture more allelic diversity and recombination events, but population structure resulting from isolation or adaptation can lead to spurious and synthetic associations (Plattet al.2010; Brachi et al.2011). While statistical models with population structure (Q) and kinship (K) terms [e.g., mixed linear models (MLM)] should reduce false positives, they are also expected to have Copyright © 2017 by the Genetics Society of America
doi:https://doi.org/10.1534/genetics.116.198499
Manuscript received December 23, 2016; accepted for publication March 9, 2017 Available freely online through the author-supported open access option.
Supplemental material is available online athttp://www.genetics.org/lookup/suppl/ doi:10.1534/genetics.116.198499/-/DC1.
1Present address: Génétique, Diversité, Ecophysiologie des Céréales (GDEC), Institut National de la Recherche Agronomique (INRA), l’Université Clermont II Blaise Pascal (UBP), 63039 Clermont-Ferrand, France.
low power to detect causal variants that are associated with population structure (i.e., they will increase false negatives) (Bergelson and Roux 2010). Indeed, when MLM are used to map QTL for adaptive traits likeflowering time in rice (Huang et al.2010) or inflorescence architecture in sorghum (Morris et al.2013a), the resulting QTL are barely above the signifi-cance threshold.
Multiparental linkage-association approaches have been developed to combine the strengths of linkage and association approaches, capturing more allelic diversity and recombina-tion than biparental families, while avoiding the spurious correlations typical of diverse association panels (Cavanagh et al. 2008; Brachi et al. 2011). By crossing multiple lines originating from different subpopulations, trait correlations due to linkage disequilibrium (LD) are broken down, alleles in repulsion phase between subpopulations are decoupled, and allele frequencies are balanced (i.e., some rare alleles are dropped while others are brought to moderate frequency). The nested association mapping (NAM) design, which uses multiple RIL families connected by a single common parent (Yuet al.2008), has been particularly successful for complex trait dissection in maize (Buckleret al.2009; Tianet al.2011; Li et al. 2015). Joint linkage (JL) mapping, in which QTL terms arefit nested within families, helps distinguish allelic series from linked genes (Buckleret al.2009; Würschumet al. 2012). The power of QTL detection has been investigated for NAM populations of different sizes (Yuet al.2008), and for different cross designs (Stich 2009; Klasenet al.2012; Liu et al.2013). However, to our knowledge, no study has com-pared mapping power between diverse association panels and NAM populations of the same sample size (empirically or with simulated traits), or determined if NAM is more powerful for dissection of population-structured adaptive traits.
Here, we characterize the genomic diversity, genetic prop-erties, and mapping power of a sorghum NAM population. Sorghum is a diverse and widely adapted cereal crop grown for food, forage, and biomass, which is known for its excellent tolerance to drought and other environmental stressors (National Research Council 1996). Sorghum originated in tropical Africa (ca. 10,000–5000 B.P.), then diffused and adapted globally over the past several thousand to several hundred years, leading to strong population structure by botanical race, geography, and farmer preference (Doggett 1988; Deuet al.2006; Morriset al.2013a). Diverse association panels have been developed to represent global sorghum germplasm (Deu et al. 2006; Casa et al. 2008; Upadhyaya et al.2009). These panels have been used for GWAS of several traits, including some that are geographically structured and thought to underlie adaptation (Morriset al.2013a,b; Rhodes et al.2014; Laskyet al.2015; Zhanget al.2015). These studies have highlighted the challenge of dissecting structured adap-tive traits in diverse association panels (Morriset al.2013a,b; Laskyet al.2015), similar tofindings from other widely adap-ted crops (Huanget al.2010; Famosoet al.2011; Zhaoet al. 2011; Bouchetet al.2013). The objectives of our study were
(i) to characterize the genetic properties of a sorghum NAM population, (ii) to compare the power of QTL detection with NAMvs.diversity panel GWAS forflowering time and plant height, and (iii) to test the hypothesis that the NAM approach improves power to dissect adaptive traits. We describe the genetic properties of the sorghum NAM population, dissect quantitative variation for flowering time and plant height, and demonstrate via simulated QTL that NAM is more power-ful than GWAS for dissecting traits subject to strong selection.
Materials and Methods
Population development
The sorghum NAM population was designed as a resource for genetics and breeding, with 11 parents from the sorghum association panel (Casaet al.2008) chosen to capture impor-tant breeding material and genetic subpopulations (Yuet al. 2013). The common parent, RTx430, is an elite pollinator line that has been widely used in public and commercial breed-ing programs in the U.S. (Miller 1984; Smith and Frederiksen 2000). Ten diverse founder lines were selected to represent global sorghum diversity as alternate parents: Ajabsido, Macia, P898012, SC1103, SC1345, SC265, SC283, SC35, SC971, and Segaolane (Table 1) (Sotomayor-Rios et al.1996; Rosenow et al. 1997; Dahlberg et al. 1998; Rosenow 1999; ICRISAT 2000). Each of the alternate parents was crossed with the common parent RTx430, and the progeny selfed to generate F2populations. From each F2,250 RILs were derived through single-seed descent in Puerto Rico and Kansas to the F6 gener-ation. The resulting NAM population consists of 10 RIL fami-lies, each with,250 RILs, sharing a common parent. Below, when referring to an individual RIL family, we will use the name of the alternate parent (e.g., the Ajabsido family).
Genotyping
1.5 billion reads, 7.6 million unique 64 bp tags (DNA se-quence) were identified. Overall, 90% of unique tags aligned to version 2.1 of the sorghum BTx623 reference genome (Patersonet al.2009; Goodsteinet al.2011). (Note, all gene and QTL positions listed in this study are given in version 2.1 coordinates so may differ from the original published coordi-nates.) Raw genotypes werefiltered for tag coverage (tag found in.5% of taxa), minor allele frequency (MAF) (.0.03), and single marker missing data (,0.8). Afterfiltering, 90,441 SNPs (90K_SNPs) were retained for further analysis of the NAM pop-ulation (File S3) and 282,400 SNPs were retained for analysis of the DA3302 (File S4).
Of the 39,441 annotated genes in the sorghum reference genome (version 2.1), 22% were tagged by a SNP in the gene, and 70% were tagged by a SNP within 10 kb. The average SNP density was one SNP per 7500 bp. The physical position of markers on version 1.4 and 2.1 of the sorghum genome are provided in File S5. Missing genotypes in the NAM RILs were imputed using the FSFHap Plugin (Swarts et al.2014) implemented in TASSEL 5, which corrects geno-typing errors for inbred individuals in full-sib families. Miss-ing genotypes in diverse accessions were imputed usMiss-ing Beagle 4 (Browning and Browning 2013), which is more accurate than FSFHap for diverse germplasm (Swartset al. 2014). We removed 96 RILs with.10% residual heterozygos-ity, and retained 2214 RILs for further analyses (NAM2214). The number of RIL per family ranged from 199 for the Ajabsido family to 232 for the SC971 family.
Genomic analyses
Quantitative assignments of DA3302 genotypes to genetic groups were computed with ADMIXTURE (Alexanderet al. 2009). Based on cross-validation, we used four genetic groups to describe the diverse accessions (File S6). To char-acterize the diversity of the NAM population with respect to global sorghum germplasm, we used principal component analysis with the same number of lines coming from both panels and shared good quality markers. We used a subset of 60,864 SNPs (60K_SNPs) that were polymorphic in both populations with MAF.0.01 in the diverse accessions and
MAF .0.03 in the NAM population. Principal component axes were built using 2148 diverse accessions (DA2148), a balanced subset of DA3302 including 537 accessions from each genetic group, with the FactoMineR R package (Lê et al.2008). The NAM RILs were projected on these axes. Identity-by-state (IBS) was evaluated among parents and RILs using TASSEL 5 (Bradbury et al. 2007). Allelic fre-quencies, MAF, residual (observed) heterozygosity (Ho), and expected heterozygosity (He) were calculated using the Hierfstat R package (Goudet 2005). The intensity of selec-tion at each SNP in DA3302 was estimated using BayeScan (Foll and Gaggiotti 2008). For the NAM population, marker density, gene density and monomorphism rate were calculated using a sliding window of 1 Mb with 500 kb steps. LD was calculated asr2using the models of Sved (1971) and Hill and
Weir (1988).
Genetic maps and recombination rates
Genetic maps were built for each individual family, as well as for the whole NAM population, using CarthaGène (de Givry et al. 2005) (File S7, File S8, and File S9). All markers grouped according to the correct physical chromosomes with LOD scores.15. In thefirst step, statistically robust framework maps were built using an incremental insertion procedure. Markers were retained only if the difference of log-likelihood between maps was .3.0. Finally, markers with LOD score.2.0 and 1.0 were inserted. For the composite map, monomorphic markers within each population were set to missing data. Genetic distances in centiMorgan (cM) were calculated using Haldane’s mapping function (Haldane 1919). The boundaries of the pericentromeric regions were estimated from inflection points of the sigmoid curve created by plotting genetic positionvs.physical position. Using that definition, 20% of mapped markers were located in pericentromeric regions. Chi squared tests for segregation distortion within, and across, families were calculated using the R/qtl package (Arendset al.2010). Recombination rates were calculated within and across families using the MareyMap R package (Rezvoy et al. 2007), with a sliding window of 1 Mb and 500 kb steps.
Table 1 Description of the NAM parent lines
Name PI Origina Type Botanical Race (Working Group) Genetic Structureb
RTx430 655996 Texas A&M Pollinator parent — G = 0.65; C = 0.23; D = 0.08
SC283 533869 Tanzania Converted landrace Guinea (Conspicuum) K = 0.74; G = 0.26
SC1103 576434 Nigeria Converted landrace Guinea K = 0.49; D = 0.36
Segaolane 656023 Botswana Selected landrace Kafir K = 0.98
Macia 565121 ICRISAT Global variety Caudatum (Zerazera) C = 0.99
SC35 534133 Ethiopia Converted landrace Durra D = 0.97
Ajabsido 656015 Sudan Selected landrace Caudatum (Feterita) C = 0.50; D = 0.29; G = 0.21
SC971 656111 Puerto Rico Converted landrace Durra-Kafir K = 0.42; G = 0.4
SC265 533766 Burkina Faso Converted landrace Guinea (Conspicuum) G = 1
SC1345 597980 Mali Converted landrace Caudatum-Bicolor C = 0.85
P898012 656057 Purdue — C = 0.95
a
Geographic origin for landrace-derived accessions, or breeding program origin for improved lines.
Phenotypic data
We phenotyped plant height for F6NAM RILs at two locations, in western Kansas (Hays, KS, 38.8541°N 99.3385°W, semi-arid climate), and eastern Kansas (Manhattan, KS, 39.2125° N 96.5983°W, continental-humid climate) in 2014 (File S10, File S11, and File S12). Plant height was estimated as the mean of two representative plants per row, measured using a barcoded ruler after physiological maturity. We also pheno-typed flowering time in the Manhattan, KS, experiment. Flowering time was defined as number of days until 50% of plants were in anthesis. Families were each grown in a block, and RILs were randomized within family. Each plot consisted of a 3 m row with45 plants. The corresponding planting density was 200,000 plants per hectare—typical for commer-cial production in this region. For comparison with the NAM population, we used previously generated phenotypes (File S13, File S14, File S15, and File S16) for two diverse associ-ation panels of global germplasm (SAP340 and GRIN700), which are subsets of the DA3302 described above. Thefirst panel, SAP340 (n = 340), consisted of accessions from the sorghum association panel (Casaet al.2008) for which flow-ering time and plant height phenotypes were available (Lubbock, TX, semi-arid climate; Weslaco, TX, continental-humid climate) (Brownet al.2006; Casaet al.2008). The SAP340 accessions included global breeding lines and trop-ical landraces converted to short-stature and early maturity (Casa et al.2008; Morriset al.2013a). The second panel, GRIN700 (n = 700), consisted of global breeding lines and landrace accessions for which flowering time data were available in GRIN (scored 1–6 in Lubbock, TX in 2005) (Kimberet al.2013).
QTL mapping
To estimate the proportion of phenotypic variance explained by genetic variation in the NAM population, we fitted a random polygenic term considering all SNP simultaneously by a Restricted Maximum Likelihood (REML) procedure (y = Zu + e) (Yanget al.2010) using an IBS kinship ma-trix. To map QTL in the NAM population (NAM2214), we used a JL model (Buckleret al.2009; Tianet al.2011) and a
multi-locus linear regression model (MLLM) (Giraudet al. 2014) adapted from Seguraet al.(2012). The model can be denoted as:
y¼FaþX c
Mcbcþe;
whereyis the vector (N 3 1) of adjusted phenotypic means forNRILs;Fis a (N 3 P) matrix of 0 and 1 that linked each RIL to the family it belonged,Pbeing the number of families, ais the vector (P 3 1) of family means;Mcis the vector of
genotypes of cofactor c that entered the model and bc its
effect; ande is the vector of residual effects. The adjusted number of independent tests among the 90K_SNPs, Meff, (Li and Ji 2005) was 4375 and the corresponding genome-wide 5% Bonferroni threshold was E205. JL mapping was performed using the forward-backward stepwise linear re-gressionfixed model implemented in the Stepwise Plugin of TASSEL 5, with family as a cofactor. This has been shown to be the most powerful procedure for JL mapping (Würschum et al. 2012). The family main effect wasfitfirst, and then marker effects were selected to enter or leave the model based on the E205P-value calculated for the marginal F-test of that term. For the MLLM model, a forward–backward stepwise linear regression model was fit using family as a cofactor (Giraud et al.2014). The variance components were esti-mated before each step and used to obtain generalized least-square (GLS) effect size estimates and F-test P-values for each SNP. The SNP with the most significant association was added to the model as a cofactor for the next step, and theP-values for all cofactors were re-estimated together with the variance components. The forward regression was stopped when genetic variation estimate divided by pheno-typic variance was close to zero. After backward stepwise regression, the variance components andP-values of all co-factors were again re-estimated. We selected the best model using the extended Bayesian information criterion. Loci of the selected model that hadP-values below the E205 threshold were considered QTL. Note, the difference between JL and MLLM is that JL uses aP-value threshold to include markers in the model and calculate confidence intervals, while the
MLLM stops when no more genetic variation is explained, and re-estimatesP-values for all markers that were not in-cluded in the model using thefinal model.
To map QTL in the diverse association panels (SAP340 and GRIN700) (File S17, File S18, and File S19), GWAS were performed using a forward–backward stepwise multi-locus mixed model (MLMM) (Segura et al.2012). The forward– backward stepwise process is the same as described for MLLM above. This model can be denoted as
y¼QaþX c
McbcþZuþe;
whereQis the matrix of quantitative assignment of each line to each of thefirstn21 (i.e., 3) genetic groups calculated with ADMIXTURE;ais the vector genetic groupsfixed effects;Mcis
the vector of genotypes of cofactorcthat entered the model, and bcits effect;Zis a design matrix relating observations to
poly-genic effects;uis a vector of random polygenic effects with co-variance matrixs2
gK(Kbeing an IBS kinship matrix); andeis a
vector of residual effects. To distinguish this GWAS approach from GWAS in a NAM population (e.g., Tianet al.2011), we will use the term “diversity panel GWAS”(DP-GWAS) to refer to GWAS in diverse association panels. For comparison of NAM
and DP-GWAS, we also carried out JL mapping with resampled (nruns = 10) subsets of the NAM population (NAM340 and NAM700,nRILs = 340 and 700) that were the same size as SAP340 and GRIN700, respectively. For each NAM population subset, we resampled 34 or 70 RILs per family (for NAM340 and NAM700, respectively), and then conducted JL mapping. Given that LD extent in the NAM population was2 cM (i.e., when pairwise marker distances were .2 cM, 90% ofr2
values were,0.1) (Figure S1), QTL were considered shared across methods/runs when colocalized in a 2 cM window.
Simulations and power estimation
To compare the power of QTL detection using NAM vs. DP-GWAS, without any bias due to gene-environment inter-actions (G3E), we investigated simulated traits. Genotyping for the NAM population and the association panel were con-ducted in different experiments using different sequencing depth. This can explain part of nonoverlapping, high-quality polymorphic markers between the two populations. As it was difficult to distinguish monomorphic from bad quality markers, for simulations (File S20) we used the subset (60K_SNPs) that were good quality and polymorphic in both the NAM population and DA2148 (File S21, File S22,
File S23, File S24, File S25, File S26, File S27, File S28, and FileS29). Most of the removed markers were rare in DA2148 (75% had MAF ,0.01) and monomorphic in the NAM (Figure S2). Given that these markers would not be detected in association studies with high confidence, the bias toward NAM for power estimation should be limited. For simulation, 50 random samples of 50 SNPs were assigned as QTL with additive effects following a geometric series (Lande and Thompson 1990; Yu et al. 2008). The genotypic value of each line (RIL or diverse line) was defined as the sum of genotypic values across all loci. The entry-mean heritability (h2) was set to either 0.4 or 0.7. Phenotypic values of lines were obtained by adding normally distrib-uted error to the genotypic values, such that the residual variance was 60% (h2 = 0.4) or 30% (h2 = 0.7) of phe-notypic variance.
Power was compared between a diverse association panel (using MLMM) and the NAM population (using JL or MLLM). The power was calculated for 50 independent runs, and then averaged for each simulation scheme. First, we quantified global power and power for different classes based on variance explained by the QTL. The variance explained was calculated as pqb2, withpthe frequency of allele 1,qthe frequency of allele 2, andbthe SNP effect. Second, we characterized QTL detec-tion power for different classes of selecdetec-tion intensity inferred in DA3302, defined by log10(Posterior Odds).0.5 according to BayeScan. In order to take into account the greater extent of LD in the NAM2214 compared to the DA3302, a true positive was counted (i) when a QTL at the same genetic position was identified as significant in thefinal model, and (ii) when a QTL in a window of 2 cM was identified as significant in thefinal model. The false discovery rate (FDR) was calculated as the number of independent positives at a distance (i).0 cM or (ii).2 cM from the closest QTL, divided by the total number of positives.
Data availability
Sequencing data are available in the NCBI Sequence Read Archive under project accession SRP095629. Other data are available from Dryad Digital Repository (doi:10.5061/dryad. gm073). Plant material: NAM RIL seeds will be submitted to GRIN. Please contact corresponding author for availability.
Results and Discussion
Genetic diversity and structure of the NAM population
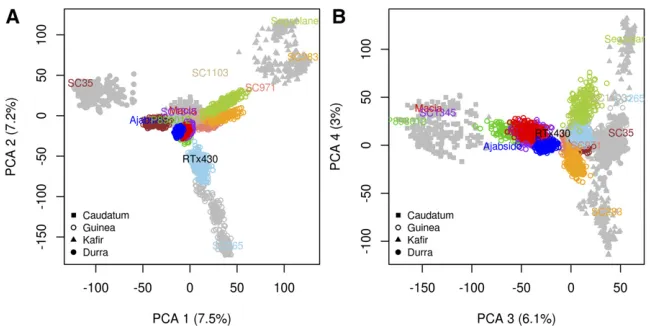
To evaluate the genetic diversity and structure of the NAM population, we characterized 2214 NAM RILs at 90,441 high-quality GBS SNPs, which corresponds to an average density of one SNP per 7.5 kb. Based on technical replicates, the gen-otyping error rate was 0.001. Comparing the number of SNPs discovered in the NAM population to the number of SNPs dis-covered in global accessions (DA2148) (Laskyet al.2015), we estimate that the NAM population captures70% of known polymorphism (MAF ,0.01) in sorghum. To compare the
genetic structure of the NAM population to global acces-sions, we built four PCA axes using lines from the global accessions, and projected NAM RILs on those axes. As expected, the global accessions were structured by botanical race and geographic origin (Harlan and de Wet 1972; Morris et al. 2013a), and the NAM families were clearly clustered, capturing multiple axes of genetic variation (Fig-ure 1). The similarity among full-sib RILs (0.85) was higher than among half-sib RILs (0.75), as expected. Pairwise sim-ilarity between the common parent RTx430 and each alter-nate parent line ranged from 0.71 for SC1103 to 0.77 for Ajabsido. Differences in pairwise similarity between the common parent and each alternate parent led to variation in monomorphism across the genome (Figure 2A and File S30), and among families (ranging from 0.68 for Segaolane to 0.78 for Ajabsido). Monomorphism rate in pericentro-meric regions was similar to the rest of the genome (0.75 vs.0.73).
The genetic structure and diversity of the NAM population may be affected by unintentional selection during RIL devel-opment, which can lead to increased residual heterozygosity and segregation distortion (McMullenet al.2009). Residual heterozygosity in the NAM population was 0.019, close to the expected value for F6generation RILs (0.56 = 0.016). Across the genome 95% percent of markers exhibited heterozygosity,0.035 (Figure 2B and File S31), suggesting that balancing selection had little effect overall. Pericentro-meric regions were enriched in high heterozygosity markers (34% of markers withHo.0.035,vs. 20% of all markers) suggesting that balancing selection did occur in these re-gions. With respect to segregation distortion, the percentage of alleles inherited from the common parent RTx430 (49%) was close to the neutral expectation (50%), suggesting no overall selection for or against common parent alleles. Still, a substantial proportion of markers (15%) showed skewed segregation, for either the common parent (7.8%), or alter-nate parent (7.7%) allele (Figure 2C and File S32), suggest-ing selection at some loci. No clear difference was observed among families in terms of proportion of distorted markers, and skewed chromosome regions were generally specific to one or a few families. One region around theMa1-Dw2locus (40–42 Mb on SBI-06), which harbors major effect loci for
Table 2 NAM composite map statistics
Family # RILs # Markers Length (cM) # CO Rec (cM/Mb)
Ajabsido 199 19,545 1538.7 5,739 2.34
Macia 228 21,531 1225.6 5,540 1.86
P898012 228 24,587 1273.6 5,657 1.93
SC1103 229 25,706 1208.5 5,699 1.84
SC1345 228 22,101 1257.6 5,713 1.91
SC265 220 22,749 1238.6 5,403 1.88
SC283 231 23,561 1284.9 6,036 1.95
SC35 201 23,400 1293.4 5,175 1.96
SC971 232 23,976 1384.1 6,308 2.10
maturity and height (Thurberet al.2013), was skewed to-ward RTx430 in eight of the 10 RIL families, suggesting selection may have acted on this region. The genetic prop-erties for each family and each chromosome are detailed in File S29.
The genomic landscape of recombination
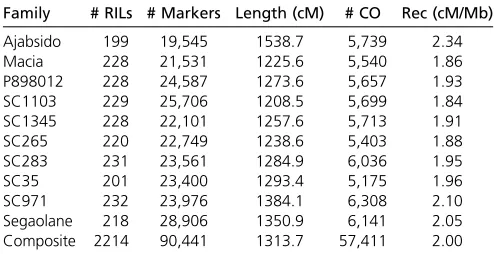
Recombination rates determine the resolution of QTL map-ping, as well as the probability that favorable alleles combine during human and natural selection (Gaut et al. 2007; McMullen et al. 2009). The NAM population captured 57,411 crossovers across 2214 RILs, which corresponds to an average of two crossovers per gene (Figure 2D and File S33). The size of the composite map was 1314 cM (Table 2) (Note, the physical size of the version 2 genome was 658 Mb). The average genome-wide recombination rate was 2.0 cM/Mb, similar to previous estimates in sorghum (Maceet al. 2009). Among families, the genome-wide recombination rate ranged from 1.8 for SC1103 to 2.3 for Ajabsido. The number of cross-overs per RIL was 24.9, or 2.5 per chromosome on average. Several low recombination rate regions were associated with high heterozygosity (Figure 2, A and D). The highest average recombination rate was observed on SBI-01 (2.4 cM/Mb), and the lowest on SBI-07 (1.8 cM/Mb). Crossover counts per chromosome were proportional to chromosome size, rang-ing from4800 for SBI-08, SBI-09, and SBI-10, to.7600 for SBI-01. The recombination rate at each genome position was similar across the NAM families (r = 0.74,P , 10216), as has been observed in maize (Rodgers-Melnicket al.2015).
The recombination map revealed major regional differ-ences in recombination rates associated with chromosome structure. Recombination was concentrated around chromo-some ends (Figure 2D and File S34). Overall, 96% of the variation in recombination rate could be explained by gene content (r = 0.98) and 76% by the distance from the closest telomere (r = 20.87) (Figure S3). The chromosome-scale pattern of crossover events in the NAM population mirrors historical recombination rates in global sorghum diversity panels (Morriset al.2013a), as well as the pattern of cross-over events in experimental crosses in Arabidopsis (Marais et al.2004) and maize (Baueret al.2013; Rodgers-Melnick
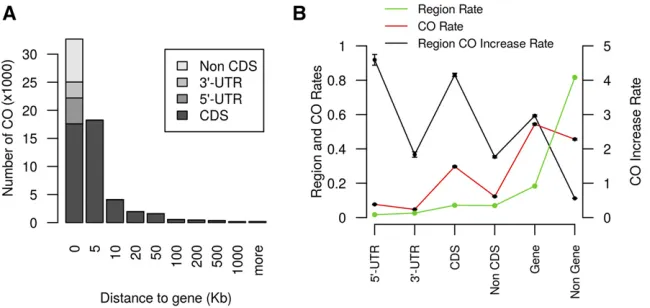
et al.2015). At afiner scale, the pattern of crossover events in the sorghum NAM was associated with gene structure. Cross-over sites were generally in or close to genes (Figure 3A), with 95% occurring,20 kb from a gene, and 54% occurring within genes. The enrichment of crossovers in coding DNA sequence and 59untranslated regions was 4.0- and 4.6-fold, respectively (Figure 3B). The prevalence of crossovers near genes may be explained by the open chromatin (low DNA methylation and compaction) near genes facilitating access to recombination factors and chiasma formation (Saintenac et al. 2011; Rodgers-Melnick et al. 2015). The substantial enrichment of crossovers in and near genes should be useful for mapping and breeding, especially if most trait variation is due to variants located in, or just upstream of, genes, as has been observed in maize (Liet al.2012). Recombination rate was positively correlated with monomorphism rate in all families (1 Mb windows;r = 0.2,P , 10216), suggesting that greater sequence identity promotes crossover formation. This pattern was particularly pronounced in the Ajabsido fam-ily on SBI-06 (monomorphism rate = 0.88, recombination rate = 2.3 cM/Mb). Further studies of mechanisms underly-ing recombination rate differences are needed to predict local recombination rates, and to identify alleles that increase re-combination (Mercieret al.2015).
The genetic map presented in this study is the densest recombination map of the sorghum genome. In previous maps, the shortest average marker interval was 0.79 cM using 1997 markers (Mace et al. 2009). By contrast, the 90,441 markers in this study correspond to at least 8349 unique ge-netic loci, so the density of informative markers was one per 0.16 cM. The large number of markers and informative cross-overs enabled the computation of a high-density recombination map of the sorghum genome, with a consequent substantial increase in resolution compared to previous maps. The individ-ual map length is similar to previous maps (1314 cM in this studyvs.1528 cM for the TAMU-ARS map, and 1227 cM for the CIRAD map). We covered all distal gaps compared to the previous composite maps. The largest remaining gap is 3.9 cM at44 Mb on SBI-06. For future map-based gene cloning, in-dividual RIL families can be targeted or avoided based on re-combination or monomorphism rates. For instance, Ajabsido
and P898012 families may be excluded for QTL located on short arm of SBI-06 due to monomorphism.
Genetic dissection offlowering time and plant height
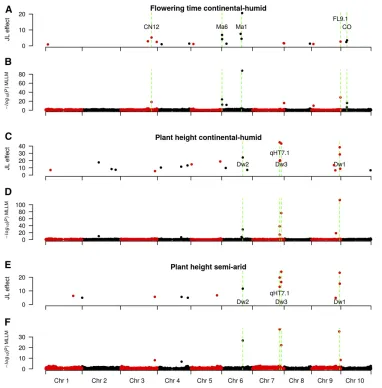
We characterizedflowering time and plant height (Figure 4), which are important contributors to agro-climatic adaptation, and phenotypic covariates for other traits (Buckleret al.2009; Russellet al.2016). The percentage of variance explained by genetic effect was 77% forflowering time and 50% for height (P , 10216). The percentage of variance explained by site for height was 34%. G3E was strongly significant for height (P , 10216), and explained 11% of phenotypic variance. We did not have replicates to estimate G3E forflowering time. In the semi-arid environment, plants were shorter and phenotypic variance was reduced (Figure 4B). This decrease in height was more pronounced for families with tall plants (size decrease ranged from 19% for SC35 to 33% for SC971). We observed abundant transgressive segregation, especially pronounced in families with tall and late phenotypes, like the P898012 family. Considering the significant effect of environment, we performed QTL analyses separately for both environments. Using MLLM and JL, we detected sev-eral major QTL forflowering time and plant height in the NAM population with high resolution (Figure 5, File S35, File S36, File S37, File S38, File S39, File S40, File S41, File S42, File S43, File S44, and File S45). Overall, 18 and 23 highly significant associations (passing the E205 thresh-old) were identified for flowering time and plant height, respectively, in at least one environment. The JL QTL are listed inTable S1, and are described further below.
Genetic variation considering all SNP simultaneously (fit with a random polygenic term) explained 65% of phenotypic variance forflowering time. Eighteen QTL forflowering time were observed, with major effect QTL (.2 days) on SBI-06 (S6_758162, S6_38361618, S6_40204294, S6_41417540), SBI-03 (S3_62707083, S3_55337873, S3_73262074), SBI-10 (S10_12485175), and SBI-09 (S9_58743830). Considering known floral regulators in sorghum (Murphyet al. 2014; Yanget al.2014a,b), there were QTL nearMa6/Ghd7,SbCN12, Ma1/SbPRR37, andSbCO(Figure 5, A and B), but not near Ma3/PhyB,Ma5/PhyC,SbGI,SbCN4,SbCN8, orSbCN15. One flowering time QTL was 2 kb fromMa6(Murphyet al.2014) with MLLM or 84 kb fromMa6with JL. Otherflowering time QTL were detected 64 kb fromSbCN12(Yanget al.2014a), and 63 kb fromMa1 (Murphy et al.2011). Surprisingly, the two largest effect QTL (at S6_38361618 and S6_41417540) were nearMa1(1.2 Mbp downstream and 1.9 Mbp upstream) but not colocalized with this major effect gene. No orthologs of known maize inflorescence regulators (Zhang and Yuan 2014) were located near these QTL, and we did not observe any obvi-ousa posterioricandidate genes under these QTL. They may be synthetic associations (Dicksonet al.2010; Plattet al.2010) or additionalfloral regulators that are not orthologous to known floral regulators in cereals.
Genetic variation explained 74% of phenotypic variance in plant height. Twenty-three QTL for plant height were observed,
with major effect QTL (.15 cm) on SBI-07 (S7_55156401, S7_58487616), SBI-09 (S9_57069231), SBI-06 (S6_42726152), and SBI-02 (S2_33698052) (Figure 5, C–F andTable S1). Plant height QTL were found 122 kb from the Dw3gene (Multaniet al.2003), 25 kb from theDw1gene (Hilleyet al. 2016; Yamaguchiet al.2016), and at theDw2(Morriset al. 2013a) andqHT7.1(Liet al.2015) loci. We confirmed that a region on SBI-09 selected in the sorghum conversion pro-gram (Stephenset al.1967; Morriset al.2013a) fractionates into two QTL, one underlying plant height (Dw1), and one underlyingflowering time (SbFL9.1) (Thurberet al.2013; Higgins et al.2014). The most significant SNP in theDw2 region (S6_42726152) was 6 kb from a histone deacetylase (Sobic.006G067600) that was previously identified as a candi-date forDw2based on GWAS in the SAP (Morriset al.2013a), and was homologous to genes controlling height in maize and rice (Rossiet al.2007; Huet al.2009).
To compare the power of NAM vs. DP-GWAS to detect flowering time and plant height QTL, we mapped these traits in the NAM population, and two diverse association panels (SAP340 and GRIN700), using either the maximum number of RILs available (Figure S4,Figure S5, File S46, and File S47),
or equal-size subsets of RILs, as described below. Unless noted, the given QTL was observed in all runs (nrun = 10) when data subsets were used (i.e., NAM340 and NAM700). For plant height, the two QTL on chromosome 7 at qHT7.1andDw3 (55.16 and 58.48 Mb) were detected with NAM2214 and SAP340, and with NAM340 (8/10 and 10/10 runs, respec-tively). The QTL on SBI-09 (57.07 Mb), 25 kb from Dw1, was detected with NAM2214, NAM340, and SAP340. The Dw2QTL on SBI-06 (42.72 Mb) was detected with NAM2214 and NAM340 (6/10 runs). ForMa1 (SBI-06, 40.27 Mb), the QTL was detected for NAM2214 (62 kb away), and GRIN700 but not for SAP340. One QTL was detected for SAP on SBI-06 at 48 Mb. In subsets of the NAM population, theMa1QTL was observed using NAM700 (6/10 runs), while a QTL located 1 Mb away was observed using NAM340 (6/10 runs). The Ma6locus (SBI-06, 0.67 Mb) was detected with NAM2214 (84 kb away), while the nearest QTL was 2 Mb away for GRIN700, and no QTL was detected in this region with SAP340. The Ma6 locus was detected in NAM340 (3/10 runs) and NAM700 (7/10 runs). The majorflowering time QTL on SBI-09 (58.74 Mb; colocalized with SbFL9.1) was detected with NAM2214, GRIN700, SAP340, NAM700, and
NAM340 (4/10 runs). Taken together, thesefindings sug-gest that the NAM approach more consistently identified known QTL for flowering time and height loci compared to DP-GWAS with equal-size data sets.
Power of NAM vs. DP-GWAS for simulated QTL
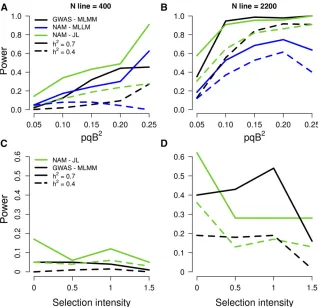
Given that this initial study was conducted in a small number of environments, and environments were different for NAM and DP-GWAS, we investigated simulated traits to circumvent any effect of G3E. To test whether NAM is generally more powerful than DP-GWAS to dissect adaptive traits, we sim-ulated QTL and compared the power of NAM (using JL mapping with NAM2214)vs.DP-GWAS (using MLMM with DA2148) in panels of the same size (full sets,n 2200, or subsets, n = 400) (Figure 6 and File S47). With a large panel and high heritability (n 2200,h2 = 0.7), the ratio of power for the NAM compared to DP-GWAS (“NAM power ratio”) was 1.2. The NAM power ratio was higher under low-power scenarios,e.g., when sample size was small (2.2 when n = 400, h2 = 0.7), or heritability was low (3.6 when n = 400,h2 = 0.4; 1.3 whenn 2200,h2 = 0.4) (Figure 6, A and B). Similarly, the NAM power ratio was higher when
QTL have low effect (4.1 whenpqb2 = 0.05,n 2200, h2 = 0.7). Importantly, the power ratio was higher when QTL were under strong selection pressure in diversity pan-els [BayeScan log10(Posterior Odds) .1.5] (1.8 when n = 2200, h2 = 0.7; 7.5 when n 2200, h2 = 0.4) (Figure 6, C and D). Interestingly, under a high power sce-nario (large sample size and high heritability), the power of DP-GWAS was greater than NAM for QTL under moderate selection, perhaps due to the loss of allelic diversity in the NAM population. One special case of interest was SBI-06, where a low recombination rate and history of strong selec-tion limit mapping of key loci, includingDw2(Kleinet al. 2008; Morriset al.2013a; Thurberet al.2013). The NAM power ratio was much higher for QTL on SBI-06 and under selection pressure (5.1 whenh2 = 0.7,n 2200). In con-trast, no QTL could be detected on SBI-06 in the diverse association panel (Figure S6and File S47). Finally, we consid-ered whether the larger extent of LD in the NAM population lead to a higher FDR. The FDR was,1% using DP-GWAS, but 13% in the NAM using JL (2 cM window,n 2200). Reduced recombination between markers in the NAM population com-pared to the diverse association panel increases FDR, and de-creases the power of QTL detection. One solution to increase power and decrease FDR could be to nest markers within fam-ilies in the model, increase allelic diversity by combining NAM populations with different common parents, and selecting a sub-sample of RIL that maximize the number of crossing-overs.
Our simulations confirm previous findings in maize (Yu et al.2008) that demonstrate the power of NAM to detect
small effect QTL compared to diverse association panels. Fur-ther, we demonstrate the power of NAM to detect QTL at loci under strong selection pressure, especially when heritability or panel size is low. This increase in power is especially im-portant on SBI-06, where low recombination rate and low polymorphism due to selection during breeding have led to low power for QTL detection in temperate association panels (Morriset al.2013a; Thurberet al.2013). In practice, the greater size of the NAM population compared to existing association panels or RIL families can be a challenge for phenotyping. There-fore, field-based high-throughput phenotyping is needed to reveal the full potential of the NAM population, especially for ecophysiological traits that vary on short time scales (Araus and Cairns 2014). If phenotyping the entire NAM population is not possible due to technical or resource constraints, the NAM par-ent lines can be screened to idpar-entify individual families that segregate for the trait of interest. Note, even if parent lines do not vary for a given trait, the NAM population may segregate transgressively for that trait, as occurs for several traits in the maize NAM population (Cooket al.2012; Peifferet al.2014), and forflowering time and plant height in this study. Alterna-tively, as our simulations demonstrate, when heritability is high, a smaller subset of the NAM population can be used effectively for trait mapping.
Conclusions
The sorghum NAM population captures much of the species’ global allelic diversity, and is well suited for mapping com-plex traits that are difficult to map using DP-GWAS. Since
Figure 6 Power of QTL detection using the NAM population vs. a diverse association panel. In top row (A, B), the power of association studies is rep-resented as a function ofpqb2, wherepandqare
the frequencies of alleles 1 and 2, respectively, and
much of the global sorghum breeding effort is focused on stress adaptation traits (National Research Council 1996), the improved power to dissect structured adaptive traits with NAM promises to be valuable for marker-assisted breeding. For breeding programs focused on commercial hybrid sorghum, the sorghum NAM population can facilitate prebreeding by putting exotic alleles into an elite background suitable for QTL discovery. For breeding programs focused on smallholder varieties, the NAM population can facilitate iden-tification of genetic variants from landraces in an international reference background. By leveraging genetic resources and bridging global germplasm, the sorghum NAM resource pro-vides a new platform to understand and improve this climate-resilient crop.
Acknowledgments
The authors thank Renaud Rincent and Heloïse Giraud for sharing scripts; Daniel Hopper, Halee Hughes, and Gerald Rohleder for technical support; Alina R. Ahkunova, Katherine Jordan, Paul St. Amand, and Shuangye Wu for technical assis-tance; and two anonymous reviewers and the editor for sug-gestions that improved the manuscript. The study was carried out using resources at KSU Integrated Genomics Facility and Beocat High Performance Computing cluster. Support for this study was provided by Kansas Grain Sorghum Commission and K-State Research and Extension. This study is contribution 17-280-J from the Kansas Agricultural Experiment Station.
Literature Cited
Alexander, D. H., J. Novembre, and K. Lange, 2009 Fast model-based estimation of ancestry in unrelated individuals. Genome Res. 19: 1655–1664.
Araus, J. L., and J. E. Cairns, 2014 Field high-throughput phenotyp-ing: the new crop breeding frontier. Trends Plant Sci. 19: 52–61. Arends, D., P. Prins, R. C. Jansen, and K. W. Broman, 2010 R/qtl:
high-throughput multiple QTL mapping. Bioinformatics 26: 2990–2992. Bauer, E., M. Falque, H. Walter, C. Bauland, C. Camisan et al.,
2013 Intraspecific variation of recombination rate in maize. Genome Biol. 14: R103.
Bergelson, J., and F. Roux, 2010 Towards identifying genes un-derlying ecologically relevant traits in Arabidopsis thaliana. Nat. Rev. Genet. 11: 867–879.
Bernardo, R. N., 2010 Breeding for Quantitative Traits in Plants, Stemma Press, Woodbury, MN.
Bouchet, S., B. Servin, P. Bertin, D. Madur, V. Combes et al., 2013 Adaptation of maize to temperate climates: mid-density genome-wide association genetics and diversity patterns reveal key genomic regions, with a major contribution of the Vgt2 (ZCN8) locus. PLoS One 8: e71377.
Brachi, B., G. P. Morris, and J. O. Borevitz, 2011 Genome-wide association studies in plants: the missing heritability is in the field. Genome Biol. 12: 232.
Bradbury, P. J., Z. Zhang, D. E. Kroon, T. M. Casstevens, Y. Ramdoss
et al., 2007 TASSEL: software for association mapping of com-plex traits in diverse samples. Bioinformatics 23: 2633–2635. Brown, P., P. Klein, E. Bortiri, C. Acharya, W. Rooney et al.,
2006 Inheritance of inflorescence architecture in sorghum. Theor. Appl. Genet. 113: 931–942.
Browning, B. L., and S. R. Browning, 2013 Improving the accu-racy and efficiency of identity-by-descent detection in popula-tion data. Genetics 194: 459–471.
Buckler, E. S., J. B. Holland, P. J. Bradbury, C. B. Acharya, P. J. Brownet al., 2009 The genetic architecture of maizeflowering time. Science 325: 714–718.
Casa, A. M., G. Pressoir, P. J. Brown, S. E. Mitchell, W. L. Rooney
et al., 2008 Community resources and strategies for associa-tion mapping in sorghum. Crop Sci. 48: 30–40.
Cavanagh, C., M. Morell, I. Mackay, and W. Powell, 2008 From mutations to MAGIC: resources for gene discovery, validation and delivery in crop plants. Curr. Opin. Plant Biol. 11: 215–221. Cook, J. P., M. D. McMullen, J. B. Holland, F. Tian, P. Bradbury
et al., 2012 Genetic architecture of maize kernel composition in the nested association mapping and inbred association pan-els. Plant Physiol. 158: 824–834.
Cooper, M., C. D. Messina, D. Podlich, L. R. Totir, A. Baumgarten
et al., 2014 Predicting the future of plant breeding: comple-menting empirical evaluation with genetic prediction. Crop Pas-ture Sci. 65: 311–336.
Dahlberg, J. A., D. T. Rosenow, G. C. Peterson, L. E. Clark, F. R. Miller et al., 1998 Registration of forty converted sorghum germplasms. Crop Sci. 38: 564–565.
de Givry, S., M. Bouchez, P. Chabrier, D. Milan, and T. Schiex, 2005 CARTHAGENE: multipopulation integrated genetic and radiation hybrid mapping. Bioinformatics 21: 1703–1704. Deu, M., F. Rattunde, and J. Chantereau, 2006 A global view of
genetic diversity in cultivated sorghums using a core collection. Genome 49: 168–180.
Dickson, S. P., K. Wang, I. Krantz, H. Hakonarson, and D. B. Goldstein, 2010 Rare variants create synthetic genome-wide associations. PLoS Biol. 8: e1000294.
Doggett, H., 1988 Sorghum, Longman Scientific & Technical, Har-low, UK.
Elshire, R. J., J. C. Glaubitz, Q. Sun, J. A. Poland, K. Kawamoto
et al., 2011 A robust, simple genotyping-by-sequencing (GBS) approach for high diversity species. PLoS One 6: e19379. Famoso, A. N., K. Zhao, R. T. Clark, C.-W. Tung, M. H. Wright
et al., 2011 Genetic architecture of aluminum tolerance in rice (Oryza sativa) determined through genome-wide associa-tion analysis and qtl mapping. PLoS Genet. 7: e1002221. Foll, M., and O. Gaggiotti, 2008 A genome-scan method to
iden-tify selected loci appropriate for both dominant and codominant markers: a Bayesian perspective. Genetics 180: 977–993. Gaut, B. S., S. I. Wright, C. Rizzon, J. Dvorak, and L. K. Anderson,
2007 Recombination: an underappreciated factor in the evo-lution of plant genomes. Nat. Rev. Genet. 8: 77–84.
Giraud, H., C. Lehermeier, E. Bauer, M. Falque, V. Segura et al., 2014 Linkage disequilibrium with linkage analysis of multiline crosses reveals different multiallelic QTL for hybrid performance in the flint and dent heterotic groups of maize. Genetics 198: 1717–1734.
Glaubitz, J. C., T. M. Casstevens, F. Lu, J. Harriman, R. J. Elshire
et al., 2014 TASSEL-GBS: a high capacity genotyping by se-quencing analysis pipeline. PLoS One 9: e90346.
Goodstein, D. M., S. Shu, R. Howson, R. Neupane, R. D. Hayes
et al., 2011 Phytozome: a comparative platform for green plant genomics. Nucleic Acids Res. 40: D1178–D1186. Goudet, J., 2005 HIERFSTAT, a package for R to compute and test
hierarchical F-statistics. Mol. Ecol. Notes 5: 184–186.
Haldane, J. B. S., 1919 The combination of linkage values and the calculation of distances between the loci of linked factors. J. Genet. 8: 299–309.
Harlan, J. R., and J. M. J. de Wet, 1972 A simplified classification of cultivated Sorghum. Crop Sci. 12: 172–176.
time QTL in partially isogenic Sorghum families. G3 (Bethesda) 4: 1593–1602.
Hill, W. G., and B. S. Weir, 1988 Variances and covariances of squared linkage disequilibria infinite populations. Theor. Popul. Biol. 33: 54–78.
Hilley, J., S. Truong, S. Olson, D. Morishige, and J. Mullet, 2016 Identification of Dw1, a regulator of Sorghum stem in-ternode length. PLoS One 11: e0151271.
Hu, Y., F. Qin, L. Huang, Q. Sun, C. Li et al., 2009 Rice histone deacetylase genes display specific expression patterns and develop-mental functions. Biochem. Biophys. Res. Commun. 388: 266–271. Huang, X., X. Wei, T. Sang, Q. Zhao, Q. Fenget al., 2010 Genome-wide association studies of 14 agronomic traits in rice landraces. Nat. Genet. 42: 961–967.
ICRISAT, 2000 Sorghum variety Macia released in Tanzania. Int. Sorghum Millets Newsl. 41: 7.
Kimber, C. T., J. A. Dahlberg, and S. Kresovich, 2013 The gene pool of Sorghum bicolor and its improvement, pp. 23–41 in
Genomics of the Saccharinae (Plant Genetics and Genomics: Crops and Models 11), edited by A. H. Paterson. Springer, New York. Klasen, J. R., H.-P. Piepho, and B. Stich, 2012 QTL detection
power of multi-parental RIL populations in Arabidopsis thaliana. Heredity 108: 626–632.
Klein, R. R., J. E. Mullet, D. R. Jordan, F. R. Miller, W. L. Rooney
et al., 2008 The effect of tropical Sorghum conversion and inbred development on genome diversity as revealed by high-resolution genotyping. Crop Sci. 48: S-12.
Lande, R., and R. Thompson, 1990 Efficiency of marker-assisted selec-tion in the improvement of quantitative traits. Genetics 124: 743–756. Lasky, J. R., H. D. Upadhyaya, P. Ramu, S. Deshpande, C. T. Hash
et al., 2015 Genome-environment associations in sorghum landraces predict adaptive traits. Sci. Adv. 1: e1400218. Lê, S., J. Josse, and F. Husson, 2008 FactoMineR: an R package
for multivariate analysis. J. Stat. Softw. 25: 1–18.
Li, J., and L. Ji, 2005 Adjusting multiple testing in multilocus analyses using the eigenvalues of a correlation matrix. Heredity 95: 221–227.
Li, X., C. Zhu, C.-T. Yeh, W. Wu, E. M. Takacset al., 2012 Genic and nongenic contributions to natural variation of quantitative traits in maize. Genome Res. 22: 2436–2444.
Li, X., X. Li, E. Fridman, T. T. Tesso, and J. Yu, 2015 Dissecting repulsion linkage in the dwarfing gene Dw3 region for sorghum plant height provides insights into heterosis. Proc. Natl. Acad. Sci. USA 112: 11823–11828.
Liu, W., H. P. Maurer, J. C. Reif, A. E. Melchinger, H. F. Utzet al., 2013 Optimum design of family structure and allocation of resources in association mapping with lines from multiple crosses. Heredity 110: 71–79.
Mace, E. S., J.-F. Rami, S. Bouchet, P. E. Klein, R. R. Kleinet al., 2009 A consensus genetic map of sorghum that integrates multiple component maps and high-throughput Diversity Array Technology (DArT) markers. BMC Plant Biol. 9: 13.
Marais, G., B. Charlesworth, and S. I. Wright, 2004 Recombination and base composition: the case of the highly self-fertilizing plant Arabidopsis thaliana. Genome Biol. 5: R45.
McMullen, M. D., S. Kresovich, H. S. Villeda, P. Bradbury, H. Li
et al., 2009 Genetic properties of the maize nested association mapping population. Science 325: 737–740.
Mercier, R., C. Mézard, E. Jenczewski, N. Macaisne, and M. Grelon, 2015 The molecular biology of meiosis in plants. Annu. Rev. Plant Biol. 66: 297–327.
Meyer, R. S., and M. D. Purugganan, 2013 Evolution of crop spe-cies: genetics of domestication and diversification. Nat. Rev. Genet. 14: 840–852.
Mickelbart, M. V., P. M. Hasegawa, and J. Bailey-Serres, 2015 Genetic mechanisms of abiotic stress tolerance that translate to crop yield stability. Nat. Rev. Genet. 16: 237–251.
Miller, F. R., 1984 Registration of RTx430 sorghum parental line. Crop Sci. 24: 1224.
Morris, G. P., P. Ramu, S. P. Deshpande, C. T. Hash, T. Shahet al., 2013a Population genomic and genome-wide association studies of agroclimatic traits in sorghum. Proc. Natl. Acad. Sci. USA 110: 453–458.
Morris, G. P., D. H. Rhodes, Z. Brenton, P. Ramu, V. M. Thayilet al., 2013b Dissecting genome-wide association signals for loss-of-function phenotypes in sorghumflavonoid pigmentation traits. G3 (Bethesda) 3: 2085–2094.
Multani, D. S., S. P. Briggs, M. A. Chamberlin, J. J. Blakeslee, A. S. Murphyet al., 2003 Loss of an MDR transporter in compact stalks of maize br2 and sorghum dw3 mutants. Science 302: 81–84. Murphy, R. L., R. R. Klein, D. T. Morishige, J. A. Brady, W. L. Rooney
et al., 2011 Coincident light and clock regulation of pseudor-esponse regulator protein 37 (PRR37) controls photoperiodic flowering in sorghum. Proc. Natl. Acad. Sci. USA 108: 16469– 16474.
Murphy, R. L., D. T. Morishige, J. A. Brady, W. L. Rooney, S. Yang
et al., 2014 Ghd7 (Ma6) represses sorghumflowering in long days: Ghd7 alleles enhance biomass accumulation and grain production. Plant Genome 7: 1–10.
Myles, S., J. Peiffer, P. J. Brown, E. S. Ersoz, Z. Zhang et al., 2009 Association mapping: critical considerations shift from genotyping to experimental design. Plant Cell 21: 2194–2202. National Research Council, 1996 Lost Crops of Africa: Volume I:
Grains. National Academy Press, Washington, DC.
Nordborg, M., and D. Weigel, 2008 Next-generation genetics in plants. Nature 456: 720–723.
Olsen, K. M., and J. F. Wendel, 2013 Crop plants as models for understanding plant adaptation and diversification. Front. Plant Evol. Dev. 4: 290.
Paterson, A. H., J. E. Bowers, R. Bruggmann, I. Dubchak, J. Grimwood
et al., 2009 The Sorghum bicolor genome and the diversification of grasses. Nature 457: 551–556.
Peiffer, J. A., M. C. Romay, M. A. Gore, S. A. Flint-Garcia, Z. Zhang
et al., 2014 The genetic architecture of maize height. Genetics 196: 1337–1356.
Platt, A., B. J. Vilhjálmsson, and M. Nordborg, 2010 Conditions under which genome-wide association studies will be positively misleading. Genetics 186: 1045–1052.
Rezvoy, C., D. Charif, L. Guéguen, and G. A. B. Marais, 2007 MareyMap: an R-based tool with graphical interface for estimating recombination rates. Bioinformatics 23: 2188–2189. Rhodes, D. H., L. Hoffmann, W. L. Rooney, P. Ramu, G. P. Morris
et al., 2014 Genome-wide association study of grain polyphe-nol concentrations in global sorghum [Sorghum bicolor (L.) Moench] germplasm. J. Agric. Food Chem. 62: 10916–10927. Rodgers-Melnick, E., P. J. Bradbury, R. J. Elshire, J. C. Glaubitz,
C. B. Acharya et al., 2015 Recombination in diverse maize is stable, predictable, and associated with genetic load. Proc. Natl. Acad. Sci. USA 112: 3823–3828.
Rosenow, D. T., J. A. Dahlberg, G. C Peterson, L. E. Clark, J. W. Sij
et al., 1999 Release of 27 converted sorghum lines. Int. Sor-ghum Millets Newsl. 40: 29–30.
Rosenow, D. T., J. A. Dahlberg, J. C. Stephens, F. R. Miller, D. K. Barnes
et al., 1997 Registration of 63 converted sorghum germplasm lines from the Sorghum conversion program. Crop Sci. 37(4): 1399–1400.
Rossi, V., S. Locatelli, S. Varotto, G. Donn, R. Pironaet al., 2007 Maize histone deacetylase hda101 is involved in plant development, gene transcription, and sequence-specific modulation of histone modifi -cation of genes and repeats. Plant Cell 19: 1145–1162.
Saintenac, C., S. Faure, A. Remay, F. Choulet, C. Ravel et al., 2011 Variation in crossover rates across a 3-Mb contig of bread wheat (Triticum aestivum) reveals the presence of a mei-otic recombination hotspot. Chromosoma 120: 185–198. Segura, V., B. J. Vilhjálmsson, A. Platt, A. Korte, ¨U. Serenet al.,
2012 An efficient multi-locus mixed-model approach for genome-wide association studies in structured populations. Nat. Genet. 44: 825–830.
Smith, C. W., and R. A. Frederiksen, 2000 History of cultivar devel-opment in the United States: from“Memoirs of A.B. Maunder— Sorghum Breeder, p. 191 inSorghum: Origin,History,Technology,
and Production, edited by C. W. Smith, and R. A. Frederiksen. Wiley, NY.
Sotomayor-Rios, A., S. Torres-Cardona, A. Quiles-Belén, C. Torres, and J. A. Dahlberg, 1996 Registration of“Millo Blanco” sor-ghum. Crop Sci. 36: 1406.
Stephens, J. C., F. R. Miller, and D. T. Rosenow, 1967 Conversion of alien sorghums to early combine genotypes. Crop Sci. 7: 396. Stich, B., 2009 Comparison of mating designs for establishing nested association mapping populations in maize and Arabidop-sis thaliana. Genetics 183: 1525–1534.
Sved, J. A., 1971 Linkage disequilibrium and homozygosity of chromosome segments infinite populations. Theor. Popul. Biol. 2: 125–141.
Swarts, K., H. Li, J. A. Romero Navarro, D. An, M. C. Romayet al., 2014 Novel methods to optimize genotypic imputation for low-coverage, next-generation sequence data in crop plants. Plant Genome 7: 1–12.
Thurber, C. S., J. M. Ma, R. H. Higgins, and P. J. Brown, 2013 Retrospective genomic analysis of sorghum adaptation to temperate-zone grain production. Genome Biol. 14: R68. Tian, F., P. J. Bradbury, P. J. Brown, H. Hung, Q. Sun et al.,
2011 Genome-wide association study of leaf architecture in the maize nested association mapping population. Nat. Genet. 43: 159–162.
Upadhyaya, H. D., R. P. S. Pundir, S. L. Dwivedi, C. L. L. Gowda, V. G. Reddyet al., 2009 Developing a mini core collection of sorghum for diversified utilization of germplasm. Crop Sci. 49: 1769–1780.
Vavilov, N. I., 2009 Origin and Geography of Cultivated Plants (D. Love,Tran.), Cambridge University Press, Cambridge, UK. Würschum, T., W. Liu, M. Gowda, H. P. Maurer, S. Fischeret al.,
2012 Comparison of biometrical models for joint linkage asso-ciation mapping. Heredity 108: 332–340.
Yamaguchi, M., H. Fujimoto, K. Hirano, S. Araki-Nakamura, K. Ohmae-Shinoharaet al., 2016 Sorghum Dw1, an agronomically impor-tant gene for lodging resistance, encodes a novel protein involved in cell proliferation. Sci. Rep. 6: 28366.
Yang, J., B. Benyamin, B. P. McEvoy, S. Gordon, A. K. Henderset al., 2010 Common SNPs explain a large proportion of the herita-bility for human height. Nat. Genet. 42: 565–569.
Yang, S., R. L. Murphy, D. T. Morishige, P. E. Klein, W. L. Rooney
et al., 2014a Sorghum phytochrome B inhibits flowering in long days by activating expression of SbPRR37 and SbGHD7, repressors of SbEHD1, SbCN8 and SbCN12. PLoS One 9: e105352.
Yang, S., B. D. Weers, D. T. Morishige, and J. E. Mullet, 2014b CONSTANS is a photoperiod regulated activator of flowering in sorghum. BMC Plant Biol. 14: 148.
Yu, J., M. T. Hamblin, and M. R. Tuinstra, 2013 Association ge-netics strategies and resources, pp. 187–203 inGenomics of the Saccharinae (Plant Genetics and Genomics: Crops and Models 11), edited by A. H. Paterson. Springer, New York.
Yu, J., J. B. Holland, M. D. McMullen, and E. S. Buckler, 2008 Genetic design and statistical power of nested associa-tion mapping in maize. Genetics 178: 539–551.
Zhang, D., W. Kong, J. Robertson, V. H. Goff, E. Epps et al., 2015 Genetic analysis of inflorescence and plant height com-ponents in sorghum (Panicoidae) and comparative genetics with rice (Oryzoidae). BMC Plant Biol. 15: 107.
Zhang, D., and Z. Yuan, 2014 Molecular control of grass infl ores-cence development. Annu. Rev. Plant Biol. 65: 553–578. Zhao, K., C.-W. Tung, G. C. Eizenga, M. H. Wright, M. L. Aliet al.,
2011 Genome-wide association mapping reveals a rich genetic architecture of complex traits in Oryza sativa. Nat. Commun. 2: 467.