On 21 & 22nd February, Organized by
Department of CIVIL, CE, ETC, MECHNICAL, MECHNICAL SAND, IT Engg. Of Vishwabharati Academy’s College of engineering,
Ahmednagar, Maharastra, India
Copyright to IJIRSET www.ijirset.com 153
Linear Programming Approach for Allocation
of Land and Water Resources in Canal
Command Area under Surface Method of
Irrigation- A Case Study
S. B. Gadge, S. D. Gorantiwar, Virendra kumar and Mahesh Kothari
Dept. of Irrigation and Drainage Engineering, Dr. Annasaheb Shinde College of Agricultural Engineering,
Mahatma Phule Krishi Vidyapeeth, Rahuri, India.
Dept. of Soil and Water Engineering, Maharana Pratap University of Agriculture and Technology, Udaipur, India.
Abstract: A linear programming model was formulated to suggest the optimal cropping pattern for surface irrigation in a
command area. The objective of the model was to achieve the maximum net benefits. The objective function of the model was subjected to the constraints viz., the total available water and land during different irrigation periods. The model was applied to the command area of Direct minor no. 3 of the Mula Irrigation Project, Ahmednagar, Maharashtra for different proportions of the total command area of minor no. 3. The model gave the optimal cropping pattern for 431.7 ha of command area having water availability of 171280 m3 during the “ON” period (7 days) of canal rotation for 60% proportion. The net return from the optimal cropping plan was 50.68 Million Rs. The optimal cropping pattern includes allocation of 25.9 ha area for papaya, 25.90 ha for sugarcane, 96.4 ha for Rabi tomato, 6.17 ha for Rabi onion, 78.35 ha for Kharif brinjal, 2.98 ha for cabbage, 55.03 ha for summer brinjal and 12.88 ha for summer onion.
Keywords: Linear programming, Optimal cropping pattern, Water allocation, Canal command area.
I. INTRODUCTION
It is necessary to increase area under cultivation and/or increase production per unit area to meet the increasing demand of food, fiber and fuel for the ever increasing population. As the productivity of irrigated agriculture is more than 2-3 times the productivity of rainfed agriculture it is imperative to bring more area under irrigation. However due to increasing pressure from industries, domestic sector; and increasing awareness for the ecological concern, it is rather difficult to bring additional area under cultivation and allocate additional share of water for agriculture. On the other hand share of water for agriculture is reducing due to priority of water for domestic and industrial sectors in National and State water policies. The other options of increasing production per unit area and per unit water need more scientific utilization of the resources and their optimal allocation to achieve maximum returns.
Copyright to IJIRSET www.ijirset.com 154
resources. Most of the techniques suggested for optimal allocation of these resources are complex and tedious for their wide scale use. These include linear programming, non-linear programming, dynamic programming, evolutionary algorithms etc. Linear programming technique has been found to be having wider application for optimum allocation of land and water resources in the command area of irrigation projects due to its simplicity in formulation and implementation [1-3].
In the present study which aims at developing the optimal cropping pattern for maximization of net returns at minor level of command area, the linear programming technique has been used. This paper first presents the optimization model based on linear programming, the description of case study area with input parameters and then the results of the application of the model to the case study.
II. MODEL DEVELOPMENT
The linear programming model consisting of three major components: an objective function for maximization of net return, a set of linear constraints and a set of non-negativity constraints was developed. The model was formulated to allocate land among the different crops, in order to maximize the net return from the command area. The water supply available at minor inlet was considered as the only source of available water in the command.
The objective function
The areas to be irrigated under different crops are the decision variables. The objective function is to maximize the total net benefits and is given by equation (1).
N n n nX
B
Z
Max
1 (1)Where, Z is the total net benefits, Rs; Xn is thearea to be irrigated under nth crop, ha; Bn is thenet benefit estimated from
irrigation of nth crop, Rs/ha; N is thetotal number of crops and n is thesubscript for crop.
The constraints
Water availability constraint
This constraint states that the total water required for irrigating different crops should not exceed the total water available for irrigation and is represented by equation (2).
i N
n
n n
i
X
Inf
w
1
for i = 1,I (2)
Where win is the irrigation requirement of nth crop during ith irrigation period, ha-m and Infi is theinflow of water through
the outlet during ith irrigation period, ha-m , I is the total number of irrigation periods and i is the subscription for irrigation period.
Land area constraints
This constraint states that the area to be brought under irrigation in any irrigation period for different crops should not exceed the total cultivable area and is represented by equation (3).
i
A
X
N n n
1for i =1, I (3)
where A is the total available cultivable area, ha.
Crop area constraints
On 21 & 22nd February, Organized by
Department of CIVIL, CE, ETC, MECHNICAL, MECHNICAL SAND, IT Engg. Of Vishwabharati Academy’s College of engineering,
Ahmednagar, Maharastra, India
Copyright to IJIRSET www.ijirset.com 155
(4)
(5)
(6)
Where c, q, m are theindices for those crops for which the total area need to be restricted (maximum, equal to and minimum, respectively); C,Q and M are the total number of crops for which the area needs to be restricted (maximum, equal to and minimum, respectively); Amaxc is the maximum area which needs to be restricted for cth crops (ha); Aeqq is
the area which needs to be irrigated for qth crop (ha) and Aminm is the minimum area which needs to be restricted for mth
crop (ha).
Non-negative constraints
Xn ≥ 0 (7)
MODEL INPUT PARAMETERS
Irrigation requirement of crops
Irrigation requirement was estimated by the Equation (8) to (10). Irrigation requirement of nth crop during ith irrigation period i.e. wni in equation (2) was computed by estimating reference crop evapotranspiration as below.
Where is evapotranspiration of nth crop on tth day (m); is reference crop evapotranspiration on tth day (m); and is a crop coefficient of nth crop on tth day.
The crop coefficient values were obtained by the polynomial function of the type given by equation (9).
(9)
Where Tn is the crop growth period of nth crop; and , are the constants of polynomial function for nth crop.
Irrigation requirement was estimated by equation (10)
(10)
Where is the irrigation efficiency; and ,the crop evapotranspiration of nth crop during ith irrigation period, m.
The reference crop evapotranspiration was calculated using the FAO Penman-Monteith method [4]. For realistic estimate of the reference crop evapotranspiration values, the averages of the daily maximum and minimum temperature, maximum and minimum relative humidity, possible sunshine hours, wind speed data and rainfall over the period from 1975 to 2005 were used. The climatological data and other location specific data (altitude, latitude, reflection coefficient etc) needed for FAO Penman-Monteith method were obtained from meteorological observatory located at All India Coordinated Research Project on Water Management, MPKV, Rahuri.
Crop area restrictions
Copyright to IJIRSET www.ijirset.com 156
1. The minimum area under Sugarcane should be 10% of the total outlet command area. 2. The minimum area under all fruit crops together (Papaya, Banana, Pomegranate, grapes and Lime) should be 10% of the total outlet command area.
3. The minimum area under all Kharif crops (Kharif Soybean, Kharif Groundnut, Cotton and Kharif Brinjal) should be 20% of the total outlet command area.
4. The minimum area under all Rabi crops (Rabi Tomato, Rabi Onion, Gram, Potato and Cabbage) should be 40% of the total outlet command area.
5. The minimum area under all summer crops (Summer Brinjal, Summer Cucumber, Summer onion, Summer Okra, Summer Groundnut and Summer Chilli) should be 20% of the total outlet command area.
The coefficients of objective function
The net benefit obtained per unit area (Rs/ha) under different crops are used as coefficients of objective function. These coefficients (Equation1) for different crops under surface irrigation methods are presented in Table 1.
The coefficients of land area constraint
The coefficients of land area constraints for different crops (Equation 3) are presented in Table 2. These constraints indicate presence or absence of a particular crop during the specified irrigation period, depending on the planting/ sowing date and the crop growth period. The total cultivable area during any irrigation period cannot exceed the total command area i.e. 431.75 ha.
The coefficients of water availability constraint
The irrigation requirement of a crop expressed in m for a particular irrigation period is used as coefficients of water requirement constraint. The crop coefficient equations that were used for estimating evapotranspiration of different crops from reference crop evapotranspiration are presented in Table 3. The efficiency of the surface irrigation method was considered to be 60 %. The minimum depth of irrigation was considered as 40 mm. The coefficients of water requirement constraints (Equation 2) are presented in Table 4. The total water requirement during any irrigation period cannot exceed the inflow during the irrigation period i.e. 171280 m3.
Total water availability
Total water availability during a specified irrigation period i.e. Infi in equation (2) was estimated with the help of discharge
of minor and the total number of days during ‘ON’ period of the ith irrigation period.The irrigation interval in this study is 14 days with water delivery period of 7 days. The daily flow at the inlet of the minor during the “ON” period of the canal is 10 cusec. Hence, the total water available at the inlet of minor during the “ON” period of the water supply is 171280 m3. This water availability is considered as the inflow for all 26 irrigation periods of the year.
Crop coefficient data
Since the location specific data on the stage wise crop coefficient was not available, the stage wise crop coefficient for banana, sugarcane, cucumber, grape, brinjal and cabbage were adopted from Allen et al [4]. Similarly, the stage wise crop coefficient for onion, cotton, soybean, potato and tomato were adopted from the Doorenbos et al [5]. However, the location specific data was available for some crops and hence the locally developed crop coefficients were adopted for these crops in the study. The crop coefficient for gram and groundnut were adopted from Patil [6]. Similarly, the crop coefficient data for chilli and okra were adopted from Dhotre et.al [7]. As stated before the crop coefficient curves developed for estimating daily Kc values are presented in Table 3.
CASE STUDY DESCRIPTION
On 21 & 22nd February, Organized by
Department of CIVIL, CE, ETC, MECHNICAL, MECHNICAL SAND, IT Engg. Of Vishwabharati Academy’s College of engineering,
Ahmednagar, Maharastra, India
Copyright to IJIRSET www.ijirset.com 157
Harishchandragad (RL 1425 m) in the high ranges of Sahyadri. The command area of Mula Irrigation Project lies in between latitude 19°15'00" N to 19°45'00" N and longitude 74°30'00" E to 75°15'00" E. The river and command area of the irrigation project are situated in Ahmednagar district, Maharashtra. The reservoir of Mula Irrigation Project is situated at Baragaon Nandur and command area is spread over Rahuri, Newasa, Shevgaon and Pathardi Talukas of Ahmednagar. The total cultural command area encompassed by the minor is 431.75 ha. The discharge of minor at the head regulator is 0.283 cumec. The average annual rainfall in the area is 550 mm. The climate of the area is semi-arid and the average annual temperature is observed to vary from 32 °C to 17 °C.
Crops are grown in two seasons namely Kharif and Rabi together with perennial crops. The recommended cropping pattern of the project includes perennials, two seasonal crops like chilli and cotton, Kharif crops like bajara, paddy, groundnut and vegetables and the Rabi crops like wheat, maize, gram along with a small percent of hot weather crops and un-irrigated pulses.
The Rotational Water Supply system is followed in the canal command area of Mula Irrigation Project. The rotation is based on 7 days “ON” and 7 days “OFF” period. Presently, water users associations are formed in the command and water charges on volumetric basis is proposed.
There are 346 land holders in the command area. The majority of the farmers (52 %) in the study area are marginal farmers. Small farmers constitute for about 33% of the total farming community of the command area. 12 % of the total land holders are in semi- medium category and only 1 % farmers have medium size land holding.
Selection of crops
The crops considered in the analysis are papaya, banana, sugarcane, pomegranate, lime, grapes, Kharif soybean, Rabi tomato, Kharif groundnut, Rabi onion, cotton, gram, potato, Kharif brinjal, cabbage, Summer brinjal, Summer cucumber, Summer onion, Summer okra, Summer groundnut and Summer chilli. Selections of these crops are based on their productivity in the area and the farmer’s preference for the crops.
III. RESULT AND DISCUSSION
The developed model was applied to the case study area under the following assumptions with the input data presented in the previous section.
1. All producers in a command have identical input coefficients. 2. All farmers in a command follow same cropping pattern.
3. The input requirements like labour, fertilizers etc. are not limiting factor for optimal cropping. 4. Land and water are the only limitations for optimal allocation.
The developed model was solved using MS-Excel® software, the Solver. The results of application of the model to the command area of Direct Minor no.3, Mula irrigation project are discussed here.
The model was run for the total command area of the minor. However, the results were infeasible and indicated that the available water was not sufficient. Since, the available water was found to be insufficient to irrigate the entire command area, different proportions of the command area, ranging from 0.4 to 0.7 were considered for irrigation. The crop allocation obtained for different proportions of the command area for irrigation is presented in Table 5. It is observed from Table 5 that as the area to be brought under irrigation is increased, crops with lower water requirement find place in the allocation although their net benefits are less.
Net benefit
Copyright to IJIRSET www.ijirset.com 158
water requirement which may not necessarily yield higher net benefits. Further, increase in area under irrigation increases the allocation to Rabi crops, whereas the allocation to summer and Kharif crops decreases. This is due to the fact that the water requirement of summer and Kharif crop is high compared to Rabi crops.
Figure 2 Effect of area to be brought under irrigation on net benefits generated under surface irrigation method. Optimal cropping pattern
The optimal plan is the one which yields maximum benefit. The optimal crop allocation of the command is observed for irrigation of 60% of the command area. The optimal area allocation includes allocation of 25.9 ha area for papaya, 25.90 ha for sugarcane, 96.4 ha for Rabi tomato, 6.17 ha for Rabi onion, 78.35 ha for Kharif brinjal, 2.98 ha for cabbage, 55.03 ha for summer brinjal and 12.88 ha for summer onion.
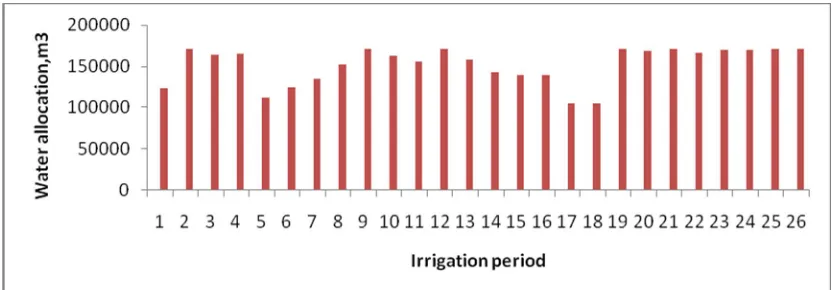
Water allocation under surface irrigation method
Water allocation under the optimal plan (60% irrigation of the command) is presented in Figure 3. The allocation is observed to vary from 6.6 ha-cm (171279 m3) to 4.0 ha-cm (103786 m3) during the year. The maximum allocation is required for the 2nd, 9th, 12th, 19th, 25th and 26th irrigation period. This variation is due to variation in the water requirement during different periods. The water allocation schedule presented in Fig. 3 also acts as the water release schedule for minor no.3 for optimal benefits.
On 21 & 22nd February, Organized by
Department of CIVIL, CE, ETC, MECHNICAL, MECHNICAL SAND, IT Engg. Of Vishwabharati Academy’s College of engineering,
Ahmednagar, Maharastra, India
Copyright to IJIRSET www.ijirset.com 159
IV. CONCLUSIONS
The following conclusions are drawn from the application of model to the command area of Direct Minor no.3, Mula irrigation project:
1. The computer model based on linear programming is useful to find the optimal cropping pattern and water release schedule at the minor level under given scenario of crop mix and water availability.
2. The available water at the inlet of the command area is not sufficient to irrigate the entire command area.It is optimal to irrigate 60% of the command area with the available water of 171279 m3 during the “ON” period (7 days) of canal rotation.
3. It is optimal to allocate 6.0% of total command area to papaya, 6.0 % to sugarcane, 22.33% to Rabi tomato, 1.43% to Rabi Onion, 18.15% to Kharif brinjal, 0.69% to Cabbage, 12.75% to summer brinjal and 2.98% to summer onion.
REFERENCE
[1] W A Hall and J A Dracup. ‘Water Resource System Engineering’. Mc-Graw Hill Book Co., New York, USA, 1970.
[2] D Karmeli, G Peri and M Todes. ‘Irrigation system: Design and operation’, Oxford University press, Cape Town, South Africa, 1985.
[3] K R Reddy, P Sridevi , A Srinivasulu and T V Satyanarayana, ‘Optimal Allocation of Land and Water Resources- a Linear Programming Approach.’ The Andhra Agriculture Journal, vol 49, no. 1 and 2, 2002, pp 102-107.
[4] R G Allen, L S Periera, D Raes and M Smith. ‘Crop Evapotranspiration: Guidelines for Computing Crop Requirement’. Irrigation and Drainage
Paper No. 56, FAO, Rome, Italy. 1998
[5] J Doorenbos, and A H Kassam. ‘Yield Response to Water’. Irrigation and Drainage Paper No. 33, FAO, Rome, Italy. 1979. [6] P D Patil, ‘Stochastic Modelling of Crop Evapotranspiration for Rahuri Region’. M. Tech Thesis submitted to M.P.K.V., Rahuri. 2007
[7] R S Dhotre, N N Firake, S D Gorantiwar, R Patil, R Takte and A Bhosale. ‘Thibak sinchan- Pani va khat vyawasthanpan’(Marathi), Precision
Farming Development Center, Publication No. 603, Mahatma Phule Krishi Vidyapeeth, Rahuri, 2008. pp 45-49.
TABLE 1COEFFICIENTS OF OBJECTIVE FUNCTION (NET BENEFITS, Rs/ha).
Decision variable Description
(Name of the crop)
Coefficient (net benefit) (Rs/ha)
X1 Papaya 237713
X2 Banana 59676
X3 Sugarcane 52772
X4 Pomegranate 685
X5 Lime 134118
X6 Kharif Soybean 20588
X7 Rabi Tomato 164419
X8 Kharif Groundnut 21294
X9 Rabi Onion 133237
X10 Cotton 491
X11 Gram 13904
X12 Potato 60075
X13 Kharif Brinjal 195690
X14 Cabbage 70903
X15 Summer Brinjal 164617
Copyright to IJIRSET www.ijirset.com 160
X17 Summer Onion 146314
X18 Summer Okra 146201
X19 Summer Groundnut 16998
X20 Summer Chilli 58117
On 21 & 22nd February, Organized by
Department of CIVIL, CE, ETC, MECHNICAL, MECHNICAL SAND, IT Engg. Of Vishwabharati Academy’s College of engineering, Ahmednagar, Maharastra, India
Copyright to IJIRSET www.ijirset.com 161
TABLE 2COEFFICIENTS OF AREA CONSTRAINTS
Decision Variable
Crop
Period (constraint) Number 1 2 3 4 5 6 7 8 9 10 11 12 13 14 15 16 17 18 19 20 21 22 23 24 25 26
Copyright to IJIRSET www.ijirset.com 162
On 21 & 22nd February, Organized by
Department of CIVIL, CE, ETC, MECHNICAL, MECHNICAL SAND, IT Engg. Of Vishwabharati Academy’s College of engineering, Ahmednagar,
Maharastra, India
Copyright to IJIRSET www.ijirset.com 163
TABLE3CROPCOEFFICIENTEQUATIONSUSEDFORCALCULATINGTHEEVAPOTRANSPIRATIONFORDIFFERENT CROPS
Sr.No
. Crop Equation
1 Cabbage
2 Brinjal
3 Okra
4 Onion
5 Chilli
6 Ground nut
7 Gram
8 Cotton
9 Grape
10 Soyabean
11 Potato
12 Banana
13 Sugarcane
14 Cucumber
15 Papaya
16 Tomato
Where,
Copyright to IJIRSET www.ijirset.com 164
t = day considered
On 21 & 22nd February, Organized by
Department of CIVIL, CE, ETC, MECHNICAL, MECHNICAL SAND, IT Engg. Of Vishwabharati Academy’s College of engineering, Ahmednagar, Maharastra, India
Copyright to IJIRSET www.ijirset.com 165
TABLE 4COEFFICIENT OF WATER REQUIREMENT CONSTRAINT (mm)
Irrigatio n period Papay a Banan a Grape s Pome- granate Lime
Soybea n R. Tomat o K. G.nu t S. G.nu t R. Onio n S. Onio n Cotto n Gra m Potat o K. Brinja l S. Brinja l Cabbag e Cucumbe
r Okra Chill i
Sugarcan e
1 80.3 76.81 66.67 66.67 66.6
7 - 83.42 - - 66.7 - - 66.67 77.6 - - - 66.67
2 91.8 77.58 70.11 66.67 66.6
7 - 83.04 - 66.6
7 79.5 66.67 - 66.67 75 - 66.7 - - 66.8 - 66.67
3 105 72.91 79.47 68.65 73.2
2 -
71.01
- 70.4
4 93.8 66.67 - 66.67 66.7 - 66.7 - -
66.6
7 - 66.67
4 119 70.99 89.14 76.88 82.0
1 -
66.67 -
89.6 103 71.06 - - - - 66.7 - 66.67
66.6
7 80.03 66.67
5 137 71.56 100.7 87.64 93.4
8
- - - 111.
5 106 96.83 - - - - 70.8 - 67.09
66.6
7 71.45 67.27
6 153 71.59 109 96.94 103.
4
- - - 134.
2 66.7 121.8 - - - - 76.8 - 87.37
81.0
3 66.67 86.23
7 168 72.97 115.3 106.2 113.
2
- - - 159.
9 - 143.3 66.7 - - - 82.8 - 113.6
112.
5 66.67 106.6
8 184 77.53 121.1 117.5 125.
3
- - - 186.
3 - 160.2 66.7 - - - 90.6 - 145.2 147 81.28 130.9
9 204 86.1 126.3 131.6 140.
4
- - - 194.
8 - 167.1 85 - - - 101 - 178.7
175.
2 118 160
10 200 88.09 114.8 131.9 140.
7
- - - 117.
4 - 81.33 104 - - - 101 - 184.5
151.
1 147.5 172.8
11 198 93.39 102.2 133.9 142.
8 66.67
- -
- - - 127 - - - 102 - 176.7 - 175 186.7
Copyright to IJIRSET www.ijirset.com 166
13 79 72.58 66.67 91.04 97.1
1 66.67
- 80.7
2 - - - 114 - - 79.39 70.3 - - - 136.6 139.8
14 72.3 69.97 66.67 81.23 86.6
5 82.79
- 88.7
2 - - - 111 - - 68.72 66.7 - - - 120.9 129.1
15 69.9 70.94 66.67 75.98 81.0
5 101.6
- 93.3
1 - - - 110 - - 66.67 66.7 - - - 107.5 123.9
16 71 74.96 66.67 74.3 79.2
5 109.1
- 100.
3 - - - 109 - - 66.67 66.7 - - - 97.61 123.4
17 75.1 82.03 66.67 75.47 80.5 100.3
- 112.
4 - - - 107 - - 66.67 - - - - 92.43 126.5
18 76.1 85.27 66.67 73.27 78.1
5 66.67 -
116 - - - 95.1 - - 66.67 - - - - 66.67 122.9
19 80.4 91.65 66.67 74.15 79.0
9 - 66.67 106.
6 - - - 80.2 - - 66.67 - 66.67 - - - 123.4
20 78.8 90.75 66.67 69.58 74.2
2 - 66.67 66.6
7 - - - 66.7 - - 66.67 - 66.67 - - - 113.8
21 85.4 98.55 66.67 72.31 77.1
3 - 66.67 - - - 66.67 66.7 66.67 - 78.7 - - - 114.9
22 81.9 93.89 66.67 66.67 70.9
7 - 66.67 - - - 76.05 66.7 66.67 - 86.53 - - - 101.6
23 78.6 88.72 66.67 66.67 66.6
7 - 70.1 - - 66.7 - - 81.26 66.7 66.67 - 88.2 - - - 88.65
24 74.5 82.15 66.67 66.67 66.6
7 - 74.62 - - 66.7 - - 85.84 66.7 66.67 - 77.98 - - - 75.35
25 74 78.82 66.67 66.67 66.6
On 21 & 22nd February, Organized by
Department of CIVIL, CE, ETC, MECHNICAL, MECHNICAL SAND, IT Engg. Of Vishwabharati Academy’s College of engineering, Ahmednagar, Maharastra, India
Copyright to IJIRSET www.ijirset.com 167
26 74.5 75.62 66.67 66.67 66.6
Copyright to IJIRSET www.ijirset.com 168
TABLE 5AREA ALLOCATION UNDER DIFFERENT CROPS FOR DIFFERENT PROPORTION OF IRRIGATION IN COMMAND AREA
Sr.No Crop Total area allocated, ha
Proportion of total command area
0.4 0.5 0.6 0.7
1 Papaya 17.27 (4.0%) 21.59 (5.0%) 25.90 (6.0%) 4.64 (1.07%) 2 S.Cane 17.27 (4.0%) 21.59 (5.0%) 25.90 (6.0%) 30.22 (7.0%)
3 Lime - - - 25.58(5.92%)
4 Kh.Soybean - - - 7.24(1.68%)
5 R.Tomto 45.86 (10.62%) 90.43(20.94%) 96.40 (22.33%) 90.36 (20.93%)
6 R. Onion - - 6.17 (1.43%) 9.06 (2.10%)
7 K.Brinjal 69.08 (16.00%) 82.26 (19.05%) 78.35 (18.15%) 53.21(13.32%) 8 Cabbage 23.22 (5.38%) - 2.98 (0.69%) 21.46 (4.97%) 9 S.Brinjal 69.08 (16.00%) 67.49 (15.63%) 55.03 (12.75%) 62.90 (14.57%) 10 S.Onion 23.22 (5.38%) 14.78 (3.42%) 12.88 (2.98%) 8.48 (1.96%) (Note: figures in parenthesis indicates percentage of total command area)