University of Warwick institutional repository: http://go.warwick.ac.uk/wrap
This paper is made available online in accordance with
publisher policies. Please scroll down to view the document
itself. Please refer to the repository record for this item and our
policy information available from the repository home page for
further information.
To see the final version of this paper please visit the publisher’s website.
Access to the published version may require a subscription.
Author(s): N. J. Wright, R. Greimel, M. J. Barlow, J. E. Drew, M.-R. L.
Cioni, A. A. Zijlstra, R. L. M. Corradi, E. A. González-Solares, P. Groot,
J. Irwin, M. J. Irwin, A. Mampaso R. A. H. Morris, D. Steeghs, Y. C.
Unruh, N. Walton
Article Title:
Extremely red stellar objects revealed by IPHAS
Year of publication: 2008
Link to published article:
arXiv:0808.2441v2 [astro-ph] 4 Nov 2008
A.A. Zijlstra,
7R.L.M. Corradi,
3E.A. Gonz´
alez-Solares,
8P. Groot,
9J. Irwin,
2,8M.J. Irwin,
8A. Mampaso,
10R.A.H. Morris,
11D. Steeghs,
2,12Y.C. Unruh,
5N. Walton
81
Department of Physics and Astronomy, University College London, Gower Street, London WC1E 6BT, U.K.
2
Harvard-Smithsonian Center for Astrophysics, 60 Garden Street, Cambridge, MA 02138, U.S.A.
3
Isaac Newton Group of Telescopes, Apartado de correos 321, E-38700, Santa Cruz de la Palma, Tenerife, Spain
4
Institut f¨ur Physik, Karl-Franzen Universit¨at Graz, Universit¨atsplatz 5, 8010 Graz, Austria
5
Imperial College of Science, Technology and Medicine, Blackett Laboratory, Exhibition Road, London, SW7 2AZ, U.K.
6
Centre for Astrophysics Research, University of Hertfordshire, College Lane, Hatfield, AL10 9AB, U.K.
7
School of Physics and Astronomy, University of Manchester, Sackville Street, PO Box 88, Manchester, M60 1QD, U.K.
8
Institute of Astronomy, Madingley Road, Cambridge, CB3 0HA, U.K.
9
Afdeling Sterrenkunde, Radboud Universiteit Nijmegen, Faculteit NWI, Postbus 9010, 6500 GL Nijmegen, the Netherlands
10
Instituto de Astrofisica de Canarias, 38200 La Laguna, Tenerife, Spain
11Astrophysics Group, Department of Physics, Bristol University, Tyndall Avenue, Bristol, BS8 1TL, U.K.
12Department of Physics, University of Warwick, Coventry, CV4 7AL, U.K.
22 June 2011
ABSTRACT
We present photometric analysis and follow-up spectroscopy for a population of extremely red stellar objects extracted from the point-source catalogue of the INT Photometric Hα Survey (IPHAS) of the northern galactic plane. The vast majority
of these objects have no previous identification. Analysis of optical, near- and mid-infrared photometry reveals that they are mostly highly-reddened asymptotic giant branch stars, with significant levels of circumstellar material. We show that the distri-bution of these objects traces galactic extinction, their highly reddened colours being a product of both interstellar and circumstellar reddening. This is the first time that such a large sample of evolved low-mass stars has been detected in the visual and allows optical counterparts to be associated with sources from recent infrared surveys. Follow-up spectroscopy on some of the most interesting objects in the sample has found significant numbers of S-type stars which can be clearly separated from oxygen-rich objects in the IPHAS colour-colour diagram. We show that this is due to the positions of different molecular bands relative to the narrow-band Hαfilter used
for IPHAS observations. The IPHAS (r′−Hα) colour offers a valuable diagnostic for
identifying S-type stars. A selection method for identifying S-type stars in the galactic plane is briefly discussed and we estimate that over a thousand new objects of this type may be discovered, potentially doubling the number of known objects in this short but important evolutionary phase.
Key words: stars: AGB and post-AGB - stars: chemically peculiar - stars: circum-stellar matter - infrared: stars - surveys - techniques: photometric
1 INTRODUCTION
Evolved low and intermediate mass stars (0.8< M⊙<8.0)
in the asymptotic giant branch (AGB) stage of evolution are some of the most luminous stars in the Galaxy and rep-resent one of the final evolutionary stages of all low and intermediate mass stars. Observations of these evolved stars
carbon is dredged up to the surface (Keenan 1954). The relative rarity of S-type stars has been attributed to the short transition time from oxygen-rich to carbon-rich sur-face chemistry, though there is evidence that this may not be the complete picture (e.g. Chan & Kwok 1991).
Mass-loss during the AGB phase can replenish the inter-stellar medium (ISM) with this processed material and rates of mass-loss are observed to reach up to 10−5
M⊙yr
−1
at the tip of the AGB (e.g. Knapp & Morris 1985; Zijlstra et al. 1992). The cool extended atmospheres of AGB stars are also one of the principle sites of dust formation in the Galaxy. The circumstellar material around such objects contributes to their reddening and, by the time they reach the tip of the AGB, they may become completely obscured at optical wavelengths. These stars are responsible for much of the pro-cessed material returned to the ISM and in doing so drive the evolution of the Galaxy (Busso et al. 1999).
The INT Photometric HαSurvey of the northern galac-tic plane (IPHAS, Drew et al. 2005) is an imaging survey using the Wide Field Camera (WFC) on the Isaac Newton Telescope (INT). The imaging in broad-band Sloanr′
andi′
filters, accompanying narrow-band Hαfilter (λc= 6568 ˚A,
FWHM = 95 ˚A) observations, reaches to at leastr′ = 20.
One of the survey’s main aims is to identify large num-bers of objects in important short-lived phases of stellar evolution (see e.g. Witham et al. 2008; Corradi et al. 2008). The survey covers the entire northern galactic plane in the Galactic latitude range −5◦
6 b 6 +5◦
, a total sky area of 1800 square degrees. More than 90% of the survey area has already been observed and an initial release of data has been made (see Gonz´alez-Solares et al. 2008). The filters employed by IPHAS naturally allow it to highlight red and reddened populations in the galactic plane and it has uncov-ered large numbers of extremely red stellar objects (ERSOs), with (r′
−i′
) colour extending to almost∼6, the majority of which have no previous identification. This work comprises a study of these objects to determine their typical properties and assess the cause of their highly reddened colours.
In Section 2 we present the IPHAS observations and select a population of extremely reddened stellar objects from the point source catalogue (PSC). In Section 3 we anal-yse the photometric properties of these sources to determine their typical properties and in Section 4 we discuss the small fraction of objects with previous identifications. In Section 5 we investigate the galactic distribution of the ERSO sam-ple and compare with galactic reddening maps. In Section 6 we cross-correlate the IPHAS photometry of these objects with photometry from several recent infrared surveys, and assess the fraction of objects with infrared excesses. In Sec-tion 7 we present near-IR spectroscopy of some of the most extreme sources in the colour-colour diagram, including the discovery of several S-type stars in a distinctive region of the IPHAS colour-colour plane. Finally, in Section 8 we outline a method for separating these interesting objects from the complete IPHAS catalogue.
2 SELECTION OF EXTREMELY RED STELLAR OBJECTS FROM THE IPHAS CATALOGUE
Drew et al. (2005) showed that the IPHAS (r′−H
α, r′−
[image:3.612.310.539.96.274.2]i′)
Figure 1.The (r′
−i′
) distribution of all objects in the IPHAS catalogue that fulfill the selection criteria listed in the text, binned into 0.1 magnitude bins. The arbitrary selection level defining extremely red stellar objects (ERSOs), (r′−i′)>3.5, is indicated
with a dashed line.
colour-colour diagram may be used to pick out many dif-ferent types of objects and that the predicted spectral-type trends are congruent with initial results of follow-up spectroscopy. The main-sequence and giant branch can be separated in the colour-colour plane for stars cooler than
∼5000 K, potentially allowing the galactic population of cool giants to be isolated. However, the effects of circum-stellar and intercircum-stellar reddening play an important role in determining the position of stars in the colour-colour dia-gram and the IPHAS catalogue contains a large number of sources with colours up to and in excess of (r′
−i′
)∼5 (see Figure 1).
We have embarked upon a photometric and spectro-scopic study of the extreme IPHAS objects with (r′−i′)>
3.5 (an arbitrary cut-off chosen to give a sizable work-ing catalogue; see Figure 1). This group of ERSOs was compiled from all IPHAS observations taken between Au-gust 2003 and January 2007. The quality criteria used for these data were: seeing less than 2 arcsec; ellipticity less than 0.2; and r′
-band sky counts less than 2000 ADUs (Gonz´alez-Solares et al. 2008). From these we applied the following further quality criteria to all sources:
(i) they must have been detected at least twice in the survey (usually in a direct field and its offset field);
(ii) detections must be classified as ”stellar” or ”probably stellar” (c.f. Gonz´alez-Solares et al. 2008) in the r′
, i′
and Hαbands (for a small number of sources with ”stellar” and ”non-stellar” classifications on separate observations, visual inspection was used to re-classify the data as necessary);
(iii) the mean (r′
−i′
) colour from all valid detections must be greater than 3.5.
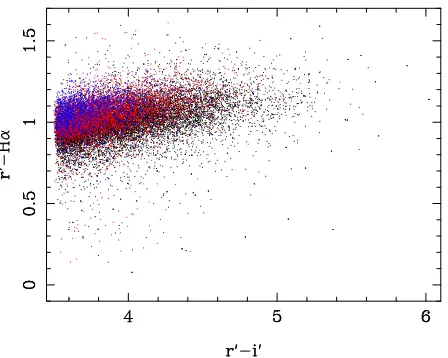
observa-Figure 2.The extremely red region of the IPHAS colour-colour plane, showing the 25,473 objects with (r′ -i′)>3.5. Colours
indicater′
-band magnitudes split into three groups: 14< r′6
17 (blue), 17< r′618.5 (red) andr′>18.5 (black).
tions. If repeat observations are separated by more than a day, the potential for variability to influence magnitudes is increased. Our quality criteria ignore this, since secular mag-nitude changes do not necessarily significantly affect colours, and indeed variability of this nature may aid source classi-fication.
3 COLOUR-COLOUR AND
COLOUR-MAGNITUDE DIAGRAMS OF THE ERSOS
In this section we use IPHAS photometry to analyse the gen-eral properties of the ERSO sample and determine the range of spectral types that may contribute to the sample and the amount of reddening they may require to be included in the sample.
The positions of all 25,473 ERSOs in the IPHAS (r′−H
α, r′−
i′) colour-colour plane can be seen in Figure 2.
These objects are predominantly clustered along a narrow, slightly inclined band at (r′-Hα) ∼1. However, there is a
considerable width to this band, the sample showing varia-tion from below zero to greater than 1.5 (see Figure 3). A part of this spread is probably due to photometric errors in the Hαband at the faint end of the IPHAS PSC, though it is unlikely to be responsible for the full range of (r′−H
α) values seen.
The total histogram of (r′−H
α) colours is shown in the upper panel of Figure 3 where it can be seen to be skewed, peaking at (r′−Hα)≃1. The lower panel shows the spread
in (r′−H
α) in four separate groups of (r′−
i′) colour: all
four contain hints of a second second, smaller peak at a lower (r′−H
α) colour. We will suggest in Section 8 that this may be due to the galactic population of S-type stars.
[image:4.612.323.535.73.277.2]In the main, the ERSOs are likely a combination of intrinsically red objects and highly reddened objects of all spectral types. The intrinsically red objects include late-type dwarf stars, red giant branch (RGB) and asymptotic giant branch (AGB) stars and potentially some red supergiants. We can immediately exclude significant numbers of late-type
Figure 3.Histogram of the number of ERSOs in (r′
−Hα) bins of 0.05 magnitudes.Top panel:All ERSOs.Bottom panel:All the ERSOs separated into four groups as per their (r′−i′) colour.
The vertical scales in both plots are logarithmic.
main sequence stars in the ERSO sample on account of their intrinsic colours and faint absolute magnitudes. Essentially, M dwarfs are so faint that IPHAS imaging only picks them up to distances under 100 pc. And in order for (r′
−i′
) to exceed 3.5, these objects would have to suffer at least∼ 8 magnitudes of extinction (for M6V dwarfs). Together these constraints imply an absurdly high differential extinction (AV >100 per kpc, as a rough lower bound).
Figure 4 shows colour-colour diagrams for three IPHAS fields with well-developed giant branches, each including ob-jects that meet the criteria for ERSOs. The main sequence and giant branches extend to higher (r′−H
α) with decreas-ing stellar temperature because the absorption from TiO in ther′ band increases (Drew et al. 2005). In stars of higher
luminosity class the TiO bands are wider and cause ab-sorption in the Hα filter, which causes late-type stars of higher luminosity to have lower (r′
−Hα) colour. The main-sequence clearly does not extend to sufficiently reddened colours for main-sequence stars to be classified as ERSOs. The two sequences separate around (r′ −i′) ∼ 1, at
ap-proximate spectral type M0III on the giant branch. In the IPHAS colour-colour diagram the giant branch thereafter reddens onto itself (c.f. Drew et al. 2005). Variations in the (r′
−i′
) colour along the giant branch are thus as much as in-dicator of temperature class as of reddening. Stars of higher luminosity classes are expected to be almost coincident with those of giant stars in the colour-colour diagram, but due to their relative scarcity are not expected to contribute signif-icantly to the ERSO sample.
The majority of ERSOs are therefore expected to be giant stars, either on the red giant branch or the asymp-totic giant branch. Figure 5 shows ani′ vs (
r′−
i′)
[image:4.612.52.276.97.276.2]Figure 4. IPHAS colour-colour diagrams for fields 5419 (in Cassiopeia), 4128 and 4150 (both in Scutum) showing all sources with r′<19. The main sequence (upper track) and giant branch (lower, redder track) are clearly visible and separate at red colours. Those
sources with (r′−i′)>3.5 are members of the ERSO sample. Approximate reddening vectors are shown for E(B-V) = 1.
Figure 5.IPHAS colour-magnitude diagram for all ERSOs (red points), compared to IPHAS sources in field 2963, in Cepheus (blue points). Overlaid are reddening loci for three types of giant star: K0 (dash-dotted line), M0 (full line) and M5 (dashed line), for distances of 1kpc (upper line) and 5kpc (lower line). Points along the reddening loci indicate unit intervals of E(B-V) from 0 to 5.
Wide Field Survey webpages1
. The limiting magnitudes of the survey in ther′
andi′
bands are evident in the positions of the faintest sources across the (r′−
i′) colours.
The positions of the ERSOs relative to the reddening loci indicate that they are most probably M-type giant stars, which would be found on the asymptotic giant branch. Ear-lier spectral types, such as K-type giants, are unlikely to significantly contribute to the sample as they will be too faint and not sufficiently reddened to become classified as an ERSO. An M0 (M5) giant star will require a reddening of E(B-V)>4 (2) to become an ERSO (orAv>12 (6) mags),
while a reddening greater than E(B-V) ∼ 5 (6) will make the source too faint to be detected by IPHAS in ther′
band. This reddening may in general be due to a combination of
1
http://www.ast.cam.ac.uk/∼wfcsur/technical/photom/colours/
interstellar dust, and newly created dust in the star’s own ejecta.
4 PREVIOUSLY IDENTIFIED OBJECTS
An early spectroscopic analysis of stars near the ERSO re-gion by Drew et al. (2005) revealed the presence of a mid-M giant and a carbon star. While these were not strictly in the ERSO region as we defined above (their (r′−
i′) colours were
3.39 and 2.97 respectively), they provide a useful indication of the types of object prevalent in this area. We used the SIMBAD2
Astronomical Database to search for previously identified objects within our ERSO sample. Using a search radius of 3 arcsec we found identifications for 223 objects within our sample, less than 1% of the 25,473 ERSOs. 187 of these were variable and included 50 of Mira type. Their distribution in (r′
−Hα) follows that of Figure 2. In addition there were 20 OH/IR stars, all with (r′−
i′)
>4 and con-fined to the densely populated (r′
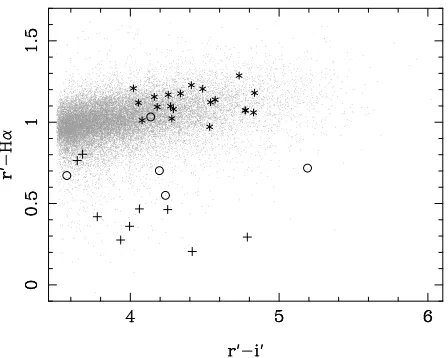
−Hα) band. Our search also uncovered 5 carbon stars and 9 S-type stars. We plot the positions of these last 3 object types in the colour-colour diagram, superposed on the ERSO population, in Figure 6. All nine known S-type stars - identified from objective prism surveys (Stephenson 1990) - appear below the main locus, with all but two appearing significantly lower than the preponderance of sources. Four of the five carbon stars also appear below the main locus, though higher than the distri-bution of S-type stars. One carbon star lies higher, within the main locus. This is V2230 Cyg, a carbon star listed in the General Catalog of Galactic Carbon Stars (Alksnis et al. 2001) that was identified as such by V. Blanco (no sepa-rate publication). Its identification as a carbon star there-fore cannot be properly verified. Its near-IR 2MASS pho-tometry (J−H = 1.2,H−K = 0.6) places it in a region which includes both carbon stars and M-type supergiants (e.g. Zijlstra et al. 1996), so its true identity remains un-known. The remaining carbon stars were either listed in the General Catalogue of Cool Carbon Stars (Stephenson 1973)
2
[image:5.612.51.275.310.487.2]Figure 6.The extremely red region of the IPHAS colour-colour plane with previously identified objects marked. These objects were identified from a SIMBAD search of the ERSO database using a radius of 3 arcsec. Carbon stars are shown as circles, S-type stars are plus symbols and OH/IR stars are star symbols.
or classified on IRAS low resolution spectra by Kwok et al. (1997).
The lower (r′−Hα) values of the known carbon and
S-type stars relative to M giants with more normal surface abundances is indicative of weak or absent TiO bands in the red spectrum (see Figure 19 of Drew et al. 2005; Sec-tion 8 and Figure 19). Our SIMBAD search also revealed one young stellar object (YSO) with (r′ −
i′) = 4
.1 and (r′
−Hα) = 0.8 identified by Felli et al. (2000) based on ISO-GAL mid-infrared photometry, as well as an M5 supergiant, VLH96 A (Vrba et al. 2000). The presence of these objects indicates that our sample may contain a small contamina-tion of objects of earlier spectral type and higher luminosity class, but the considerable reddening required for the former and the scarcity of the latter are unlikely to make either a major contributor to our ERSO sample.
5 THE GALACTIC DISTRIBUTION OF HIGHLY-REDDENED SOURCES
Figure 7 shows the distribution of ERSOs in both galactic longitude and galactic latitude, compared to the distribu-tion of all IPHAS sources. Unlike younger sources, old low-to intermediate-mass evolved stars will not trace galactic structure in the form of spiral arms and star-forming re-gions, but should show a distribution dependent only on galactocentric distance and disk scale height.
The longitude distribution of all IPHAS sources (left panel, Figure 7) shows a peak at l ∼ 55◦ as noted by
Witham et al. (2008). This is thought to correspond to the position of the Sagittarius-Carina spiral arm (e.g. Russeil 2003). From around 70◦
the total number of sources begins to decline, with a dip around l∼80◦, probably associated
with high extinction in the Cygnus region. The distribution of ERSOs shows a very different structure, with an expo-nential drop-off of sources towards increasing longitudes.
[image:6.612.51.275.97.276.2]The latitude distribution of ERSOs is much more peaked towards the galactic equator than that of all IPHAS
Figure 7.Galactic distributions for all IPHAS sources (dashed line) and the ERSO sample (thick black line), divided by the number of IPHAS fields in each bin.Left:Distribution in galactic longitude for 30< l < 210 in 10◦ bins. Right:Distribution in
galactic latitude for −5 < b < +5 in 1◦ bins. The number of
ERSOs has been multiplied by 1000 on both plots to allow both sets of data to be visible.
Figure 8.Meanr′ magnitude (left) and (r′−i′) colour (right)
from IPHAS photometry of the ERSO sample in 1◦galactic
lat-itude bins.
sources (right panel, Figure 7), and peaks at a higher pos-itive latitude. Witham et al. (2008) noted similar proper-ties in comparing the latitude distribution of IPHAS Hα -emitting sources with that of all IPHAS sources (their Figure 4) suggesting that the non-central latitude dis-tribution peak was evidence for the Galactic warp (e.g. Freudenreich et al. 1994).
The concentration of ERSOs towards the galactic equa-tor and towards lower longitudes in Figure 7 can be at-tributed to the denser sight-lines through the galactic disk in these directions. That this effect is not echoed in the distribution of all IPHAS sources is a result of the typi-cal properties of the sources making up each sample. While the general IPHAS population is dominated by intrinsically faint G and K dwarfs, the ERSO and Hα-emitting samples are drawn from a fundamentally more luminous population visible over a larger range of distances in the galactic thin disk.
Both the ERSO and complete IPHAS samples show a small dip in the latitude bin from−1 to 0, which we attribute to the extremely high extinction in the galactic mid-plane. This view is reinforced by the meanr′magnitude of ERSOs
shown in Figure 8 (left panel). The fainter mean magnitude and redder mean (r′−
i′) colour (Figure 8, right panel) of
sources at low galactic latitudes support the interpretation that the ERSO distribution is magnitude-limited at low lat-itudes and volume-limited at higher latlat-itudes.
[image:6.612.305.548.287.381.2]in-terstellar reddening, E(B-V) out to a distance of 2 kpc, ex-tracted from the data presented by Marshall et al. (2006). A comparison between the prevalence of IPHAS sources and the interstellar extinction map shows a strong correlation be-tween regions of high extinction and low IPHAS star counts, as would be expected. At a distance of 2 kpc some areas of the galactic plane reach reddening levels of E(B-V) = 2.5, equivalent to ∼7 magnitudes of extinction in the r′
band, sufficient to obscure many main-sequence stars. The distri-bution of ERSOs shows the opposite trend however, with the extremely red objects confined to regions of the galactic plane with high extinction.
The correlation of ERSOs with interstellar extinction and the anti-correlation with IPHAS sources appears very strong and leads to the explanation that the extremely red colours of the majority of the ERSOs are due to interstel-lar reddening. As was shown in Section 3, late-type giant stars will require a reddening of E(B-V)∼2−6 to become sufficiently reddened for inclusion in the ERSO sample. The areas of the galactic plane with E(B-V)>2 are almost com-pletely coincident with those areas containing ERSOs. Some regions of the plane where galactic reddening is highest (e.g. aroundl= 30−35◦,
b= 0◦) show lower numbers of sources
than in neighbouring high reddening regions. The most plau-sible explanation for this is that the extinction is so high in these regions that even the deep IPHAS photometry cannot detect such reddened objects.
6 CROSS-CORRELATION WITH EXISTING INFRARED CATALOGUES
This section is a comparison of the ERSO sample with data from the large range of existing infrared catalogues to as-sess the incidence and properties of ERSO circumstellar emission. In particular the amount of circumstellar mate-rial typical of these can be parameterised in terms of an infrared colour excess derived from the available photomet-ric databases.
We cross-correlated the ERSO sample of IPHAS sources with objects in the 2 Micron All Sky Survey (2MASS, Skrutskie et al. 2006), the Infrared Astronomi-cal Satellite survey (IRAS, Neugebauer et al. 1984), the Midcourse Space Experiment survey (MSX, Egan & Price 1996), the Infrared Space Observatory (ISO) survey of the inner galaxy (ISOGAL, Omont et al. 2003) and the Galactic Legacy Infrared Mid-Plane Survey Extraordinaire (GLIMPSE, Benjamin et al. 2003). Statistics for the cross-correlations are given in Table 1. The number of matches is dependent on the sky coverage of each survey, the pho-tometric depth and, for mid- and far- infrared surveys, the number of ERSOs with circumstellar emission due to dust. Match radii, specified below, were chosen to be the largest value that avoided the frequent inclusion of more than one counterpart per ERSO.
6.1 2MASS
[image:7.612.313.537.96.272.2]Near-IR photometry of the ERSO sample will be less af-fected by extinction than the optical photometry and may also reveal the effects of different chemistries in the photo-sphere. From the 2MASS database (Skrutskie et al. 2006),
Figure 11.2MASS colour-colour diagrams for all ERSOs as per Figure 10 with the positions of objects with particularly high or lowr′
-Hαcolours indicated.
J (1.25 µm),H (1.65µm) and Ks (2.17 µm) magnitudes
were obtained for the ERSOs. Out of 25473 IPHAS ERSOs, 25411 (99.8%) have 2MASS counterparts within 0.5′′
(to be expected since the two databases are calibrated on the same astrometric system). Of those, 24767 (97.2% of the ERSO sample) had valid detections in all three 2MASS bands (at A-grade level). Figure 10 shows the 2MASS colour-colour diagram for these objects.
Also shown in Figure 10 are the tracks for unreddened main-sequence and giant stars from Bessell & Brett (1988), along with a reddening strip extending up and to the right defined using an RV = 3.1 extinction law. The vast
ma-jority of ERSOs fall in the area characteristic of reddened late-type giants: the spread indicates a range of reddenings, 1< E(B−V)<5. The data in Figure 10 are colour-coded to show that sources with higher (r′−
i′) colour generally
have redder 2MASS colours, in line with expectation. Never-theless, many of the reddest 2MASS sources are not among the reddest IPHAS sources. This will be due to the effects of either warm circumstellar dust, or particularly cool (not-so-severely reddened) photospheres.
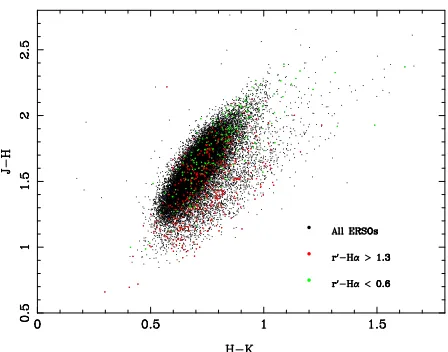
In the (J−H, H−Ks) plane, oxygen-rich long period
variables (LPVs) are expected to lie below the normal giant reddening line, at redder (H −Ks) colours, on account of
their cooler photospheres and TiO, VO, CO and H2O blan-keting. Carbon stars have been found to lie more nearly along the giant reddening line, being generally redder in both (J−H) and (H−Ks), due to CO, CN and C2
blanket-ing (see e.g., Bessell & Brett 1988, , Figure A3). Figure 11 shows this plane with the ERSOs colour-coded according to their (r′
−Hα) index. Objects with low (r′
−Hα) colour ap-pear more clustered towards higher (J−H) and (H−Ks)
colours, unlike the distribution of objects with high (r′
−Hα) colour, which appear more evenly distributed. If carbon stars do have lower (r′
Figure 9. The distribution of ERSOs in the galactic plane for 30< l < 100 compared to all IPHAS sources and compared to the distribution of interstellar extinction. The positions of the IPHAS fields are illustrated as grey rectangles with unobserved fields or fields that did not meet the quality criteria outlined in Section 2 left empty.Top:The positions of all ERSOs shown as black points.Middle:
The total number of IPHAS sources in each IPHAS pointing box is illustrated via the colour of each box with unobserved or poor quality fields left white.Bottom:Galactic interstellar reddening out to a distance of 2 kpc, extracted from Marshall et al. (2006). Unobserved or poor-quality fields are coloured white.
Table 1.Infrared catalogues cross-correlated with the 25,473 IPHAS ERSOs. Numbers of matches include all detections, at any of the photometric points, regardless of quality. The percentage of ERSOs with infrared detections (column 6) applies to all ERSOs, including those in regions not covered by all the infrared catalogues listed.
Catalogue Photometric points Sky coverage Match radius Matches
(µm) (arcsec) Number % of ERSOs
2MASS 1.24 (J), 1.66 (H), 2.16 (Ks) All-sky 0.5 25411 99.8
IRAS 12, 25, 60, 100 All-sky 5 2884 11.3
MSX 8.28, 12.13, 14.65, 21.34 l= 0−360,−5< b <+5 2 9407 37.1
ISOGAL 1.24 (J), 2.16 (K), 7, 15 Selected fields in the galactic-plane 6 102 0.4
GLIMPSE 3.6, 4.5, 5.8, 8.0 l= 10−65,−1< b <+1 1 4397 17.3
6.2 MSX and the fraction of ERSOs with infrared excesses
In Section 5 it was shown that the prevalence of ERSOs is strongly correlated with galactic extinction and that there-fore their highly reddened colours are likely to be domi-nated by it. However, given the evidence in Section 3 that these sources are feasibly late-type giant stars, it is probable that many have circumstellar material which further reddens them. We turn to the MSX survey to assess the fraction of objects with infrared excesses signaling the presence of cir-cumstellar matter.
The MSX survey covers the entire galactic plane at four mid-infrared wavelength, but due to the much higher sen-sitivity of the 8.28 µm band compared to the other three bands, the majority of the 300,000 objects in the MSX point source catalogue are only detected in the 8.28 µm band. There are 9371 ERSOs with valid detections in the 2MASS
Ksband and ”fair” or better quality detections in the MSX
8.28µm band. Hence we use the (Ks−[8]) colour to assess
the IR excess beyond that expected for purely photospheric emission (which, for mid-M giants typical of the ERSO sam-ple is (Ks−[8])∼0.2 Price et al. 2004).
As shown in Section 3, these sources are typically expe-riencing 6-18 magnitudes of visual extinction, or∼0.5−2 magnitudes of extinction in the Ks band. Therefore, to
study their (Ks−[8]) colour we must deredden both the
Ks and 8µm observations. If every object is presumed to
be maximally reddened for its line of sight, they can be dereddened using the total galactic extinction data from Schlegel et al. (1998) and the 8µm relative extinction from Indebetouw et al. (2005). Figure 12 shows the dereddened (Ks−[8]) colour for the 9371 ERSOs with valid detections
in both bands, which peaks around (Ks−[8])∼0.5.
[image:8.612.61.526.466.550.2]col-Figure 10.2MASS colour-colour diagram for all ERSOs with valid quality detections (grades A-D) in all three near-IR bands, with (r′−i′) colours indicated. Tracks for the unreddened main-sequence to M6V (lower black line) and giant branch to M7III (upper black
line), from Bessell & Brett (1988), are shown. A reddening strips are shown as dashed lines extending away from the unreddened positions using an RV = 3.1 extinction law. An E(B-V) = 1 reddening vector is also shown.
umn. In Figure 12 we also show the colours for two parts of the ERSO sample, those at low galactic latitudes (|b|<1.5) and those at high galactic latitudes (|b|>1.5). The marked difference in the distribution of colours between these two samples makes sense as a consequence of the over-estimated extinction, particularly for sources at low latitudes.
A method to overcome this anomaly is to use interstel-lar extinction data evaluated at a finite distance instead of the asymptotic value. We dereddened the 2MASSKs-band
data using extinction data from Marshall et al. (2006) eval-uated at various distances with intervals of 0.25 kpc in the range of 0.5−5.0 kpc. To determine which set of extinction data would best approximate that experienced by the ERSO sample we looked for that which caused the distribution of colours for the low and high galactic latitude ERSO sam-ples to be most coincident. We determined that the most satisfactory overall match could be obtained with extinc-tion data evaluated at 1.5 kpc, a similar distance to that at which the galactic extinction map most closely resembles the ERSO distribution (see Figure 9). The distribution of (Ks−[8]) dereddened colours for this extinction limit are
shown in the bottom panel of Figure 12. The peak has now shifted to (Ks−[8])∼0.8 for both the low and high latitude
distributions.
Applying this dereddening, of the 9371 ERSOs with valid 2MASS and MSX detections, 2156 (23%) have (Ks−
[8]) colours greater than 1.2 which form a tail extending to redder colours and most likely includes many objects with large amounts of circumstellar material. Also of note when comparing the colour distribution between the two
de-reddening methods is that the FWHM has decreased from ∆(Ks−[8]) ∼ 1.2 to ∆(Ks−[8]) ∼ 0.7, which we
inter-pret as evidence that choosing to limit the extinction to the value out to 1.5 kpc is an improvement. Since many of these sources are likely to be thermally-pulsating AGB stars they will experience variability in theKs-band. While
this will affect the spread in colours it should not affect its peak position as we should be sampling sources at all stages in the pulsation cycle. Therefore the typical colour excess, E(Ks−[8]), beyond that due to photospheric emission, is
therefore∼0.5 for these sources.
The colour distributions in the lower panel of Figure 12 are strong evidence for circumstellar material around a large fraction of our ERSOs with MSX detections. But we have to consider whether this is due only to including sources with detections at 8.28µm in the first place. Figure 13 shows the number of ERSOs with and without MSX 8.28 µm detec-tions as a function of their 2MASSKs magnitude. The
de-tection limit of the MSX survey can clearly be seen as a func-tion of the near-infraredKsmagnitude for the ERSOs. 90%
of sources brighter thanKs= 7.5 mag have an MSX 8.28µm
detection, compared to 7% of sources fainter thanKs= 7.5.
Therefore, it appears that the MSX-detected ERSOs are a
Ks-bright subset, selected not on the size of their infrared
excess, but on their predominantly photospheric brightness. This implies that the colour excesses of the ERSOs deter-mined from Figure 12 are not a product of their infrared brightness, but are likely to be true for the entire sample.
Some of theKs-bright ERSOs (Ks <7.5) without an
[image:9.612.120.474.91.383.2]Figure 12.Dereddened (Ks−[8]) colours for all ERSOs with
detections in the 2MASSKs band and the MSX 8.28µm band
(see Figure 13) (full line). Also shown are the (Ks−[8]) colours
for sources at low (|b|<1.5, full line) and high (|b|>1.5, dotted line) galactic latitudes. The data in the upper figure were de-reddened using galactic extinction data of Schlegel et al. (1998) while the data in the lower figure were de-reddened using the 1.5 kpc extinction data from Marshall et al. (2006). The dashed vertical line indicates the expected photospheric colour of a mid-M giant (Price et al. 2004).
Figure 13.Numbers of ERSOs with (thick black line) and with-out (dashed line) MSX 8.28µm fluxes, binned into half-magnitude bins from the 2MASSKsband.
too cold to emit at 8 µm but is detectable at longer wave-lengths. For these 1041 sources, we also searched for detec-tions at longer wavelengths (e.g. ISOGAL and IRAS) and from deeper surveys (e.g. GLIMPSE) and found 327 ER-SOs, mainly in the IRAS 60 and 100µm bands. The lower sensitivity of long wavelength photometry makes the impor-tance of this difficult to quantify, but there are clearly many objects with cold circumstellar dust that have escaped
de-In conclusion, while the extreme red colours of ERSOs are due in large part to interstellar extinction, it also ap-pears to be the case that many of them also exhibit infrared excesses indicative of substantial circumstellar material.
6.3 IRAS
Here we examine the mid- to far- infrared characteristics of the ERSO sample by cross-matching to the IRAS Point Source Catalogue (Beichman et al. 1988). Due to the lower spatial resolution of the IRAS survey (Neugebauer et al. 1984), it was appropriate to use a cross-match radius of 5′′.
2884 (11.3%) ERSOs were found to have detections in one or more of the four IRAS bands at 12, 25, 60, or 100µm. The number of objects with ”high” or ”moderate” quality detec-tions increases towards shorter wavelengths, and the number of ERSO sources which match this requirement in the 12, 25, and 60µm bands is only 206. This low fraction of matches compared to that of 2MASS is a consequence of both the much brighter IRAS limiting magnitude of m12 ∼ 6 and
confusion in the galactic plane. However, the cross-matches are of interest as it allows us to draw on the existing un-derstanding of IRAS colour-colour diagrams: in particular we make use of the discussion by van der Veen & Habing (1988).
The photospheric contribution to emission in the IRAS bands is small, with the properties of circumstellar dust dominating the observed colours. van der Veen & Habing (1988) used the infrared colours, [12]-[25] and [25]-[60], de-fined as
[12]−[25] = 2.5 log
„
F25µm F12µm
«
[25]−[60] = 2.5 log
„
F60µm F25µm
«
to show that a large fraction of evolved IRAS sources fall along a band of increasing log(F12µm/F25µm), which
repre-sents an evolutionary sequence for M and C stars. Figure 14 shows our reproduction of the IRAS two-colour diagram for all ERSOs with ”high” or ”moderate” quality in the 12, 25, and 60µm bands. We also show the regions identified by van der Veen & Habing (1988) that allowed separation of different types of mass-losing star. In the following dis-cussion we compare the fraction of ERSOs in each of these regions to the fraction of sources in those regions in both the total all-sky IRAS catalogue of point sources and just those in the area of the northern galactic plane covered by IPHAS.
[image:10.612.52.273.457.634.2]galactic plane, with only ∼2.7% of sources. One possibil-ity for their absence is that the ERSO sample only includes sources with significant circumstellar material. However, an-other possibility is that our requirement of (r′−i′) >3.5
has feasibly excluded these objects because they are typi-cally less evolved than the mass-losing AGB stars and are likely to have intrinsically bluer colours because of their ear-lier spectral type. Sources with purely photospheric emission will be particularly faint in the 25 and 60µm IRAS bands and the majority may not have been detected in these bands. The low fractions of objects in regions V and VIII can also be attributed to our selection criteria, which will ex-clude planetary nebulae and early-type stars due to their bluer optical colours and extended morphology which will be classified as non-stellar sources in the IPHAS catalogue (Gonz´alez-Solares et al. 2008).
The fractions of sources in the remaining six regions are shown in Table 2 compared to the fractions of IRAS source is those regions from the all-sky catalogue and those in the area of the northern galactic plane. The fractions in these regions are very similar for the three samples. The largest difference is between the regions identified by van der Veen & Habing (1988) as containing significant fractions of C-rich objects, regions VIa and VII, and the regions more associated with O-rich sources, regions IIIa and VIb. The ERSO sample ap-pears to show a higher fraction of O-rich objects than the all-sky IRAS sample, as might be expected for a sample drawn from the higher metallicity galactic disk compared to a sample containing objects from the lower-metallicity halo. However, this trend is not as clear in the sample of galactic plane IRAS sources, throwing doubt on this explanation.
The high fraction of 60µm excess sources in region VIb of the IPHAS sample is echoed in the IRAS NGP sample. The 60µm excess is believed in be indicative of a detached circumstellar shell which might either be due to an interrup-tion to the mass-loss process (Zijlstra et al. 1992) or due to swept-up ISM material (e.g. Wareing et al. 2007). However, the higher fraction of 60 µm excess source in the galactic plane indicates that source confusion and contributions from background emission may be influencing the colours of these samples. Inspection of the IRAS images confirms that this is likely to be responsible for the colours of∼10-20% of the sources in our sample, which might bring the fraction more in line with that of the IRAS all-sky sample.
The low fractions of objects in regions IIIb and IV (both associated with sources with generally thicker circumstellar shells) for the ERSO sample, while not statistically signif-icant given the small number of sources in those regions, could be attributed to the difficulty in detecting highly ob-scured sources in any optical survey.
Of the 4653 IRAS-identified evolved stars in the area of the northern galactic plane covered by IPHAS, only 206 have been associated with ERSOs. If the remaining IRAS sources have optical association in the IPHAS catalogue, they are likely to belong to less optically-reddened sources, despite their strong infrared emission. The similar fractions of objects in the six IRAS regions in Table 2 indicates that the ERSOs do not represent an extreme subset of the overall IRAS sample in terms of circumstellar emission, and there-fore may not necessarily represent the IPHAS sources with the strongest circumstellar excesses.
[image:11.612.310.539.99.280.2]Considering the evidence in Section 5 that the ERSOs
[image:11.612.304.508.481.601.2]Figure 14.IRAS two-colour diagram for all ERSOs with ”high” or ”moderate” quality detections in the 12, 25, and 60 µm IRAS bands. The colours are not colour-corrected and are de-fined in the text. The divisions represent the regions identified by van der Veen & Habing (1988), each of which is characterised by a different type of circumstellar material or environment.
Table 2.Star counts for ERSOs in the different regions of the IRAS two-colour diagram, as specified by van der Veen & Habing (1988). These are compared with the fractions of such objects in both the complete all-sky IRAS catalogue of point sources and all IRAS sources in the area of the northern galactic plane (NGP) covered by IPHAS. Column 2 lists typical properties of the ob-jects found in the region. We show only counts for regions IIIa, IIIb, IV, VIa, VIb and VII, since the other regions are not found to contribute to the ERSO sample due to our imposed selection criteria.
Region IRAS All-sky IRAS NGP ERSOs
No. % No. % No. %
IIIa 3215 25.8 516 17.2 66 33.8
IIIb 675 5.4 122 4.1 5 2.6
IV 258 2.1 44 1.5 2 1.0
VIa 1329 10.7 350 11.7 15 7.7
VIb 4228 33.8 1410 47.1 84 43.1
VII 2769 22.2 551 18.4 23 11.8
Totals: 12474 100 2993 100 195 100
are a sample dominated by the effects of interstellar red-dening, the subset of IRAS-detected ERSOs represent the ERSOs with the brightest circumstellar material (as would be necessary for a detection with IRAS). Whereas as a sub-set of the overall IRAS catalogue, the IRAS-detected ERSOs are those IRAS sources experiencing the strongest interstel-lar reddening.
7 SPECTROSCOPIC FOLLOW-UP OBSERVATIONS
ob-Figure 15.The extremely red region of the IPHAS colour-colour plane showing all ERSOs as grey dots. The positions of all sources for which spectra were taken are shown: star symbols are O-rich stars and plus symbols indicate S-type stars. See the text for discussion of derived spectral types.
jects with (r′−H
α) values significantly below the main strip at (r′
−Hα) ∼1 whose nature is not immediately obvious, but which may include some sources with atypical surface chemistries (see Section 4 for sources already discovered in this area). This section comprises a series of spectroscopic follow-up observations to determine if the extreme objects in the ERSO sample exhibit any particularly notable proper-ties which may allow interesting types of object to be readily extracted from the IPHAS catalogue. The positions in the IPHAS colour-colour plane for the objects discussed in this section are shown in Figure 15.
These observations will be discussed more fully in a future paper, but we summarise the observational proce-dure here. The observations were carried out using LIRIS (Long-slit Intermediate Resolution Infrared Spectrograph, Acosta Pulido et al. 2003), a near-IR spectrograph on the William Herschel Telescope (WHT) on five nights during the summers of 2006 and 2007 in generally good condi-tions. Each target was observed using both the lrzj8 (0.89−
1.51µm) and lrhk (1.40−2.39µm) grisms, giving continu-ous coverage from 0.89-2.39 µm through the z, J, H and K bands. The resolving power was 700 in both grisms. Each target was observed twice at different positions along the slit and the sky observations subtracted to remove the back-ground. Wavelength calibration was performed using argon and xenon lamps available at the telescope. Telluric correc-tion was performed using observacorrec-tions of infrared standard stars made throughout each night. In some regions, where atmospheric transmission was near zero no useful informa-tion could be reconstructed. Finally a continuum was es-timated for each object and the spectrum was divided by this.
The near-IR region was chosen partly because of the high infrared brightness of these sources and also because of the wide range of molecular and atomic lines visible in the infrared. Molecular bands due to TiO, VO, ZrO, and C2
appear through thezandJbands and allow clear chemical
7.1 Objects with lowr′−
Hα colours
The spread of (r′
−Hα) colours below the main band in Figure 2 is quite large, with colours extending down to (r′
−Hα) ∼ 0, well below the early A reddening line iden-tified by Drew et al. (2005) as the lowest expected position of non-degenerate stars with Hα absorption. In Section 4 a small number of previously identified carbon and S-type stars were shown to have colours putting them in this area and we might therefore expect to find more of these types of object in this sample. We have identified 61 objects with (r′
−Hα) < 0.4 in the ERSO region of the IPHAS colour-colour plane, significantly below the expected position of the early-A reddening line at (r′
−Hα) ∼ 0.55−0.60 for (r′−i′) = 3.5−6.0 (the reddened positions of early-A dwarfs,
below which no normal stars should lie, Drew et al. 2005). We have obtained near-IR spectra of 10 targets from this group, including one object with (r′−H
α) = −0.086, the details of which are listed in Table 3, including approximate spectral types derived from the observations. zJ grism spec-tra of all objects are shown in Figure 16.
Of immediate note is the high proportion of objects in this group which display the characteristic ZrO bands of the S-type stars. The strongest ZrO band visible in our spectra is at 0.93-0.96 µm (the b′3
Π−a3
∆ system 0-0 bandhead, Phillips et al. 1979), its distinctive shape and depth allowing it to be distinguished from TiO bands of theǫ-system (e.g. Danks & Dennefeld 1994; Schiavon & Barbuy 1999). How-ever the most unmistakable ZrO bands are the pair at 1.03 and 1.06µm (thea3
∆ 0-1 andB1
Π−A1
∆ 0-0 band heads respectively, Hinkle et al. 1989). We find that six of the ten stars observed show one or more of these features and we thus identity ERSOs 22, 23, 76, 132, 137 and 141 as S-type stars. Many of these also show the 0.974 µm ZrO feature (the head of the B-A ∆ν = −1 band, Davis & Hammer 1981) and the 0.99µm FeH band (the 4
∆−4
∆ 0-0 head, Lambert & Clegg 1980), both visible in the long-wavelength wing of the strong 0.93µm ZrO feature (Figure 16).
[image:12.612.43.283.97.288.2]Table 3.ERSOs with (r′−Hα)<0.4 observed in the near-IR with LIRIS on the WHT. IPHAS photometry is the mean of two or more
observations depending on the need for re-observations. The spectra are shown in Figure 16.
ERSO Name RA (J2000) Dec (J2000) IPHAS photometry 2MASS photometry Spectral
No. r′ r′−i′ r′−Hα J H K
s type
22 IPHAS J010743.47+630523.0 01:07:43.47 +63:05:23.0 17.071 3.600 0.340 8.001 6.555 5.899 SX/6 23 IPHAS J021849.42+622138.8 02:18:49.42 +62:21:38.8 17.996 3.627 0.384 9.143 7.813 7.203 SX/6 80 IPHAS J190708.46+044931.6 19:07:08.46 +04:49:31.6 18.617 4.786 0.294 7.783 6.213 5.217 SC9/8e 81 IPHAS J192706.10+181527.7 19:27:06.10 +18:15:27.7 21.212 3.695 0.295 12.495 10.698 9.950 K-Miii 75 IPHAS J193344.25+194748.3 19:33:44.25 +19:47:48.3 20.348 3.797 0.342 11.338 9.590 8.814 K-Miii 137 IPHAS J202012.43+384657.2 20:20:12.43 +38:46:57.2 19.816 4.390 0.211 9.236 7.209 6.284 SX/6 73 IPHAS J202922.55+400537.2 20:29:22.55 +40:05:37.2 19.790 3.605 -0.086 10.074 8.028 7.049 K-Miii 132 IPHAS J203250.04+414720.8 20:32:50.04 +41:47:20.8 21.806 5.375 0.340 9.676 7.511 6.465 SX/7 76 IPHAS J211036.95+495249.2 21:10:36.95 +49:52:49.2 18.912 4.025 0.077 10.216 8.461 7.507 SX/7e 141 IPHAS J212057.68+470041.4 21:20:57.68 +47:00:41.4 20.293 4.361 0.222 8.794 7.444 6.783 SX/6
Figure 16.zJ grism spectra of objects with lowr′−Hαcolours,
as listed in Table 3. Each spectrum has been corrected for telluric absorption and been divided by an adopted continuum. The spec-tra have been separated by integer values of normalised flux to make each clear and visible. The shaded region indicates a region of low atmospheric transmission where our telluric correction was unable to recover a useful spectrum. Prominent molecular fea-tures have been marked.
index and the temperature type and little work since then has been done in the near-infrared. Joyce et al. (1998) pre-sented J-band spectra of some S-type stars and we have used their work in combination with the guidelines given by Keenan & Boeshaar (1980) to classify these objects.
Of use is the currently unidentified feature at 1.25µm which Joyce et al. (1998) observed in the spectra of many S-type stars, all of which had a high abundance index of 5-7. This coincides with the positions of the ZrS b′-a ∆ν= 0
sequence and the TiS A-X ∆ν= 0 sequence, both of which may contribute to this feature. ERSOs 23, 76 and 141 show prominent features in this area, with ERSOs 23 and 141 also showing evidence for the TiS A-X ∆ν =−1 sequence at 1.17-1.22 µm, an association which may point towards the origin of the feature. The three other S-type stars show minor evidence for small features in this area when com-pared to spectra of non S-type stars, and the absence of any features may be related to the sulphur abundance in these objects instead of just the abundance or temperature index. None of the S-type stars show evidence for clear TiO or VO bands, though many are coincident with the ZrO bands, making them hard to clearly identify. The 1.104 µm TiO band is in a relatively clear region of the spectrum, despite being on the edge of a large telluric feature. It sits along-side the CN red bands (1.088-1.097µm, Hinkle et al. 1989) and the 1.108µm TiS band and the three contributions are easily separable. There is no evidence for TiO bands in this region and this puts strong constraints on the abundance class of these objects. We assign spectral types of either SX/6 (ZrO strong, no TiO) or SX/7 (ZrO weaker, no TiO Keenan & Boeshaar 1980) to these objects, as types listed in Table 3. All these objects have C/O ratios very close to unity and the metal oxide bands vary very weakly with temper-ature (Keenan & Boeshaar 1980) so that ratios of atomic lines are the preferred method for assigning temperature class. Since there are not any identified or calibrated atomic lines ratios in the infrared we are unable to assign tempera-ture classes for these objects and leave them with the symbol X to mark the unknown temperature class.
indica-Tef f <2800 K, indicates a relatively cool photosphere and
a temperature class around 9±2. Its IRAS colours put it in either region IIIa or VIb in Figure 14 (depending on the exact value of the 60µm flux for which there is only an up-per limit available), indicating circumstellar material that is probably O-rich, as would be expected for an object that has been O-rich for most of its life and is only now on the transition to becoming C-rich. The Paschenβline is present in emission, indicating it may be a Mira variable.
The remaining three stars in Figure 16 are relatively devoid of useful features for diagnosing their spectral types. There is no evidence for either the ZrO or TiO features around 0.93 µm and the effects of telluric correction have left the area very noisy. All three sources show CO and OH bands in the H-band which suggests oxygen-rich sur-face chemistries, while the lack of TiO or VO features imply that they are too warm for the molecules to survive (TiO bands in the infrared develop only for types later than M2, Lan¸con et al. 2007). Since CO bands only develop at tem-peratures significantly below∼5000 K (Lan¸con et al. 2007), the spectral types of these objects are around K0-M2.
Out of ten objects with r′−H
α <0.4, seven show evi-dence of being S-type stars. A possible explanation for the unusually low (r′
−Hα) colours of the three O-rich giants is that because they are relatively faint their measurements may have large photometric errors (ERSOs 75 and 81 are fainter than the 10σdetection threshold in ther′band).
De-spite this, it is clear that the area below the main locus in the IPHAS colour-colour plane contains many objects with atypical surface chemistry and C/O ratios close to unity.
7.2 Objects with high r′
-Hαcolours
The high (r′−H
α) side of the histograms in Figure 3 shows relatively little spread. There are 107 objects with (r′−H
α)>1.4, the highest of which reach (r′−H
α)∼1.65. We have taken near-IR spectra of six of these objects, as listed in Table 4 and shown in Figure 17. The presence of objects with an Hα excess in the IPHAS survey has been discussed by Witham et al. (2008) and Corradi et al. (2008) and the latter noted that some symbiotic stars may show IPHAS colours that would put them above the main group in the ERSO region. Mira variables can also show phase-dependent Hα emission due to shocks in their atmosphere from stellar pulsation. If the Hαemission was significant, it could cause a sufficient (r′−H
α) excess to raise the objects above the main group in the colour-colour diagram.
Two of the objects in Figure 17 show clear VO fea-tures around 1.05 µm that mark them out as cool oxygen-rich giants. The VO feature only becomes visible at spectral types M6 and later (e.g. Joyce et al. 1998) and its strength grows with decreasing temperature. ERSOs 122 and 140 are therefore easily classified based upon the strength of this feature. ERSO140 also shows very strong H2O absorption
in the wings of theH-band, a feature indicative of
variabil-Figure 17.zJ grism spectra of objects with highr′−Hαcolours
as listed in Table 4. Each spectrum has been corrected for telluric absorption and has been divided by an adopted continuum. The spectra have been separated by integer values of normalised flux to make each clear and visible. The shaded area indicates a region of low atmospheric transmission where our telluric correction was unable to recover a useful spectrum. Prominent molecular features have been marked.
ity since H2O may form in the cool, extended atmospheres of
highly variable stars. SIMBAD lists ERSO-140 as V563 Cas, an M6 variable star. Based upon its strong VO feature we assign a spectral type of M8.5, in approximate agreement with the previous classification given the variation of spec-tral type expected over the pulsation cycle of an evolved star (e.g. Lan¸con & Wood 2000).
ERSOs 36, 71 and 68 show small depressions around 1.05 µm, which may be due to a VO feature. They all show CO and OH lines in their H-band spectra, so are clearly O-rich and the strengths of the Ks CO bands
[image:14.612.307.546.76.350.2]Table 4.ERSOs with (r′−Hα)>1.4 observed in the near-IR with LIRIS on the WHT as per Table 3. Note: J231655.24+602600.6 does
not have valid detections in the 2MASSJ andH bands. Spectra for all six objects are shown in Figure 17.
No. Name RA (J2000) Dec (J2000) IPHAS photometry 2MASS photometry Spectral
r′ r′−i′ r′−Hα J H K
s type
122 IPHAS J184134.15-022446.0 18:41:34.15 -02:24:46.0 21.844 5.286 1.590 10.343 8.805 8.065 M6.5iii 36 IPHAS J190032.96+030112.7 19:00:32.96 +03:01:12.7 21.899 5.565 1.410 9.515 7.391 6.442 M5.5iii 71 IPHAS J190810.54+110315.8 19:08:10.54 +11:03:15.8 18.108 4.178 1.402 8.419 6.883 6.131 M4iii 68 IPHAS J202243.51+415428.2 20:22:43.51 +41:54:28.2 21.582 5.092 1.513 9.801 7.800 6.863 M4iii 70 IPHAS J203908.44+392129.5 20:39:08.44 +39:21:29.5 22.445 4.604 1.454 11.867 9.843 8.930 M2iii 140 IPHAS J231655.24+602600.6 23:16:55.24 +60:26:00.6 16.094 4.524 1.417 - - 3.227 M8.5iii
absorption and suffers from noisy telluric correction around 0.93µm. The presence of OH bands in theH-region as well as weak TiO absorption at 1.10 µm allows an approximate classification of M2, with an estimated error of±3 subtypes.
All six of the objects with high (r′
−Hα) colours that we have spectra for are O-rich M giants of variable spectral type. We see no evidence for emission lines in the infrared (though the separation between photometric survey obser-vations and near-IR spectroscopic obserobser-vations is 1-2 years which may cause changes in some spectral features if the stars are variable). Their high (r′−H
α) colours may have been due to temporary Hαemission from circumstellar ma-terial, or particularly deep molecular features in ther′band
that would cause the pseudo-continuum to be lower than is usual for M-giants (see Section 8 for a discussion of this effect).
7.3 Objects with extremely high r′−
i′
colours
While the ERSOs predominantly have 3.5<(r′
−i′
)<5.0, there are a small numbers of objects up to (r′−
i′)∼6
.0. We have identified 19 objects with (r′
−i′
)>5.5 and have obtained near-IR spectra of 5 of them, as listed in Table 5 and shown in Figure 18 (except ERSO-36 which is shown in Figure 17 since it has both high (r′−Hα) and (r′−i′)
colours).
Of immediate note is the presence of VO bands in the spectra of all five objects, as well as the TiO bands at 0.93 and 1.10 µm, which marks all these objects as par-ticularly late M-giants. ERSOs 2, 3 and 131 all show partic-ularly strong H2O absorption in the wings of the H-band,
which has been shown to be evidence for stellar variability (Lan¸con & Wood 2000).
ERSOs 1 and 3 show very strong CO bands in theirH -band with no evidence for OH features. This indicates that their C/O ratios may be close to unity, though the presence of strong O-rich features and no evidence fors-process
en-richment confirms that these objects are still O-rich giants and have yet to become S-type stars (though not all M-type stars will be able to dredge up enough carbon during their AGB lifetime to make this transition - it is dependent on their initial mass). Due to the presence of VO bands, accurate spectral classification is relatively simple and the classifications in Table 5 are estimated to be accurate to±1 spectral subtype.
The extremely red colours of these objects may partly be due to their late spectral types, but they are only slightly later than the objects in Table 4. The difference in (r′−
i′)
Figure 18.zJ grism spectra of objects with high (r′
−i′
) colours, as listed in Table 5. Each spectrum has been corrected for telluric absorption and has been divided by an adopted continuum. The spectra have been separated by integer values of normalised flux to make each clear and visible. The shaded area indicates a region of low atmospheric transmission where our telluric correction was unable to recover a useful spectrum. Prominent molecular features have been marked.
colour between an M5 and M10 giant is∼1.1 at any partic-ular reddening (Drew et al. 2005), approximately equivalent to the reddening effect of E(B-V)∼1.6, which indicates that both factors could be important in producing objects with significantly reddened colours. The infrared excesses of all five objects in Table 5 are significantly higher than the typ-ical excesses of our overall sample of ERSOs and indicates a contribution from circumstellar material to the IPHAS colour.
[image:15.612.301.544.140.454.2]iii 3 IPHAS J184859.24-011234.1 18:48:59.24 -01:12:34.1 21.838 6.021 1.140 8.613 6.552 5.399 M6iii 36 IPHAS J190032.96+030112.7 19:00:32.96 +03:01:12.7 21.899 5.565 1.410 9.515 7.391 6.442 M5.5iii 131 IPHAS J202905.52+394245.8 20:29:05.52 +39:42:45.8 20.502 5.874 1.347 6.768 4.780 3.750 M6.5iii
a sight-line to be gauged, and so allow an estimate of the amount of circumstellar reddening.
8 SELECTING CHEMICALLY DIVERSE STARS FROM THE IPHAS CATALOGUE
It was shown in Section 7.1 that a significant fraction of ob-jects with (r′−Hα) colours below the main stellar locus are
S-type stars, their spectra exhibiting the ZrO bands indica-tive of a near-unity surface C/O ratio. This is expected to not just be true for the extremely red objects (r′−
i′
>3.5), but for all IPHAS sources which exhibit colours indicative of evolved late-type stars (e.g. Figure 4). This section explains why these objects lie in a separate region of the IPHAS colour-colour plane to O-rich evolved stars and discusses a potential method for confidently extracting these objects from the IPHAS point source catalogue.
S-type stars occupy a short-lived but important evolu-tionary phase during the transition from O-rich to C-rich surface chemistry. The short duration of this evolutionary phase, combined with the lack of any photometric method in the optical or infrared to identify these objects contributes to the rarity. A search of the SIMBAD database reveals 938 known S-type stars, reinforcing their relative scarcity amongst evolved stars when compared to the much larger number of M-type stars known.
8.1 The IPHAS Hαfilter as a molecular chemistry indicator
Figure 19 shows optical spectra obtained with the Multi-ple Mirror Telescope (MMT) HectoSpec facility for three chemically different types of cool, evolved star. These were obtained as part of a follow-up programme designed to ex-plore the IPHAS colour-colour plane which will be described in a future paper (Steeghs et al. 2008, in preparation). Drew et al. (2005) provide details of the field in Cepheus from which the M and C star HectoSpec spectra were ob-tained. The S-type star spectrum was taken from a later HectoSpec observation of a field in Aquila.
In the spectra of cool oxygen-rich stars the continuum within ther′-band is depressed by strong molecular
absorp-tion bands due to TiO and VO, however the bandpass of the narrow Hαfilter lies between these absorption features and does not experience strong depression. The result of this is that as the photospheric temperature decreases and the molecular bands deepen, the (r′
[image:16.612.43.540.136.217.2]−Hα) colour of the ob-jects increases. For carbon-rich obob-jects the main molecular bands are due to CN or C2, the deepest features of which
Figure 19.Spectra of three evolved stars taken from the IPHAS follow-up spectroscopy programme using HectoSpec, a multi-objects spectrograph on the MMT (Drew et al. 2005). Ther′and
Hαfilter profiles are shown overlaid with dashed and dotted lines respectively.
lie longwards of 7000˚A, the long-wavelength end of the r′
filter. Without the TiO or VO absorption in the continuum
r′
-band, the typical (r′
−Hα) colours of carbon stars are ex-pected to lie below those of oxygen-rich stars by a small amount.
An intermediate chemical class of object, S-type stars can show a range of molecular absorption bands. As the C/O ratio approaches unity, bands of ZrO start to appear along-side the TiO bands, which gradually decrease. According to the spectral classification system of Keenan & Boeshaar (1980), ZrO bands reach a strength equal to the TiO bands at type SX/3, while ZrO is at its strongest and TiO becomes non-existent at SX/6. As the TiO bands weaken, the contin-uum within ther′
-band will strengthen, but strengthening of the ZrOλ6456 feature, which partly falls within the Hα
filter, will cause the flux in this filter to decrease. The over-all effect of this is for (r′−H
[image:16.612.304.549.229.493.2]Figure 20.IPHAS colour-colour diagrams for IPHAS fields 6431 and 4535, which contain the low (r′−Hα) index objects ERSO
76 and 80, respectively (circled objects). The sources plotted are those in the magnitude ranger′= 18−19, a 1 magnitude interval
containing the target objects. Also shown are the unreddened main-sequence (red) and giant branch (green) tracks, as well as the early-A reddening line (blue dashed line). The black vertical dashed line shows the (r′−i′)>3.5 limit for ERSOs.
a maximum at type SX/6, where ZrO bands are at their deepest and where there are no TiO bands.
The spectral subtype SX/6 corresponds to C/O∼0.98 (Keenan & Boeshaar 1980), and a large fraction of stars of this type were detected in Section 7.1. As the C/O ratio in-creases beyond this value the ZrO bands weaken and become invisible by SCX/8 (C/O∼1), above which the bands of C2
begin to appear. This will have the effect of increasing the (r′
−Hα) index again, though it should not reach the levels corresponding to O-rich objects.
8.2 A proposed selection method for chemically diverse evolved stars
Using this information it should be possible to select these chemically diverse S-type stars using a method similar to that applied by Witham et al. (2006) in selecting ob-jects with an Hα excess above the main locus in the IPHAS colour-colour diagram. The relatively reddening-indepentdent nature of the (r′−H
α) colour (Drew et al.
2005) will make the separation of S-type stars in colour space particular noticeable in comparison to the effects of interstellar reddening. Figure 20 shows IPHAS colour-colour diagrams for IPHAS fields 6431 and 4535 which contain the low (r′−H
α) objects ERSO 76 and 80 (see Table 3), both spectroscopically confirmed as S-type stars in Section 7.1.
Fields 6431 and 4535 lie in Cygnus (l= 91.0,b= 1.35) and Aquila (l = 39.3, b = −1.17) respectively, and both show clear late main-sequence and giant branches. For both fields the two S-type stars are clearly distinct at a lower (r′−H
α) colour than the giant branches and even below the early-A reddening line. Field 6431 also shows another po-tential S or C star at (r′−H
α,r′−
i′)∼(0
.55,3.1), just out-side of the ERSO region. Field 4535 contains an object at (r′−H
α,r′−
i′)∼(0
.1,1.2), which, due to its bluer colours, is more likely to be a white dwarf than an AGB star (white dwarfs are another class of object which can appear signifi-cantly below the main stellar loci, Drew et al. 2005).
A simple photometric technique for selecting reddened objects below the giant branch would be able to identify all these sources. The three objects in Table 3 that are not S-type stars are notably among the faintest objects in that sample and all haver′ magnitudes close to the magnitude
limits of their observed fields and could thus be excluded from such a search.
The contributions to these sources from S type stars and carbon stars is not yet quantifiable. The particularly low (r′−H
α) colours of the objects discussed in Section 7.1 may have led to the selection of S-type stars over carbon stars; but the pre-identified objects discussed in Section 4 imply that carbon stars may not show such a strong photometric separation from the giant branch as do the S-type stars.
In Figure 3 the histogram of (r′
−Hα) colour for all ER-SOs provides evidence for a separate population at a lower (r′
−Hα) colour than the main locus. The expected colours of S-type stars indicate that they could very well account for this extension to low (r′−H
α) index and reveals that a clear separation of populations is possible.
To assess the number of chemically diverse evolved stars that may be selected by this method, we have considered the IPHAS colour-colour diagrams for a number of fields across the galactic plane and identified those objects that lie significantly below the giant branch. We studied twenty fields in each of the regions of Aquila (l= 40−50), Cygnus (l = 90−100), Perseus (l = 150−160) and Taurus (l = 180−190, in the anticentre direction). We analysed each field at various magnitude cuts up to an appropriate magnitude limit for each field and only considered objects that were clearly separable from a well defined giant branch and had an (r′
−i′
) colour indicative of a late-type evolved star. In the four regions of Aquila, Cygnus, Perseus and Taurus, the average number of objects identified per field was 0.85, 1.05, 0.25 and 0.20 respectively.
If these count rates are integrated over the entire north-ern galactic plane of 7635 IPHAS fields (not including offsets since they mainly cover the same area), this would result in ∼ 4700 late-type evolved objects objects with (r′−H


![Figure 12. Dereddened (Ks − [8]) colours for all ERSOs withdetections in the 2MASS Ks band and the MSX 8.28 µm band(see Figure 13) (full line)](https://thumb-us.123doks.com/thumbv2/123dok_us/9742853.475247/10.612.52.273.457.634/figure-dereddened-colours-ersos-withdetections-mass-band-figure.webp)


